Byteball
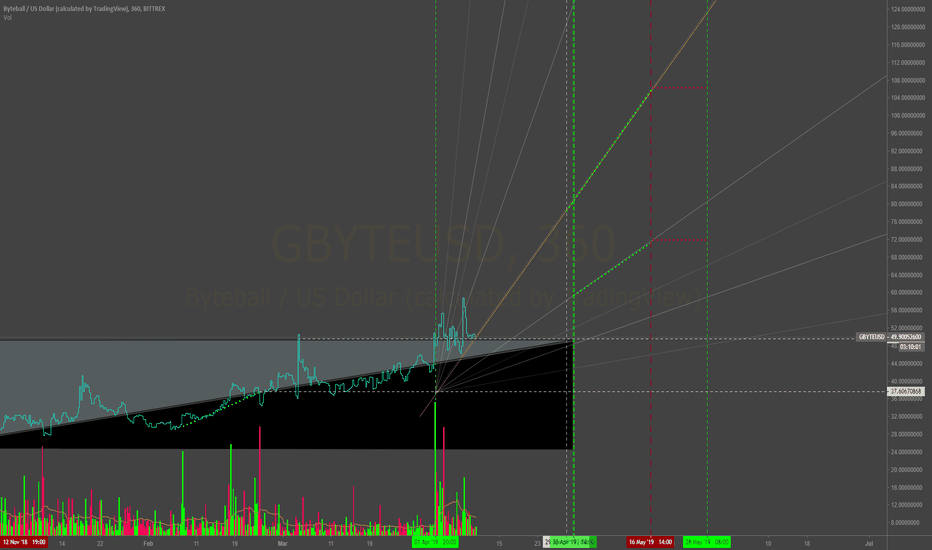
OByte Gbyte ByteBall Triangulation - Weighted Volume Method Gann, volume, and some magic. I might just be a little biased, really starting to like the fundamentals on this coin so take this with a Shill Pill.
$OBYTE $GBYTE
Looks like an accumulation bottom here. Pump on Jan 29 or beforeFrom a technical perspective, if this is the bottom, we should be seeing some significant price action in the near future.
At a glance, the breakout is confirmed, but does require additional money flow to generate more interest and FOMO effect as this thing will shoot RAPIDLY.
With only 1 million supply, i bet the liquidity is weak here. So the upside swing can be quite dramatic here.
I am certain, that somebody is preparing to pump this coning any time now. Any favorable event will push the price in double digits.
Don;t invent here anything if u are not willing to loose at least 10% of your investment, as this coin, can and will get volatile.
Good luck everyone ;)
**LEGENDS**
BLUE = Bear/Resistance
Yellow = Bull/ Support
~Explore the chart for possible scenarios of price actions - use zoom and scroll for better view.~
/*This information is not a recommendation to buy or sell. It is to be used for educational purposes only.*/
If you want your coin to be analyzed, JUST ask.
If you got a question, ASK away!
And please keep those Stop losses in place!
Fractal dates are moments of interest, where price and time collide to create oscillation - vertical lines!
Thank you,
Ajion
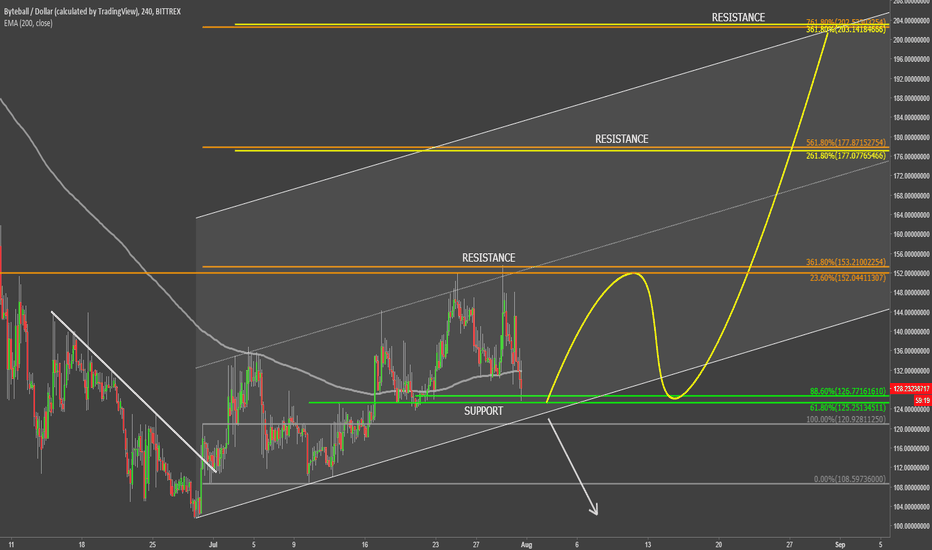
ByteBall at the Support - Uptrend Might ContinueAt the end of June Byteball has tested the low at $100, which is a strong psychological support. After bounce, price went up and broke above the downtrend trendline, corrected down, and went up again, this time breaking above the 200 Moving Average.
GBYTE/USD then bounced off strong resistance area at $150 and went down sharply. Currently it is trading at the $125 support, which could be the starting point for the uptrend continuation. It is worth mentioning that the 200 Moving Average is also acting as the support, as price still failed to break below with confidence.
If GBYTE stays above the $125 level, the uptrend is likely to continue, towards one of the Fibonacci resistance levels. First is at $177, and second is at $200 area, which is the next strong psychological resistance.
All-in-all, trend is bullish, but if the current support is broken, Byteball might once again move down towards the $100 area.
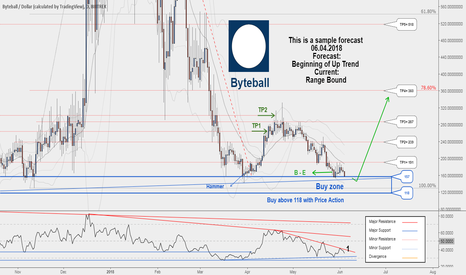
There is possibility for the beginning of uptrend in GBYTEUSD Technical analysis:
. BYTEBALL/DOLLAR is in a range bound and the beginning of uptrend is expected.
. The price is below the 21-Day WEMA which acts as a dynamic resistance.
. The RSI is at 43.
Trading suggestion:
. There is a possibility of temporary retracement to suggested support zone (114.00 to 95.00). if so, traders can set orders based on Price Action and expect to reach short-term targets.
Beginning of entry zone (114.00)
Ending of entry zone (95.00)
Entry signal:
Signal to enter the market occurs when the price comes to "Buy zone" then forms one of the reversal patterns, whether "Bullish Engulfing" , "Hammer" or "Valley" in other words,
NO entry signal when the price comes to the zone BUT after any of reversal patterns is formed in the zone.
To learn more about "Entry signal" and the special version of our "Price Action" strategy FOLLOW our lessons:
Take Profits:
TP1= @ 137
TP2= @ 157
TP3= @ 191
TP4= @ 239
TP5= @ 287
TP6= @ 360
TP7= @ 518
TP8= @ 643
TP9= @ 777
TP10= @ 895
TP11= @ 1210
TP12= Free
A trading opportunity to buy in Byteball is near...Technical analysis:
. BYTEBALL/DOLLAR is in a range bound and Beginning of uptrend is expected.
. The price is below the 21-Day WEMA which acts as a dynamic resistance.
. The RSI is at 36.
. While the RSI downtrend #1 is not broken, bearish wave in price would continue.
Trading suggestion:
. The price is in a range bound, but we forecast the uptrend would begin.
. There is a possibility of temporary retracement to suggested support zone (157 to 118). if so, traders can set orders based on Price Action and expect to reach short-term targets.
Beginning of entry zone (157)
Ending of entry zone (118)
Entry signal:
Signal to enter the market occurs when the price comes to "Buy zone" then forms one of the reversal patterns, whether "Bullish Engulfing" , "Hammer" or "Valley" , in other words,
NO entry signal when the price comes to the zone BUT after any of reversal patterns is formed in the zone.
To learn more about "Entry signal" and special version of our "Price Action" strategy FOLLOW our lessons:
Take Profits:
TP1= @ 191
TP2= @ 239
TP3= @ 287
TP4= @ 360
TP5= @ 518
TP6= @ 643
TP7= @ 777
TP8= @ 895
TP9= @ 955
TP10= @ 1210
TP11= Free
A trading opportunity to buy in Byteball is near...Technical analysis:
. BYTEBALL/DOLLAR is in a range bound and Beginning of uptrend is expected.
. The price is below the 21-Day WEMA which acts as a dynamic resistance.
. The RSI is at 35.
. While the RSI downtrend #1 is not broken, bearish wave in price would continue.
Trading suggestion:
. The price is in a range bound, but we forecast the uptrend would begin.
. There is a possibility of temporary retracement to suggested support zone (157 to 118). if so, traders can set orders based on Price Action and expect to reach short-term targets.
Beginning of entry zone (157)
Ending of entry zone (118)
Entry signal:
Signal to enter the market occurs when the price comes to "Buy zone" then forms one of the reversal patterns, whether "Bullish Engulfing" , "Hammer" or "Valley" , in other words,
NO entry signal when the price comes to the zone BUT after any of reversal patterns is formed in the zone.
To learn more about "Entry signal" and special version of our "Price Action" strategy FOLLOW our lessons:
Take Profits:
TP1= @ 191
TP2= @ 239
TP3= @ 287
TP4= @ 360
TP5= @ 518
TP6= @ 643
TP7= @ 777
TP8= @ 895
TP9= @ 955
TP10= @ 1210
TP11= Free
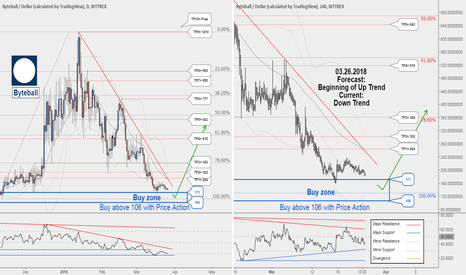
Byteball , The new Buy Zone & TPs for GBYTEUSD . Don't miss it.Technical analysis:
BYTEBALL/DOLLAR is in a down trend and Beginning of up trend is expected.
The price is below the 21-Day WEMA which acts as a dynamic resistance.
The RSI is at 30.
Trading suggestion:
*The price is in a down trend, but we forecast the uptrend would begin.
*There is possibility of temporary retracement to suggested support zone (171 to 106), if so , traders can set orders based on Price Action and expect to reach short-term targets.
Beginning of entry zone (171)
Ending of entry zone (106)
Entry signal:
Signal to enter the market occurs when the price comes to "Buy zone" then forms one of the reversal patterns, whether "Hammer" or "Trough" , in other words,
NO entry signal when the price comes to the zone BUT after any of reversal patterns is formed in the zone.
To learn more about "Entry signal" and special version of our "Price Action" strategy FOLLOW our lessons:
(We have started to prepare these lessons in TradingView. If you want us to continue, give us feedbacks!)
Take Profits:
TP1= @ 264
TP2= @ 302
TP3= @ 360
TP4= @ 518
TP5= @ 643
TP6= @ 777
TP7= @ 895
TP8= @ 955
TP9= @ 1210
TP10= Free
Byteball Road Back To $1000-Orange line is GBTE/BTC-
The Future is bright for byteball. Amazing project, if you are unfamiliar with it they use a DAG based "blockchain" you can catch up by reading the whitepaper first byteball.org or check out thier medium page for fast reads medium.com
,
Dyor.
Updates for March: medium.com
GBYTEUSD , The opportunity to buy is near. Keep your eye on it..Technical analysis:
BYTEBALL/DOLLAR is in a Range bound and Beginning of up trend is expected.
The price is below the 21-Day WEMA which acts as a dynamic resistance.
The RSI is at 40.
Trading suggestion:
There is no trend in the market and the price is in a range bound, but we forecast an uptrend would begin.
There is possibility of temporary retracement to suggested support zone (354 to 264), if so, traders can set orders based on Price Action and expect to reach short-term targets.
Beginning of entry zone (354)
Ending of entry zone (264)
Entry signal:
Signal to enter the market occurs when the price comes to "Buy zone" then forms one of the reversal patterns, whether "Hammer" or "Trough" , in other words,
NO entry signal when the price comes to the zone BUT after any of reversal patterns is formed in the zone.
To learn more about "Entry signal" and special version of our "Price Action" strategy FOLLOW our lessons:
(We have started to prepare these lessons in TradingView. If you want us to continue, give us feedbacks!)
Take Profits:
TP1= @ 518
TP2= @ 643
TP3= @ 777
TP4= @ 895
TP5= @ 963
TP6= @ 1210
TP7= Free
Byteball if it were to follow a 1:1 extension thru to wave 5Time will tell, but i am bullish on Byteball and the GBYTEUSD and GBYTEBTC pair both look bullish, infact the BTC pairing may have more insight to the growth potential Byteball may see in the next coming months.
a coin i own little of, and wished i had bought more when i did! But its also nice to have something on the UP when everything else has been struggling
ByteBall Bytes (GBYTE) Climbing Fast
• Resistance = .08276 SATS
• Support = .05966 SATS
• Next Target = .09528 SATS
• RSI = 54.87
As always, I recommend for every one to further expand their knowledge and do as much research as possible when investing. These are my own personal opinions and should be considered educational resources rather than financial advice. Good luck out there cryptonauts!
About ByteBall
Byteball enables trust where trust couldn’t exist before. When a contract is created on Byteball platform, it can be trusted to work exactly as agreed upon. Why? Because it is validated by multiple nodes on the decentralized network, which all follow the same immutable rules. The counterparty, even if it is a total stranger, has to behave honestly because only the rules have authority. Such a contract is called a smart contract. See below for examples of working smart contracts available today.
Byteball allows you to do something that traditional currencies can't: conditional payments. You set a condition when the payee receives the money. If the condition is not met, you get your money back.
Buy insurance from peers to get paid in case a negative event occurs. Sell insurance for profit. Insurance is just a simple smart contract that can be unlocked by the insured — if the event in question did occur, or by the insurer — otherwise. To insure against flight delay, find your counterpart in #p2p_insurance channel on our Slack, create a contract, and if your flight arrives late, chat with flight delays oracle to have it post the data about the delay, then unlock the contract.
ByteBall White Paper: byteball.org
GBYTE-BTC 148.58% Profit Potential, undervalued and low supply!This is my technical analysis for GBYTE, one of my favorites for practical reasons. As far as price goes, this is a sleeping giant. With a current market cap of ~$395.37mil USD, a circulating supply of 645,222 GBYTE, and a total supply of 1mil GBYTE. Considering supply and demand, this thing is terribly undervalued based on fundamentals alone. But beyond that, consider what GBYTE has to offer — byteball.org
I’ve used their P2P payments system myself via their messaging app and it’s seamless, the fastest money transfer I’ve ever seen.This is the way digital money is supposed to move - instantaneously and securely. You can convert your GBYTE into Blackbytes, which allow for anonymity within the GBYTE system. GBYTE has also released at least one ICOs on top of their platform (www.titan-coin.com), something to look out for in the future of crypto. Projects that provide a strong platform for newer projects to leap from will be the behemoths of this industry.
All that said, this daily chart and the global Fib doesn’t give us too much useful information. Because the crypto industry is so young, it is difficult to do reliable technical analysis on longer time frames on many of these assets. But for the sake of humoring you, I see that the long-term bearish sell-off has nearly completed and the market has found a renewed interest in GBYTE. The Ichimoku cloud (altered parameters, see youtu.be) has flipped to bullish right at the end of this bullish flag, which itself is an almost symmetrical triangle and I suspect it will break bullish. One reason being the very long-term downtrend has been broken and it has weathered the recent BTC/ market correction / FUD campaign quite well.
Notice how the 50 and 200 MA are about to have a golden cross exactly where one would expect this asset to reach its absolute maximum pinch-point before a decision in the market must be made, nearly forming a triangle pattern in their own right, and that aligns perfectly with the overall market doing about the same. Volume has decreased significantly and I see beautiful divergence in the RSI. A falling wedge has formed on the RSI, indicating in this case both a bullish reversal incoming, as well as current hidden bullish divergence (See more on divergence here: www.babypips.com). That’s quite a lot of bullish signals aligning for GBYTE, considering all of the fundamentals that I've laid out.
Now for some price targets, I know you guys love those ballpark randomly generated numbers ;) Potential profit targets visualized as blue horizontal lines.
My targets are astronomical primarily for the fundamentals listed above as the price-to-supply ratio is heavily suppressed imo, but also for this reason: Typically in crypto markets, projected moves from triangle breakouts and continuation patterns can be expected to be double that of their traditional counterparts. Second, when this overall market turns around I expect the value to explode, because those new to crypto are surprisingly more often than not more interested in alternatives to Bitcoin. I tried to find some more solid targets using Fibonacci here but for reasons mentioned before regarding the immaturity of the market, the global Fib and trend-based Fib extension tools can only be so reliable. That said, I adjusted the targets to align better with the global 38.2% retracement and historic congestion zones.
Target 1: 0.08340510
Target 2: 0.12245792
Target 3: 0.15557028
Byteball Rolling UpBytebal slowly but steadily rising and after each correction producing a new high. After reaching the recent high at $1188 price declined back to the 8/1 Gann Fan trendline, which was successfully rejected.
At this point, the uptrend is likely to continue and GBYTE/USD could test $1500-1600 area, where are two Fibonacci retracement levels applied to the last two corrective waves down. It should be kept in mind that the key support remains at $355 and only break and close above it could invalidate bullish outlook. At the same time, break above the upside target would confirm a further uptrend, while rejection should result in a short to medium term change in trend.
$GBYTE swing trade idea$GBYTE bull pennant closing in. IMO it's most likely at the "D" point of the horizontal triangle, so don't be surprised if you enter here if we see a minor dip back to the "E" point before the breakout. I'm always a fan of "E" for entry, though. Byteballs is also at less than 20% of it's all time high in terms of Bitcoin, so I see it having plenty of room to run after breaking out of the current accumulation zone.


