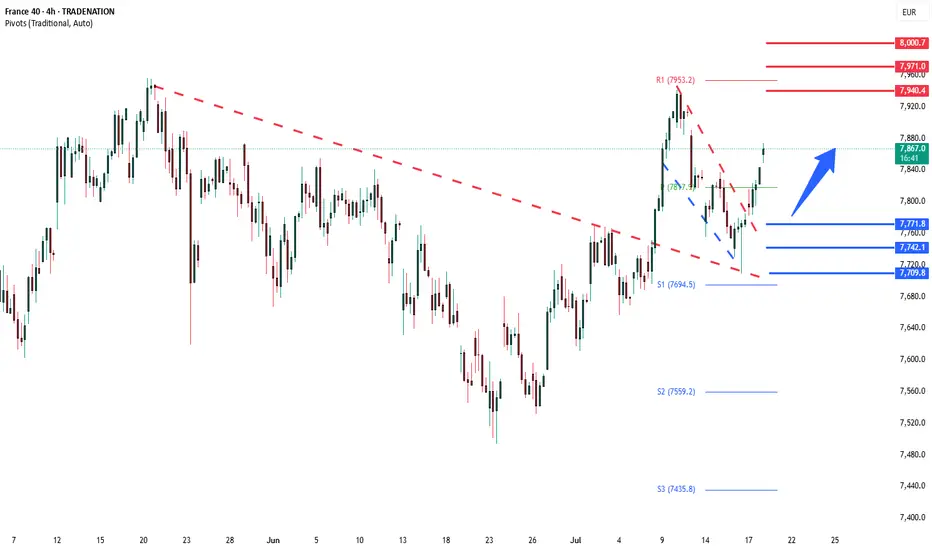
CAC40 Bullish breakout retest support at 7770The CAC40 price action sentiment appears Bullish, supported by the current rising trend. The recent intraday price action appears to be a consolidation breakout.
The key trading level is at the 7770 level, the previous consolidation price range. A corrective pullback from current levels and a bullish bounce back from the 7770 level could target the upside resistance at 7940, followed by the 7970 and 8000 levels over the longer timeframe.
Alternatively, a confirmed loss of the 7770 support and a daily close below that level would negate the bullish outlook, opening the way for a further retracement and a retest of the 7740 support level, followed by the 7700 levels.
This communication is for informational purposes only and should not be viewed as any form of recommendation as to a particular course of action or as investment advice. It is not intended as an offer or solicitation for the purchase or sale of any financial instrument or as an official confirmation of any transaction. Opinions, estimates and assumptions expressed herein are made as of the date of this communication and are subject to change without notice. This communication has been prepared based upon information, including market prices, data and other information, believed to be reliable; however, Trade Nation does not warrant its completeness or accuracy. All market prices and market data contained in or attached to this communication are indicative and subject to change without notice.
CAC 40 CFD
"FRA40/CAC40 HEIST! Bullish Loot Before Bear Trap – Act Fast!"💰 FRA40/CAC40 "FRANCE40" INDEX HEIST – THIEF TRADING STYLE MASTER PLAN 🏴☠️🚀
🔥 Steal the Market Like a Pro – Bullish Loot & Escape Before the Trap! 🔥
🤑 GREETINGS, FELLOW MONEY MAKERS & MARKET ROBBERS!
🌟 Hi! Hola! Ola! Bonjour! Hallo! Marhaba! 🌟
This is your VIP invite to the ultimate FRA40/CAC40 heist! Based on the 🔥Thief Trading Style🔥, we’re locking in a bullish raid before the bears set their trap. Time to swipe the loot & escape like a pro!
📜 THE HEIST BLUEPRINT – TECHNICAL & FUNDAMENTAL RAID PLAN
🎯 ENTRY POINT: "THE VAULT IS OPEN!"
📈 Long Entry: The market’s handing out free cash—swipe bullish positions at any price!
🔄 Pro Thief Move: Use buy limit orders within 15-30 min timeframe for pullback entries.
🎲 DCA/Layering Strategy: Deploy multiple limit orders to maximize loot & minimize risk.
🛑 STOP LOSS – SAFETY NET FOR THIEVES
SL at Nearest Swing Low (4H TF): 7650.00 (Adjust based on your risk, lot size & entry layers).
⚠️ Warning: Bears are lurking—don’t get caught in their trap!
🏆 TAKE PROFIT – ESCAPE BEFORE THE POLICE ARRIVE!
🎯 Primary Target: 8060.00 (or exit early if the market turns sketchy).
🚨 Danger Zone: Yellow MA Zone (Overbought, Reversal Risk, Bear Trap!)
📡 FUNDAMENTAL BACKUP – WHY THIS HEIST WILL WORK
💰 France40 is riding bullish momentum due to:
Strong Macro Data (Eurozone recovery signals)
Institutional Buying (COT Report Insights)
Geopolitical Calm (For Now… Stay Alert!)
Index-Specific Strength (Tech & Luxury Stocks Leading)
🔗 For full analysis (Fundamentals, COT, Intermarket Trends, Sentiment Score):
👉 Check the Liinkk 🔗! 👈
🚨 TRADING ALERT – NEWS & POSITION MANAGEMENT
📰 High-Impact News = Market Chaos! Protect Your Loot:
❌ Avoid new trades during major news drops.
🔐 Use Trailing Stops to lock profits & dodge sudden reversals.
💥 BOOST THE HEIST – SUPPORT THE MISSION!
🚀 Hit the "Boost" button to strengthen our robbery squad!
💰 More boosts = More profitable raids!
🎉 Let’s dominate the market daily with the Thief Trading Style!
🔐 DISCLAIMER (LEGAL SAFETY NET)
This is NOT financial advice—just a strategic raid plan. Trade at your own risk. Markets change fast; adapt or get caught!
🤑 Stay tuned for the next heist… The vaults won’t rob themselves! 🐱👤💨

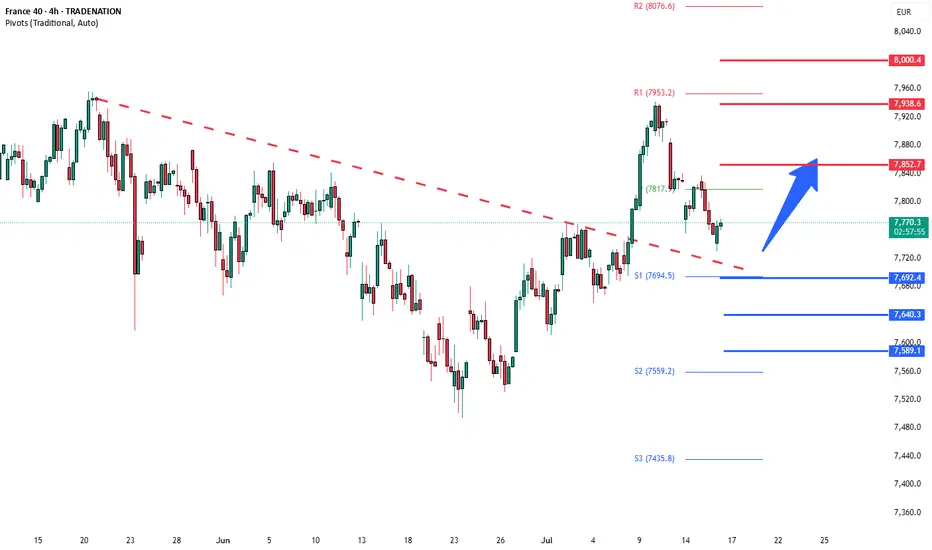
CAC40 Bullish breakout retest support at 7690The CAC40 remains in a bullish trend, with recent price action showing signs of a corrective pullback within the broader uptrend.
Support Zone: 7960 – a key level from previous consolidation. Price is currently testing or approaching this level.
A bullish rebound from 7690 would confirm ongoing upside momentum, with potential targets at:
7850 – initial resistance
7940 – psychological and structural level
8000 – extended resistance on the longer-term chart
Bearish Scenario:
A confirmed break and daily close below 7690 would weaken the bullish outlook and suggest deeper downside risk toward:
7640 – minor support
7590 – stronger support and potential demand zone
Outlook:
Bullish bias remains intact while the CAC40 holds above 7690. A sustained break below this level could shift momentum to the downside in the short term.
This communication is for informational purposes only and should not be viewed as any form of recommendation as to a particular course of action or as investment advice. It is not intended as an offer or solicitation for the purchase or sale of any financial instrument or as an official confirmation of any transaction. Opinions, estimates and assumptions expressed herein are made as of the date of this communication and are subject to change without notice. This communication has been prepared based upon information, including market prices, data and other information, believed to be reliable; however, Trade Nation does not warrant its completeness or accuracy. All market prices and market data contained in or attached to this communication are indicative and subject to change without notice.
FRANCE 40 Heist in Progress | Bullish Reversal Zone Spotted.💼 CAC40 Market Heist: Thief Trading Blueprint for Smart Traders (Swing/Day Trade Edition) 💼
🌍 Bonjour, Hola, Hallo, Marhaba, Ola, Hello! 🌍
Welcome to all Market Hustlers, Silent Snipers, and Profit Seekers! 🤑💸🎯
We're back with a precision-built Thief Trading Plan — this time targeting the FRANCE40 / CAC40 Index, using a combination of street-smart technicals and sharp macro insights.
🧠 Game Plan: The “Market Heist” Strategy
This strategy revolves around a Long Entry setup aiming for the high-risk Red Zone. Price is pushing into potential overbought territory, with signs of consolidation and trend exhaustion. That’s exactly where reversal opportunities and big moves live — right before the herd wakes up. 🐂💰
🔓 Entry Plan – "The Vault’s Open"
📍 Enter on bullish setups – recommended through:
Recent 15/30 min support levels or
Swing low/high based buy limit zones
💡 Pro Tip: Set alerts at those critical swing levels so you’re always one step ahead.
🛑 Stop Loss – "Stay Out of Jail"
🎯 Suggested SL: Near the recent 3H swing low (~7600 zone)
🧩 Adjust SL based on:
Risk tolerance
Lot size
Multiple entries
Trading strategy preference
🎯 Take Profit – "The Great Escape"
📌 Primary TP: 7830.00
🔐 Trailing SL advised to secure profits during the climb
🚨 If market shifts or trap signs emerge, exit early and protect the bag.
⚔️ Scalpers vs Swingers – Choose Your Crew
Scalpers: Only ride the long waves. Use momentum & micro breakouts.
Swing Traders: Follow the blueprint. This is your time to rob the trend cleanly. 🕶️📈
🧩 Market Insight & Fundamentals
This bullish momentum is backed by key drivers:
Economic releases
Institutional positioning (COT Reports)
Sentiment & intermarket flows
Geopolitical & macro factors
📌 Always update your narrative. Markets shift fast. Stay informed. Stay sharp.
⚠️ Important Trading Notice – News Risk & Management
🚫 Avoid fresh entries during high-impact news events
🔄 Use trailing SLs to lock gains
🧠 Be aware of volatility traps
❤️ Support the Strategy – Hit Boost & Join the Crew
If this strategy made sense to you, smash that Boost Button.
You're not just supporting a post — you're fueling a Thief Trader movement where smart, fearless traders take what’s theirs from the market. 🚀💰
🎉 Keep winning, stay alert, and I’ll see you in the next heist! 🧠💸🐱👤

CAC40 Bullish breakout supported at 7560Key Support and Resistance Levels
Resistance Level 1: 7850
Resistance Level 2: 7930
Resistance Level 3: 7995
Support Level 1: 7560
Support Level 2: 7490
Support Level 3: 7410
This communication is for informational purposes only and should not be viewed as any form of recommendation as to a particular course of action or as investment advice. It is not intended as an offer or solicitation for the purchase or sale of any financial instrument or as an official confirmation of any transaction. Opinions, estimates and assumptions expressed herein are made as of the date of this communication and are subject to change without notice. This communication has been prepared based upon information, including market prices, data and other information, believed to be reliable; however, Trade Nation does not warrant its completeness or accuracy. All market prices and market data contained in or attached to this communication are indicative and subject to change without notice.

CAC40 corrective pullback support at 7480Key Support and Resistance Levels
Resistance Level 1: 7850
Resistance Level 2: 7930
Resistance Level 3: 7995
Support Level 1: 7480
Support Level 2: 7400
Support Level 3: 7330
This communication is for informational purposes only and should not be viewed as any form of recommendation as to a particular course of action or as investment advice. It is not intended as an offer or solicitation for the purchase or sale of any financial instrument or as an official confirmation of any transaction. Opinions, estimates and assumptions expressed herein are made as of the date of this communication and are subject to change without notice. This communication has been prepared based upon information, including market prices, data and other information, believed to be reliable; however, Trade Nation does not warrant its completeness or accuracy. All market prices and market data contained in or attached to this communication are indicative and subject to change without notice.

CAC40 protracted coiling consolidation support at 7630Key Support and Resistance Levels
Resistance Level 1: 7788
Resistance Level 2: 7920
Resistance Level 3: 7995
Support Level 1: 7630
Support Level 2: 7578
Support Level 3: 7500
This communication is for informational purposes only and should not be viewed as any form of recommendation as to a particular course of action or as investment advice. It is not intended as an offer or solicitation for the purchase or sale of any financial instrument or as an official confirmation of any transaction. Opinions, estimates and assumptions expressed herein are made as of the date of this communication and are subject to change without notice. This communication has been prepared based upon information, including market prices, data and other information, believed to be reliable; however, Trade Nation does not warrant its completeness or accuracy. All market prices and market data contained in or attached to this communication are indicative and subject to change without notice.

CAC40 INTRADAY coiling pattern- energy buildupKey Support and Resistance Levels
Resistance Level 1: 7890
Resistance Level 2: 7970
Resistance Level 3: 8070
Support Level 1: 7700
Support Level 2: 7620
Support Level 3: 7510
This communication is for informational purposes only and should not be viewed as any form of recommendation as to a particular course of action or as investment advice. It is not intended as an offer or solicitation for the purchase or sale of any financial instrument or as an official confirmation of any transaction. Opinions, estimates and assumptions expressed herein are made as of the date of this communication and are subject to change without notice. This communication has been prepared based upon information, including market prices, data and other information, believed to be reliable; however, Trade Nation does not warrant its completeness or accuracy. All market prices and market data contained in or attached to this communication are indicative and subject to change without notice.

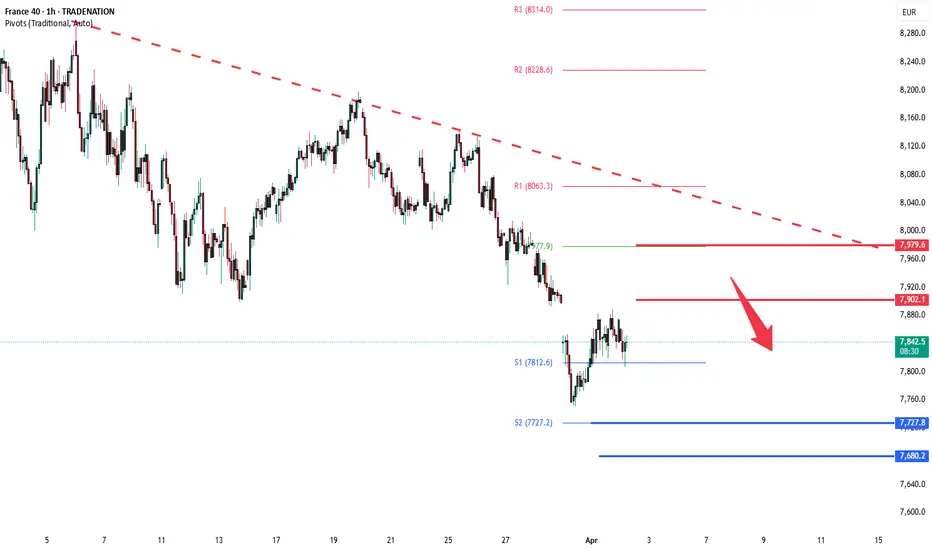
CAC40 INTRADAY rising wedge capped at 7705The CAC40 index shows a bearish sentiment, with the overall trend remaining negative. Recent price action suggests a short-term oversold rally that could face resistance near the 7705 level — a key previous consolidation area.
Key Resistance: 7705
A failure to break above this level could lead to renewed selling pressure.
Bearish Scenario:
If the price is rejected at 7705, downside targets include:
7500 (initial support)
7456
7330 (longer-term target)
Bullish Scenario:
A confirmed breakout and daily close above 7705 would invalidate the bearish outlook and open the door for a rally toward:
7830
7900
Conclusion:
The outlook remains bearish unless CAC40 can break and hold above 7705. Watch this level closely for directional clues.
This communication is for informational purposes only and should not be viewed as any form of recommendation as to a particular course of action or as investment advice. It is not intended as an offer or solicitation for the purchase or sale of any financial instrument or as an official confirmation of any transaction. Opinions, estimates and assumptions expressed herein are made as of the date of this communication and are subject to change without notice. This communication has been prepared based upon information, including market prices, data and other information, believed to be reliable; however, Trade Nation does not warrant its completeness or accuracy. All market prices and market data contained in or attached to this communication are indicative and subject to change without notice.

CAC40 IMPORTANT resistance retest at 7454
The CAC40 continues to exhibit bearish sentiment, aligning with the prevailing downward trend. Recent price action suggests that the index experienced an oversold rally, which was subsequently rejected near a key resistance zone — the previous intraday consolidation level around 7454.
This area now serves as a critical pivot point. A failure to break above 7454, followed by renewed selling pressure, would likely confirm a bearish reversal, with downside targets at:
7170 – Near-term support
7000 – Medium-term support
6828 – Long-term support level
However, if price breaks and closes firmly above 7454 on a daily basis, the bearish scenario would be invalidated. In that case, the DAX40 could extend gains toward:
7592 – Immediate resistance
7754 – Major upside target
Conclusion
The bias remains bearish below 7454, with rallies into that level offering potential short opportunities. A daily close above 7454, however, would shift sentiment and open the door for bullish continuation toward higher resistance levels.
This communication is for informational purposes only and should not be viewed as any form of recommendation as to a particular course of action or as investment advice. It is not intended as an offer or solicitation for the purchase or sale of any financial instrument or as an official confirmation of any transaction. Opinions, estimates and assumptions expressed herein are made as of the date of this communication and are subject to change without notice. This communication has been prepared based upon information, including market prices, data and other information, believed to be reliable; however, Trade Nation does not warrant its completeness or accuracy. All market prices and market data contained in or attached to this communication are indicative and subject to change without notice.

CAC40 INTRADAY oversold boumce back capped at 7186The CAC 40 continues to exhibit bearish sentiment, in line with the prevailing downtrend. Recent price action has confirmed a break below a key consolidation support zone, reinforcing the downside bias.
Key Technical Levels:
Resistance Zone: 7000 (short-term), 7186 (major resistance / former consolidation zone)
Support Levels: 6760 (initial target), 6630 (intermediate), 6474 (longer-term support)
Bearish Scenario:
The loss of support at 7186 has shifted the bias to the downside. A potential oversold rebound may occur, but unless price reclaims and holds above 7000 on a daily closing basis, rallies are likely to face selling pressure. A bearish rejection at 7186, if retested, would confirm the continuation of the downtrend toward the stated support levels.
Bullish Alternative:
A confirmed breakout above 7000, with a daily close above this level, would challenge the current bearish outlook. In such a case, the index may regain bullish momentum, opening the path for a retest of 7186, followed by 7290.
Conclusion:
The technical outlook for the CAC 40 remains bearish unless a decisive breakout above 7000 occurs. Traders should watch for rejection patterns near 7000–7186 for potential short entries, while a daily close above 7000 would be a key trigger for a trend reversal and a shift in sentiment.
This communication is for informational purposes only and should not be viewed as any form of recommendation as to a particular course of action or as investment advice. It is not intended as an offer or solicitation for the purchase or sale of any financial instrument or as an official confirmation of any transaction. Opinions, estimates and assumptions expressed herein are made as of the date of this communication and are subject to change without notice. This communication has been prepared based upon information, including market prices, data and other information, believed to be reliable; however, Trade Nation does not warrant its completeness or accuracy. All market prices and market data contained in or attached to this communication are indicative and subject to change without notice.

CAC40 capped by resistance at 7,900The CAC40 index is exhibiting bearish sentiment, aligning with the prevailing downtrend. The recent price action suggests an oversold bounce, which may be temporary before the downtrend resumes.
Key Level: 7,900
This level represents the previous intraday consolidation zone and serves as a crucial resistance point.
Bearish Scenario: If the index faces rejection at 7,900, it could resume its decline, targeting 7,728, followed by 7,680 and 7,552 as long-term support levels.
Bullish Scenario: A confirmed breakout above 7,900 with a daily close beyond this level would invalidate the bearish outlook, potentially leading to rallies toward 7,980 and 8,060.
Conclusion:
The CAC40 remains in a bearish trend unless a strong breakout above 7,900 confirms a shift in momentum. Traders should watch for rejection or confirmation at this key level to determine the next move.
This communication is for informational purposes only and should not be viewed as any form of recommendation as to a particular course of action or as investment advice. It is not intended as an offer or solicitation for the purchase or sale of any financial instrument or as an official confirmation of any transaction. Opinions, estimates and assumptions expressed herein are made as of the date of this communication and are subject to change without notice. This communication has been prepared based upon information, including market prices, data and other information, believed to be reliable; however, Trade Nation does not warrant its completeness or accuracy. All market prices and market data contained in or attached to this communication are indicative and subject to change without notice.
CAC40 INTRADAY Bullish sideways consolidation The CAC 40 Equity Index remains in a prevailing uptrend, with recent intraday price action indicating a corrective pullback toward a key support level.
Key Levels to Watch:
Support Levels: 7967 (critical level), 7893, 7778
Resistance Levels: 8160, 8270, 8344
Bullish Scenario:
A bullish bounce from the 7967 support level, previously a resistance zone, could trigger renewed buying momentum. If confirmed, the next upside targets are set at 8160, 8270, and 8344 over a longer timeframe.
Bearish Scenario:
A daily close below 7967 would weaken the bullish outlook, potentially leading to a further retracement toward 7893, with an extended decline targeting 7778.
Conclusion:
The overall market sentiment remains bullish, but the 7967 level is a pivotal support zone. A successful retest and rebound from this level could drive the next leg higher, whereas a confirmed breakdown would shift the outlook to bearish, favoring deeper corrections. Traders should monitor price action closely around these levels for confirmation.
This communication is for informational purposes only and should not be viewed as any form of recommendation as to a particular course of action or as investment advice. It is not intended as an offer or solicitation for the purchase or sale of any financial instrument or as an official confirmation of any transaction. Opinions, estimates and assumptions expressed herein are made as of the date of this communication and are subject to change without notice. This communication has been prepared based upon information, including market prices, data and other information, believed to be reliable; however, Trade Nation does not warrant its completeness or accuracy. All market prices and market data contained in or attached to this communication are indicative and subject to change without notice.

French Diamond ready to break up and glimmer to upsideFrance is another European market that seems to be outperforming many of the large markets in 2025.
There are strong catalysts apart from foreign investments to Europe compared to the US.
Including:
1. 🛡️ France boosts defense spending
€1.7B added to support the military.
2. 💰 Strong French earnings
Big companies like L'Oréal beat forecasts.
3. 💶 Euro stays steady
Helps exports and investor confidence.
4. 📉 Lower energy costs help
Trade balance improves, lifting the CAC.
And technically, there is a Strong Diamond formation in the making.
We are approaching the second half of the diamond to complete. And once price breaks above it could signal a strong rally going forward.
French Diamond
Price> 20 and 200
Target 8,848
Disclosure: I am part of Trade Nation's Influencer program and receive a monthly fee for using their TradingView charts in my analysis.

CAC40 The Week Ahead 24th March '25CAC40 bullish & overbought, the key trading level is at 7900
This communication is for informational purposes only and should not be viewed as any form of recommendation as to a particular course of action or as investment advice. It is not intended as an offer or solicitation for the purchase or sale of any financial instrument or as an official confirmation of any transaction. Opinions, estimates and assumptions expressed herein are made as of the date of this communication and are subject to change without notice. This communication has been prepared based upon information, including market prices, data and other information, believed to be reliable; however, Trade Nation does not warrant its completeness or accuracy. All market prices and market data contained in or attached to this communication are indicative and subject to change without notice.

CAC40 INTRADAY Bullish Breakout supported at 8050. The CAC40 equity index remains in a bullish technical structure, underpinned by the prevailing uptrend. Recent intraday price action has shown a breakout above a sideways consolidation pattern, suggesting renewed bullish momentum towards the previous resistance area.
Key Levels:
Support: The critical support level is at 8050, which corresponds to the previous consolidation price range. A corrective pullback to this level, followed by a bullish bounce, could reinforce the uptrend.
Resistance: On the upside, the next resistance levels are positioned at 8190, 8300, and 8400, representing potential profit targets over a longer timeframe.
Bearish Scenario: A decisive break below the 8050 support level and a daily close beneath this mark would invalidate the bullish outlook. Such a move could initiate a deeper retracement, targeting the 7900 support level, followed by 7800 if selling pressure intensifies.
Conclusion: The prevailing sentiment remains bullish as long as the 8050 support holds. Traders should monitor any corrective moves toward this level for potential buying opportunities. A confirmed loss of 8050 would signal caution, as it may trigger further downside pressure.
This communication is for informational purposes only and should not be viewed as any form of recommendation as to a particular course of action or as investment advice. It is not intended as an offer or solicitation for the purchase or sale of any financial instrument or as an official confirmation of any transaction. Opinions, estimates and assumptions expressed herein are made as of the date of this communication and are subject to change without notice. This communication has been prepared based upon information, including market prices, data and other information, believed to be reliable; however, Trade Nation does not warrant its completeness or accuracy. All market prices and market data contained in or attached to this communication are indicative and subject to change without notice.

CAC40 (FR40) The Week Ahead 17th March '25CAC40 INTRADAY bullish & oversold, key trading level is at 7917
This communication is for informational purposes only and should not be viewed as any form of recommendation as to a particular course of action or as investment advice. It is not intended as an offer or solicitation for the purchase or sale of any financial instrument or as an official confirmation of any transaction. Opinions, estimates and assumptions expressed herein are made as of the date of this communication and are subject to change without notice. This communication has been prepared based upon information, including market prices, data and other information, believed to be reliable; however, Trade Nation does not warrant its completeness or accuracy. All market prices and market data contained in or attached to this communication are indicative and subject to change without notice.

FRA40/CAC40 "France40" Indices Market Bearish Heist Plan🌟Hi! Hola! Ola! Bonjour! Hallo! Marhaba!🌟
Dear Money Makers & Thieves, 🤑 💰🐱👤🚀
Based on 🔥Thief Trading style technical and fundamental analysis🔥, here is our master plan to heist the FRA40/CAC40 "France40" Indices Market. Please adhere to the strategy I've outlined in the chart, which emphasizes short entry. Our aim is the high-risk Green Zone. Risky level, oversold market, consolidation, trend reversal, trap at the level where traders and bullish thieves are getting stronger. 🏆💸Book Profits Be wealthy and safe trade.💪🏆🎉
Entry 📈 : "The heist is on! Wait for the breakout (8040) then make your move - Bearish profits await!" however I advise placing Sell Stop Orders below the breakout MA or Place Sell limit orders within a 15 or 30 minute timeframe. Entry from the most recent or closest low or high level should be in retest.
📌I strongly advise you to set an alert on your chart so you can see when the breakout entry occurs.
Stop Loss 🛑: Thief SL placed at 8160 (swing Trade Basis) Using the 4H period, the recent / swing high or low level.
SL is based on your risk of the trade, lot size and how many multiple orders you have to take.
Target 🎯:
Primary Target - 7900 (or) Escape Before the Target
Secondary Target - 7680 (or) Escape Before the Target
🧲Scalpers, take note 👀 : only scalp on the Short side. If you have a lot of money, you can go straight away; if not, you can join swing traders and carry out the robbery plan. Use trailing SL to safeguard your money 💰.
📰🗞️Fundamental, Macro, COT Report, Sentimental Outlook, Positioning Analysis:
FRA40/CAC40 "France40" Indices Market is currently experiencing a Bearish trend., driven by several key factors.
✴✴Fundamental Analysis✴✴
Economic Indicators: France's GDP growth rate is expected to continue its upward trend, with the France 40 index increasing by 10.34% since the beginning of 2025.
Earnings Reports: The CAC 40 companies' earnings reports have been showing signs of growth, with some companies experiencing increased revenues and profits.
Dividend Yield: The CAC 40 dividend yield is around 3.5%, which is relatively attractive compared to other major European indices.
✴✴Macro Economics✴✴
Monetary Policy: The European Central Bank (ECB) has maintained its hawkish stance, keeping interest rates at 4.25% to combat inflation (latest ECB meeting minutes).
Fiscal Policy: The French government has announced plans to reduce its budget deficit, aiming for a 3.5% deficit-to-GDP ratio by the end of 2025 (latest budget proposal).
Global Trade: The ongoing trade tensions between the US and China have eased, with both countries signing a new trade agreement, which is expected to boost French exports (latest trade data).
✴✴COT Data ✴✴
Speculators (Non-Commercials): The current COT report shows that speculators are holding 50,219 long positions and 25,011 short positions.
Hedgers (Commercials): Hedgers are holding 20,015 long positions and 40,011 short positions.
Asset Managers: Asset managers are holding 30,015 long positions and 15,019 short positions.
✴✴Global Market Analysis✴✴
Trend: The France 40 index is experiencing a bullish trend, with a 2.1% increase in the last week and a 5.6% increase in the last month.
Support and Resistance: Key support levels are at 8000 and 7950, while resistance levels are at 8250 and 8300.
✴✴Positioning✴✴
Long/Short Ratio: The long/short ratio for the France 40 (CAC 40) index is 2.05, indicating a slightly bullish sentiment.
Open Interest: The open interest for the France 40 (CAC 40) index is approximately €12.5 billion.
✴✴Next Trend Move✴✴
Bullish Prediction: Some analysts suggest a potential bullish move, targeting 8300 and 8400, due to the ongoing economic growth and attractive valuations.
Bearish Prediction: Others predict a potential bearish move, targeting 7900 and 7800, due to the ongoing trade tensions and potential economic slowdown.
Long-Term Bearish Target: A potential long-term bearish target is 7200, due to the ongoing global economic uncertainty and potential recession risks.
✴✴Future Prediction✴✴
Short-Term:
Bullish: 8200-8300
Bearish: 7900-7800
Medium-Term:
Bullish: 8500-8600
Bearish: 7500-7400
Long-Term:
Bullish: 9000-9200
Bearish: 6800-6600
✴✴Overall Summary Outlook✴✴
Bullish or Bearish: The overall outlook for the France 40 (CAC 40) index is neutral, with a mix of bullish and bearish predictions.
Real-Time Market Feed: As of the current time, the France 40 (CAC 40) index is trading at 8100, with a 0.5% increase in the last 24 hours.
⚠️Trading Alert : News Releases and Position Management 📰 🗞️ 🚫🚏
As a reminder, news releases can have a significant impact on market prices and volatility. To minimize potential losses and protect your running positions,
we recommend the following:
Avoid taking new trades during news releases
Use trailing stop-loss orders to protect your running positions and lock in profits
💖Supporting our robbery plan will enable us to effortlessly make and steal money 💰💵 Tell your friends, Colleagues and family to follow, like, and share. Boost the strength of our robbery team. Every day in this market make money with ease by using the Thief Trading Style.🏆💪🤝❤️🎉🚀
I'll see you soon with another heist plan, so stay tuned 🤑🐱👤🤗🤩

Can France’s Economy Defy Gravity?The CAC 40, France’s flagship stock index, showcases the nation’s economic strength, driven by global giants like LVMH and TotalEnergies. With their vast international presence, these multinational corporations provide the index with notable resilience, allowing it to endure domestic challenges. However, this apparent stability masks a deeper, more intricate reality. Beneath the surface, the French economy grapples with significant structural issues that could undermine its long-term success, making the CAC 40’s performance both a symbol of hope and a point of vulnerability.
France confronts multiple internal pressures that threaten its economic stability. An aging population, with a median age of 40—among the highest in developed nations—shrinks the workforce, increasing the burden of healthcare and pension costs. Public debt, projected to hit 112% of GDP by 2027, restricts fiscal flexibility, while political instability, such as a recent government collapse, hampers essential reforms. Compounding these issues is the challenge of immigration. France’s immigrant population, particularly from Africa and the Middle East, faces difficulties integrating into a rigid labor market shaped by strict regulations and strong unions. This struggle limits the nation’s ability to leverage immigrant labor to offset workforce shortages while straining social unity, adding further complexity to France’s economic challenges.
Looking forward, France’s economic future hangs in the balance. The CAC 40’s resilience offers a buffer, but lasting prosperity depends on tackling these entrenched problems—demographic decline, fiscal constraints, political gridlock, and the effective integration of immigrants. To maintain its global standing, France must pursue bold reforms and innovative solutions, a daunting task requiring determination and foresight. As the nation strives to reconcile its rich traditions with the demands of a modern economy, a critical question looms: can France overcome these obstacles to secure a thriving future? The outcome will resonate well beyond its borders, offering lessons for a watching world.

CAC (F40) INRADAY continuation pattern in play supported at 7900The CAC 40 (FR40) equity index price action remains bullish, supported by the prevailing longer-term uptrend. Recent intraday movements indicate sideways consolidation near the breakout level, which previously acted as resistance and has now become a new support zone.
Key Levels and Price Action
The critical trading level to watch is the 7900 level, representing the previous consolidation price range. A corrective pullback to this level, followed by a bullish bounce, could signal a continuation of the upward trend. In this scenario, the index may target the next upside resistance levels at 8160, 8300, and 8400 over the longer timeframe.
However, if the 7900 support level is decisively broken, confirmed by a daily close below this level, the bullish outlook would be invalidated. This breakdown could lead to a deeper retracement, with potential downside targets at the 7866 support level, followed by 7800 and 7733.
Conclusion
The overall sentiment remains bullish as long as the 7900 support level holds. A successful bounce from this zone could pave the way for continued upside momentum. Conversely, a confirmed break below 7900 would shift the outlook to bearish, suggesting a more significant corrective move. Traders should closely monitor daily closes around the critical support to gauge sentiment shifts.
This communication is for informational purposes only and should not be viewed as any form of recommendation as to a particular course of action or as investment advice. It is not intended as an offer or solicitation for the purchase or sale of any financial instrument or as an official confirmation of any transaction. Opinions, estimates and assumptions expressed herein are made as of the date of this communication and are subject to change without notice. This communication has been prepared based upon information, including market prices, data and other information, believed to be reliable; however, Trade Nation does not warrant its completeness or accuracy. All market prices and market data contained in or attached to this communication are indicative and subject to change without notice.

CAC40 (Fr40) The Week Ahead 10th March '25Sentiment: Bullish INTRADAY, Price action consolidates in a tight trading range.
Resistance: Key Resistance is at 8265, followed by 8309 and 8354 - 8400 levels.
Support: Key support is at 8099 followed by 7983 and 7928.
This communication is for informational purposes only and should not be viewed as any form of recommendation as to a particular course of action or as investment advice. It is not intended as an offer or solicitation for the purchase or sale of any financial instrument or as an official confirmation of any transaction. Opinions, estimates and assumptions expressed herein are made as of the date of this communication and are subject to change without notice. This communication has been prepared based upon information, including market prices, data and other information, believed to be reliable; however, Trade Nation does not warrant its completeness or accuracy. All market prices and market data contained in or attached to this communication are indicative and subject to change without notice.

CAC40 rejecting ATHThe CAC 40 is rejecting its all-time high at 8,273. If this is confirmed, a correction can be expected, with the first target being the gap closure (blue rectangle) and 8,014.

CAC40 (FR40) Index outlookBullish Scenario:
The CAC (F40) index maintains a bullish outlook, supported by the prevailing longer-term uptrend. The recent intraday price action indicates a bullish breakout above a period of sideways consolidation. The key level to watch is 8100, which marks the breakout zone and aligns with the rising support trendline. A corrective pullback that finds support at 8100, followed by a bullish rebound, could trigger further upside movement towards 8265, with extended targets at 8308 and 8354 over a longer timeframe.
Bearish Scenario:
A confirmed breakdown below the 8100 level, particularly with a daily close beneath this support, would negate the bullish outlook. This would expose the index to a deeper retracement, with immediate support at 8017, followed by 7983 and 7928, indicating a potential shift towards a corrective phase.
Conclusion:
The broader trend remains bullish, but 8100 is a pivotal level. Holding above this zone reinforces upside potential, while a decisive break below it could lead to increased selling pressure. Traders should monitor price action around this key level to confirm the next directional move.
This communication is for informational purposes only and should not be viewed as any form of recommendation as to a particular course of action or as investment advice. It is not intended as an offer or solicitation for the purchase or sale of any financial instrument or as an official confirmation of any transaction. Opinions, estimates and assumptions expressed herein are made as of the date of this communication and are subject to change without notice. This communication has been prepared based upon information, including market prices, data and other information, believed to be reliable; however, Trade Nation does not warrant its completeness or accuracy. All market prices and market data contained in or attached to this communication are indicative and subject to change without notice.
