Cad-jpy


CAD/JPY Quick 20 Pip Buy Idea 15mFollowing the bullish bias CAD/JPY looks ready to push back up to todays high of 88.200 bank level.
Once it closes above 88.100 expect it to continue upwards.
We also have a 4h wick fill potential right to that zone.

CADJPY - SWING - 29. MAR. 2021Welcome to our weekly trade setup ( CADJPY )!
-
1 HOUR
Bearish break and closure.
4 HOUR
Overall bearish market structure!
DAILY
Expecting more downside pressure.
-
FOREX SWING
SELL CADJPY
ENTRY LEVEL @ 87.020
SL @ 87.330
TP @ 86.220
Max Risk: 0.5% - 1%!
(Remember to add a few pips to all levels - different Brokers!)
Leave us a comment or like to keep our content for free and alive.
Have a great week everyone!
ALAN

COT CURRENCY REPORTThis report reflects the COTdata updated until 23 Mar 2021.
Overall:
With the CFTC data updated until 23 March the JPY showed the biggest decrease of (-14K) and the EUR showing the biggest increase of (+3K).
AUD, NZD & CAD:
After sizable moves lower with the recent risk off flushes, all three high betas remain bullish in the med-term outlook, and with relatively small net long positions, there is still more room to run. In the week ahead it's going to be very quiet on the data front, but we will have a few events to watch for WTI which could have impact on the CAD such as the upcoming JMMC meeting and more
developments with the Suez Canal.
Also keep in mind this week we will have month-end and quarter-end, we also have a shortened week due to Good Friday, which means liquidity is likely going to be unfavourable. Thus, even though med-term biases remain intact do watch out for erratic price moves without any real catalyst.
JPY & CHF & USD:
Another big increase in net-short positions for the JPY. The speed of the move in the JPY has been very excessive in the short-term, with the 1-year z-score printing a 4.5 with this past week's data.
That is a very big deviation from the norm, which means we do want to be a bit careful with the JPY from a positioning point of view. Even though the JPY has been at the mercy of moves in US10Y, a sudden move higher from some profit taking is a risk to keep in mind.
The Dollar was the star performer last week, pushing higher across the board even while US10Y was pushing lower for the majority of the week. The short-term drivers that has recently affected the Dollar is still very much in play such as yield differentials, better relative growth & inflation dynamics as well as the faster policy normalization expectations for the FED.
However, again from positioning, the move in the USD does look stretched in the short-term so keep that in mind going into the new week.
GBP:
The bias for Sterling remains titled to the upside, especially versus the EUR, where EURGBP managed to close below the important support at 0.8550.
This week is going to be very light on the data front, so focus will remain on the overall driver for EURGBP such as vaccine roll out (UK well ahead), growth expectations (UK well ahead), monetary policy (UK far less dovish), fiscal policy (EU still waiting for ratification), new virus cases (rising much faster in EU).
EUR:
The reasons to expect downside for the EUR has been on the rise recently. Whether we consider the vaccine roll out, or recent virus numbers, or lockdown restrictions, or relative growth dynamics, or policy normalization expectations, all the above point to further downside for the EUR versus the USD and GBP, as well as the high betas.
Despite shedding a lot of net long positioning in the past two months, the EUR remains the largest net long position among the majors, which means there is quite a bit of room to run to the downside if the above concerns continue to pressure the single currency.
For the week ahead, the focus will be on the incoming US ISM Manufacturing PMI as well as the March NFP report (which is expected to show a sizable jump on the headline). If we see these two data points print significantly higher than expected, it will mean more downside for the EURUSD, which should also be supportive for further EURGBP downside as well.

CAD slides with oil as WTI slips back below $58 per barrelDuring today’s European trading session, the risk tone soured with EMEA indices negative across the board and measures of volatility elevated; although, safe haven currencies remained broadly weaker.
Leading European indices to the downside is the IBEX 35 at -1.13%, followed by the FTSE 100 at -0.94%, the Euro Stoxx 50 at -0.65% and the DAX and CAC 40 at -0.62% and -0.47%, respectively.
In the FX complex, despite the moderation from the risk on tone seen in the Asia-Pacific session, JPY is still the session’s laggard. However, with that said, against most counterparts, the safe haven has pulled off its worst levels.
Another notable underperformer on the session is CAD, with Reuters noting, “Canadian dollar holds near two week low as oil slides.” Indeed, WTI has relinquished the $60.00, $59.00 and $58.00 per barrel levels.
In contrast, GBP is currently leading the FX majors to the upside; however, analysts continue to voice concerns over tensions between the UK and EU which threaten the UK’s vaccination rollout.
Looking ahead, expect central bank rhetoric to remain a key theme of the day with numerous Fed speakers on the docket. Of course, expect developments in WTI to remain key for CAD and the overall risk tone to remain key for the antipodeans and safe havens.

Danske Bank Projections For Next 12 MonthsForeign exchange analysts at Danske Bank expect the US Dollar to gain ground during the year ahead, primarily under the influence of a very strong US economic recovery.
After little change on a 1-month view, the Euro-to-Dollar exchange rate ( EUR/USD ) is expected to weaken 0.7% to 1.1800 on a 3-month view. The losses are expected to continue on a 6 and 12-month view with levels of 1.1700 and 1.1500 which represent decline of 1.6% and 3.24% respectively from current levels.
The bank also expects steady USD/JPY gains during the forecast period with a sharp upgrade from February’s forecasts.
A gain of 1.3% to 110.00 is forecast on a 6-month view with a further advance to 112 on a 12-month view, a gain of 3.2% from the current spot level.
Euro Pound Tipped to Retreat Further
Sterling is forecast to maintain a solid tone with overall moves influenced strongly by changes in the EUR/USD rate.
In this context, the Pound US Dollar ( GBP/USD ) exchange rate is projected to reverse the most recent losses and secure a 1.4% advance to 1. 40 on a 1-month view.
Thereafter, the GBP/USD is projected at 1.3900 throughout the 3, 6 and 12-month periods which would represent a 0.7% advance from the current spot rate.
With the single currency generally vulnerable, the Euro Pound rate is forecast to post further losses.
EUR/GBP is forecast at 0.85 on a 1 and 3-month view, a decline of 1.3% from the current spot level.
A further retreat to 0.84 is forecast on a 6-month view with a net loss to 0.83 on a 12-month view, a loss of 3.7% from the current spot level.
Commodity currencies are forecast to decline amid a strong US dollar .
After a slight rebound on a 1-month view, the Australian Dollar-to-US Dollar ( AUD/USD ) exchange rate is forecast to decline 1.0% to 0.7600 on a 3-month view.
A further retreat to 0.73 is forecast on a 12-month view, a decline of 4.9% from the current spot value.
A similar pattern is projected for the New Zealand dollar with losses limited by the slide in spot prices recorded today.
The New Zealand Dollar-to-US Dollar ( NZD/USD ) exchange rate is forecast to recover 0.9% to 0.710 on a 1-month view.
After slight losses on a 3-month view, Danske forecasts a decline to 0.69 on a 6-month view and 0.68 on a 12-month view which equates to losses of 1.9% and 3.3% respectively from current spot levels.
The Norwegian krone and Swedish krona not expected to sustain initial gains.
The Euro-to-Krone rate is forecast to weaken to 10.00 on a 1-month view, a decline of 1.9%. Thereafter, the rate is expected to recover with no net change from spot levels on a 6-month view and a gain of 1.1% to 10.30 on a 12-month view.
The euro is forecast to decline 0.9% to 10.10 on a 1 and 3-month view.
The pair is then forecast to strengthen to 10.2 on a 6-month view and 10.4 on a 12-month view, a gain of 0.1% and 2.1% respectively from current spot levels.

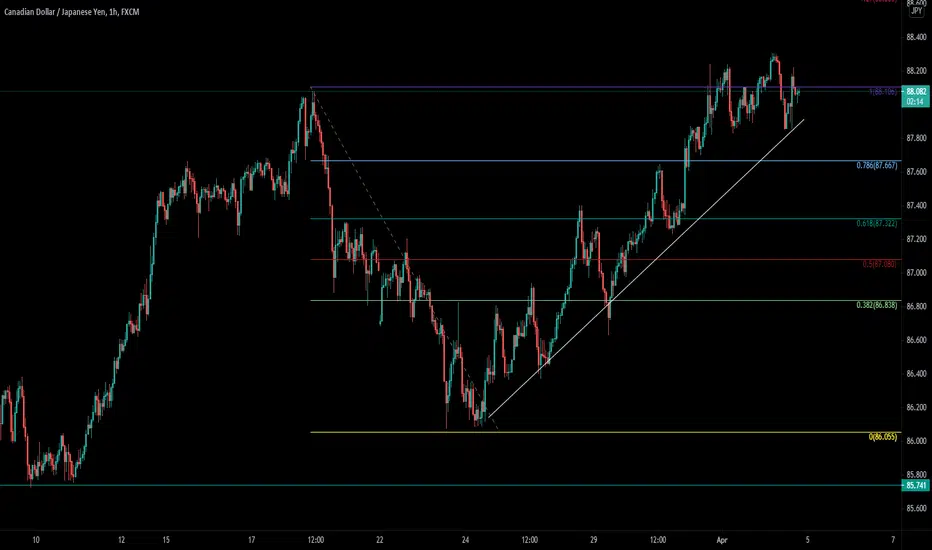
CADJPYkeeping it simple, price is generally on an upward trend. On the 4hr chart above we see that trend line broken, price now dropping to retrace to a demand area confluenced with the 0.5 fib level, before looking to go long there
Let me know if you agree


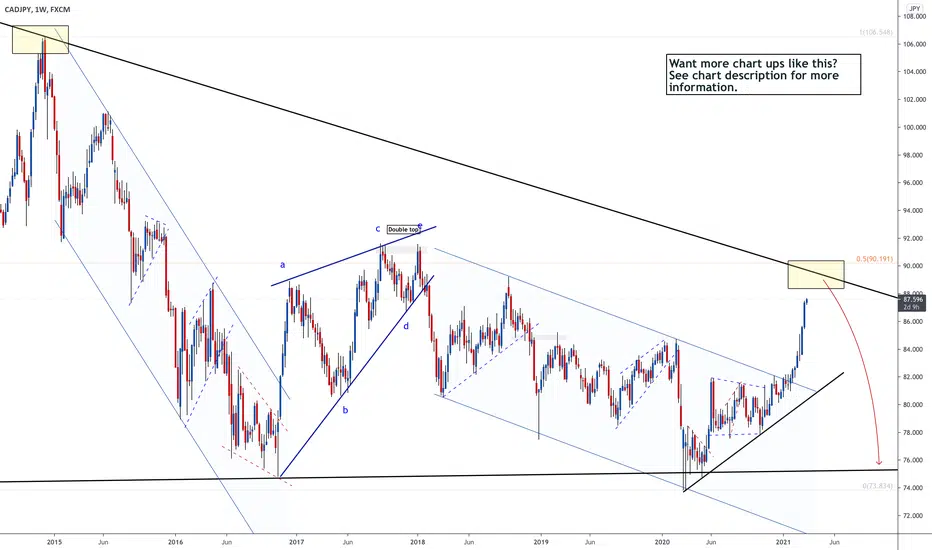
CADJPY - Beautiful SHORT Approaching - 1500pip!CADJPY has been adhering to the rules of the different patterns you see in this chart. We are looking for JPY strength soon and CAD weakness which could make this thing drop from the sky. I'm really liking the look of this and will have a clean short set up soon.
See links below as to why we're expecting to short this.
Goodluck and Trade Safe!
CAD/JPY MANUALLY CLOSED BEFORE TP HIT! RECAP WEDNESDAYWe entered CADJPY on Wednesday last week and again this was another trade that we had to be patient with. Eventually we started seeing drawback which we were confident that the trade would continue in a bullish momentum and hit our Take profit level. All though we closed our positions out early and secured a further +30 Pips to recoup the losses we had earlier during the week. with this trade secured we were now up +100 pips for 3 days (including our losses).


CAD/JPY Analysis Welcome back! Please support this idea with a LIKE if you find it useful.
*** CAD/JPY - Potential B-Swing Strategy Set Up. Wait for entry signals in sell zone for a nice short to the downside.
We recommend that you keep this pair on your watchlist and enter when the entry criteria of your strategy is met.
Click "Follow" on our profile if you'd like these trade ideas delivered straight to your email in the future.
Thanks for your continued support!
Brian Kenya Horton, BK Forex Academy


CADJPY facing bullish pressure Price is taking support on 1st support level, in line with the ascending trendline support, horizontal pullback support, 78.6% fibonacci extension and 38.2% fibonacci retracement. Prices might potentially bounce to 1st resistance , which is a 78.6% fibonacci extension and -27.2% fibonacci retracement. If prices fall through the first support, prices might pullback to 2nd support which coincides with horizontal swing low support, 161.8% fibonacci extension and 38.2% fibonacci retracement. EMA is also below prices, suggesting a bullish pressure on the prices.


CADJPY for new recent highs? 🦐CADJPY is moving inside an ascending channel.
The market is now consolidating below a minor resistance nearby the recent highs.
According to Plancton's strategy, if the price will break above, we can set a nice long order.
–––––
Follow the Shrimp 🦐
Keep in mind.
🟣 Purple structure -> Monthly structure.
🔴 Red structure -> Weekly structure.
🔵 Blue structure -> Daily structure.
🟡 Yellow structure -> 4h structure.
⚫️ Black structure -> <4h structure.
Here is the Plancton0618 technical analysis , please comment below if you have any question.
The ENTRY in the market will be taken only if the condition of the Plancton0618 strategy will trigger.

CADJPY is facing bullish pressure, potential upside | 3 Mar 2021Price is facing bullish pressure from our ascending trend line where we could see an upside above this level.
