CADJPY tesing a daily resistance 🦐CADJPY on the daily chart found support around 78.450 level.
The price after consolidation broke the minor resistance at 79.00 and start a new bullish impulse.
If the market will manage to break and close above the daily resistance we can set a nice long order according to Plancton's strategy.
–––––
Follow the Shrimp 🦐
Keep in mind.
🟣 Purple structure -> Monthly structure.
🔴 Red structure -> Weekly structure.
🔵 Blue structure -> Daily structure.
🟡 Yellow structure -> 4h structure.
⚫️ Black structure -> >4h structure.
Here is the Plancton0618 technical analysis , please comment below if you have any question.
The ENTRY in the market will be taken only if the condition of the Plancton0618 strategy will trigger.
Cad-jpy


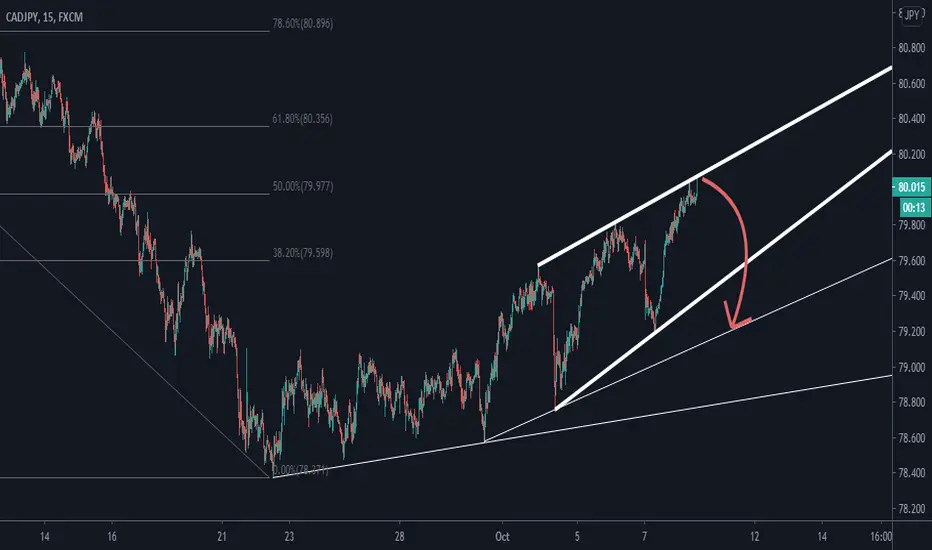
rising wedge day trading chart pattern CADJPY Has made ending diagonal pattern in its last corrective wave. It already had made many higher high
CAD JPY SELL (CANADIAN DOLLAR - JAPANESE YEN)Hi there. Price is forming a continuation pattern to the downside. Watch strong price action at the current levels for sell.

CADJPY FOR CLEAR SELLThere is a clear sell for CADJPY, as it passed below the moving averages of the Ichimoku indicator.


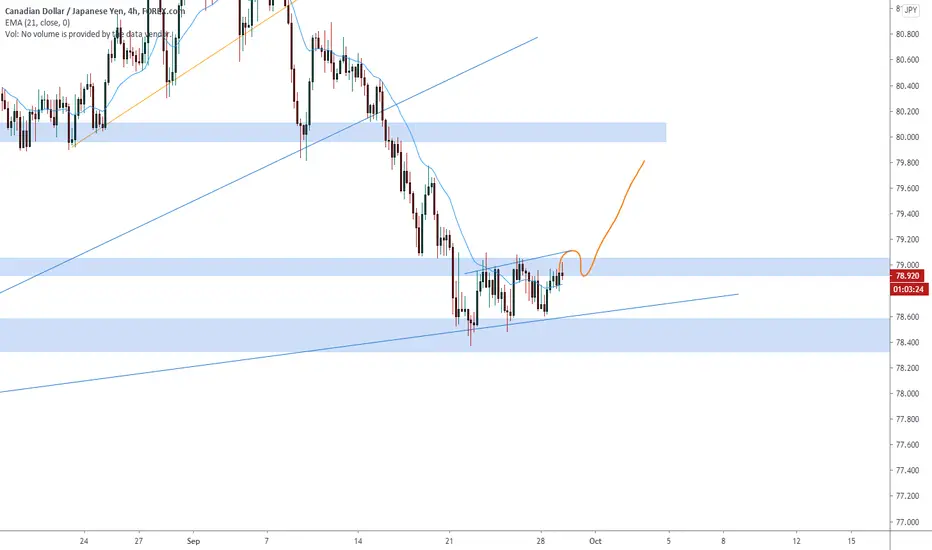
CADJPY on the channel bottom 🦐CADJPY on the daily chart hit the bottom trendline of the ascending channel at 78.500 area.
On the 4 h chart the price start to range between 2 structure at 78.500 and 79.000.
IF the price will break above the daily strcyure we can set a nice long order according to Plancton's strategy.
–––––
Follow the Shrimp 🦐
Here is the Plancton0618 technical analysis, please comment below if you have any question.
The ENTRY in the market will be taken only if the condition of Plancton0618 strategy will trigger.
CAD_JPY STRUCTURE LONG| TRIANGLE TRADING PLAN
bigger picture
CAD_JPY BULLISH MOMENTUM BELOW THE RESISTANCE IN A MIGHT-BE TRIANGLE
(1) The price might bounce there and there along the rising support
(2) Whenever the breakout up happens
(3) Long on pullback
_________________________________
LIKE and SUBSCRIBE for KARAMA boost!

CADJPY - ShortCADJPY is showing a bearish flag.
The long downward trendline is the 'flag pole' leading up to the flag.
In the flag pattern, the price makes higher lows and lower highs to make a 'flag-like' pattern. Eventually, price will break out of this pattern.
The trend before the pattern was created was bearish with a dominant downtrend. It is likely that the price will break below the pennant glad and continue this downward trend.
Before entering a short trade here, I will wait for confirmation of a breakout by 4H bearish candles, and looking for a potential re-test of the trend line before the downtrend plays out.

CADJPY WEEKLY OUTLOOKTECHNICALS:
Daily asymmetric triangle
4hr bear flag
weekly fib
daily resistance
Buys:
Break of triangle
Close above 38.2% fib
Close above daily resistance
Sells:
Break of triangle
Close below 23.6%

CADJPYCADJPY is currently not decided yet but a break into the yellow zone would have me going long to my TP2. Actions there will decide if I go for TP3 as well.
Stop loss remains below las low.

CADJPY short79.23(50ema) looks like a good place to expect a sell... stochastic is overbought, RSI is below 50, 50ema is below 200ema and there's a minor supply zone at that level

CADJPY is facing bearish pressure, potential reversal! CADJPY is testing its resistance at 79.077 where it could potentially drop further to 77.641.
Trading CFDs on margin carries high risk.
Losses can exceed the initial investment so please ensure you fully understand the risks.

CADJPY SHORT ALERT ! CADJPY SHORT ALERT STILL AVAILABLE TO JUMP ON ! BUY POSITION WAS CLOSED AND LOSSES CUT - LETS SEE HOW THIS ONE PLAYS OUT !
The entry price, SL and multiple TPs are shown on the chart.
Our back testing and money management strategy itself is holding until a reverse signal to ride a big trend, but as you will not see the next signal - manage the trade as you wish should you decide to enter.
What is our strategy?
Our strategy is a trend following strategy, can be used on any instrument and time frame. However, we have hard coded specific parameters for when trading the H1 time frame, so we can back up over 4200 previous trades to confirm our edge from previous data. This gives us confidence in execution and belief in our trading strategy for the long term.
The strategy simply sits in your trading view, so you will see exactly what we see - the trade, entry price, SL and multiple TPs (although we hold until opposite trade as this is the most profitable longer term plan), lot size, etc.
This could be on your phone trading view app, or laptop of course.
The hard work is done, so we have zero chart work time, no analysis, no time front of the chart doing technical analysis - technical analysis is very subjective - you may see different things at different times - how do you have a rigid trading plan on a H&S shoulder pattern? Your daily routine, diet, sleep, exercise can affect what you 'see' and your decision making, this doesn't happen when a strategy is coded like this; what we do have is a mechanical trading strategy...
What does this mean?
It means, we are very clear on our entry and our exit and use strict risk management (this is built in - put in your account size, set your risk in % or fixed amount and it will tell you what lot size to trade!) so we have no ego with our position and we are comfortable with all outcomes - its simply just another trade. This free's our mindset from worry and anxiety as we take confidence from knowing our edge is there and also that we have used sensible risk management.
The strategy itself can be used as a live trading journal too - how cool is that? The strategy will confirm and support every open and closed position - so its quite easy to follow.
We just have to do what Percy does.
Please see our related ideas below for more information to explain what we do and how it can help you.

CADJPY is in a strong falling channelThe price tried to above the resistance line but failed, I epxect the price will fall down to the support


CADJPY Price has stalled out on the monthly S2 This is a full breakdown of my perception of price action on higher time frames! I take my entries using smaller time frame confirmation and you should, too. If you have any questions about this trade or my strategies feel free to ask them in the comment section below!
Let’s make some money together!

CADJPY is facing bearish pressure | 23 Sep 2020Price is facing bearish pressure where we could see a reversal below this level.

CADJPY is facing bearish pressure | 23 Sep 2020Price is facing bearish pressure where we could see a reversal below this level.

CADJPY - BUY NOW OPEN ! CADJPY - buy position now valid.
The entry price, SL and multiple TPs are shown on the chart.
Our back testing and money management strategy itself is holding until a reverse signal to ride a big trend, but as you will not see the next signal - manage the trade as you wish should you decide to enter.
What is our strategy?
Our strategy is a trend following strategy, can be used on any instrument and time frame. However, we have hard coded specific parameters for when trading the H1 time frame, so we can back up over 4200 previous trades to confirm our edge from previous data. This gives us confidence in execution and belief in our trading strategy for the long term.
The strategy simply sits in your trading view, so you will see exactly what we see - the trade, entry price, SL and multiple TPs (although we hold until opposite trade as this is the most profitable longer term plan), lot size, etc.
This could be on your phone trading view app, or laptop of course.
The hard work is done, so we have zero chart work time, no analysis, no time front of the chart doing technical analysis - technical analysis is very subjective - you may see different things at different times - how do you have a rigid trading plan on a H&S shoulder pattern? Your daily routine, diet, sleep, exercise can affect what you 'see' and your decision making, this doesn't happen when a strategy is coded like this; what we do have is a mechanical trading strategy...
What does this mean?
It means, we are very clear on our entry and our exit and use strict risk management (this is built in - put in your account size, set your risk in % or fixed amount and it will tell you what lot size to trade!) so we have no ego with our position and we are comfortable with all outcomes - its simply just another trade. This free's our mindset from worry and anxiety as we take confidence from knowing our edge is there and also that we have used sensible risk management.
The strategy itself can be used as a live trading journal too - how cool is that? The strategy will confirm and support every open and closed position - so its quite easy to follow.
We just have to do what Percy does.
Please see our related ideas below for more information to explain what we do and how it can help you.

What I'm seeing on CADJPY!If my long term trend line holds then we could be seeing some growth. Till then
