CADJPY: Bullish Continuation
CADJPY broke and closed above a horizontal decision range with a high momentum bullish candle on a daily.
Now we expect a bullish continuation from a broken level.
next goals for buyers:
80.0
80.5
Cad-jpy

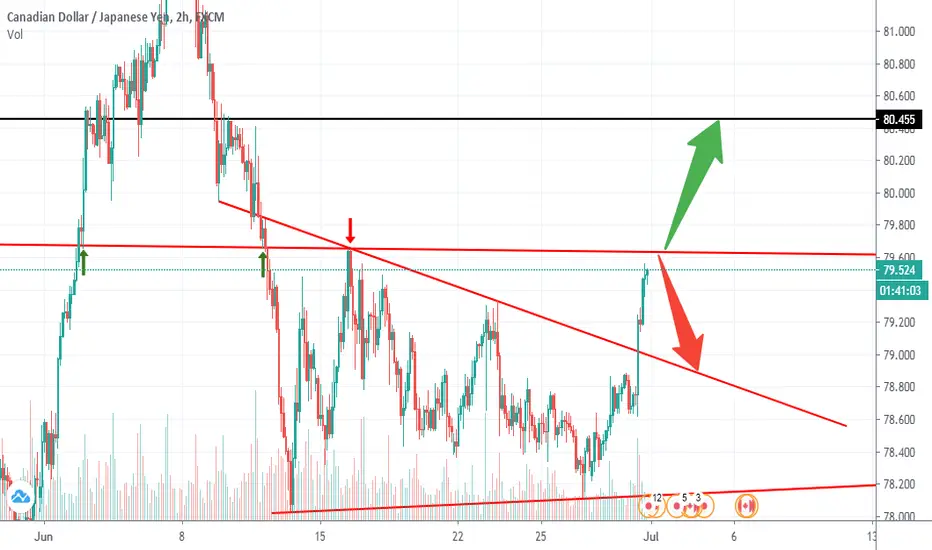
What I'm seeing on CADJPY!Price almost at my Trend line. If it gets respected, then i should go short. If otherwise, north i go. lets see
CADJPY is reversing after touching the trendline | 26 JuneCADJPY is reversing after touching the trendline and could drop further !
Thanks everyone for tuning in to today's analysis . If any part of this video is unclear, please ask me for in the comment section below. If you found today's video useful in any way, please "like" this video and leave a comment on what currency pair you'd like me to analyze next too.
Until next time, see ya!

CADJPY H4 ANALYSISHello Traders, here are the possible scenarios on CADJPY. We'll wait for price action to determine what to do next.


CADJPY | ASIAN SESSION | SHORTLooking for a continuation on the open of the Asian Session.
Big Picture View
Strong: JPY
Weak: CAD
This trade is invalid after 24/06/2020 @ 6 am BST.
Follow me on Tradingview or DM in the chat.
Don't forget to hit the like button
🐉 HAPPY TRADING 🐉

CADJPY ANALYSISCADJPY respects major uptrendline on H4 frame
Pair is based above demand zone at level 78.40
Price broke corrective downtrendline
MACD shows bullish momentum
RSI is above level 50
It's expected for the continuation of bullish momentum to target first key level at 81.60
then finally target supply zone at level 84.65

CADJPY ANALYSISCADJPY respects major uptrendline
Pair is based above demand zone at level 78.40
Price broke corrective downtrendline
MACD shows bullish momentum
RSI is above level 50
It's expected for the continuation of bullish momentum to target first key level at 81.55
then finally target supply zone at level 84.65

CADJPYTF: 4 Hr
Price looks to have broken out of a consolidation area and may trade to the downside from this area. Price is also trading near a larger downtrend channel, so that is something to keep an eye on.


CAD/JPY SHORTFrom lower TF, price has broken and retested my trendline support now turned resistance. Im short already. lets see


Continuation of the bullish side? CADJPY by ThinkingAntsOkMain items we can see on the chart:
a) The price had been inside a Range (yellow lines) and was broken with a massive bullish movement
b) After the first impulse we saw a reversal a now we are on a situation where the price is retesting the broken level
c) Above the mentioned zone there is a new corrective Structure (purple lines) + broken descending trendline
d) This situation presents good characteristics for a long setup towards the Bullish Target
e) Our Long view will be annulated if the price reaches the invalidation zone

CAD/JPY Long idea.In my opinion, the pair tested the support and got rejected. There could be second test and it will be rejected as well with high probability. But you can go long with a good risk-reward ratio.
TP: 81.700
SL: 77.800 4h hour candle close.

Double bottom | CADJPYAfter the successful trade on May 25, today we have new potential at CADJPY.
The price forms a double bottom with a potential of 80.41
If you are not familiar with this formation:
A double bottom pattern is a technical analysis charting pattern that describes a change in trend and a momentum reversal from prior leading price action.
It describes the drop of a stock or index, a rebound, another drop to the same or similar level as the original drop, and finally another rebound.
What Does a Double Bottom Tell You?
The double bottom pattern always follows a major or minor down trend in a particular security, and signals the reversal and the beginning of a potential uptrend.
Consequently, the pattern should be validated by market fundamentals for the security itself, as well as the sector that the security belongs to, and the market in general.
The fundamentals should reflect the characteristics of an upcoming reversal in market conditions. Also, volume should be closely monitored during the formation of the pattern.
A spike in volume typically occurs during the two upward price movements in the pattern. These spikes in volume are a strong indication of upward price pressure and serve as further confirmation of a successful double bottom pattern.
Common mistakes
1.Do not looking for the pattern within an up trend!
2.When the bottoms are equal or second is lower than the first one - this is not a double bottom.
3.Don't be greedy and do not rush, always wait for confirmation.

CAD/JPY Symmetry 4 Hour chartHello Traders
Today i'm sharing this 4 hour chart of CAD/JPY and without looking at Indicators i can tell we are heading to another uptrend.
you can become a successful trader by just looking at the market structure and symmetry. In this chart we can see 2 patterns a very hard to catch bullish triangle and a bearish head and shoulder pattern.
See how easy you can predict where price will go after you identify this pattern and after the breakout occurs. For a triangle pattern you measure the widest part where the triangle begins and for a head and shoulder pattern you measure the top of the head to the bottom of the shoulder that will tell you where the market will retrace.
after identifying this patterns i applied Elliot wave theory and we are currently at the beginning of an impulse
hope you guys find this post interesting, if you have any opinion feel free to post


CADJPY WEEKLY OUTLOOK JUNE 15-19CADJPY is looking to fulfill an inverted head+shoulders pattern based on the 4H and lower timeframes. The markets reacted this week with the Federal Funds Rate being kept at 0.25% for the USD. The markets have reacted strongly to that decision and has showed signs of trend reversals/USD strength in most pairs. The criteria I am looking for regarding this pair is 1 of 3 things. A 4HR bullish closure above 79.495. Whether that be a bullish engulfing candlestick, bullish inside bar pattern, or a bullish pin bar candlestick. This should take this pair to 80.490, which would equate to about 98 or so pips. Patience is key.

SHORT CADJPY pulling back to resistance |12 June 2020CADJPY pulling back to resistance and may start the drop from there.
Thanks everyone for tuning in to today's analysis . If any part of this video is unclear, please ask me for in the comment section below. If you found today's video useful in any way, please "like" this video and leave a comment on what currency pair you'd like me to analyze next too.
Until next time, see ya!
