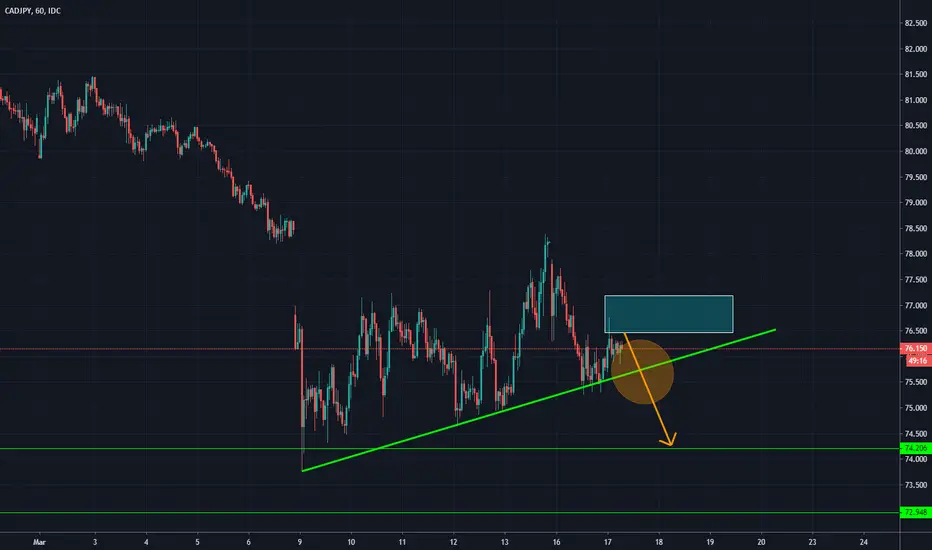
CADJPY Short Trade *TRENDLINE BREAK*Nice TL break and rejections of the daily pivot level form below. We have a lower high forming and I am confident price will now make it's way back down to near term support at 75.500
Nice R:R of 4:1 and stop loss conservative above the current wicks.
Cad-jpy

Cadjpy , waiting for price action. Bias bullish for nowCurrently waiting at the trendline channel. Bias for bullish for short term move. Update from previous analysis, but it seems it move in a strong momentum and currently in a retrace.

CADJPY BuyHello,
I'm expecting this to go up to the 77.960 Level.
This is on the 38% on the daily Tf but it has no level of support, so I'm on trading this on the 4Hr and 1Hr.
I enter on the M15, anything new happens and I'll keep y'all updated.

CadJpy, looking for bullish retracement entryOverall sentiment is still bearish and now forming a triangle, will be looking for any bullish rejection around 75.500 and ride it towards 78.540 for bearish entry. Overall trading strategy is on taking the trade near the edges with excellent risk rewards strategy

Don't miss the great buy opportunity in CADJPYTrading suggestion:
. There is a possibility of temporary retracement to suggested support line (75.89). if so, traders can set orders based on Price Action and expect to reach short-term targets.
Technical analysis:
. CADJPY is in a range bound and the beginning of uptrend is expected.
.The price is above the 21-Day WEMA which acts as a dynamic support.
. The RSI is at 62.
Take Profits:
TP1= @ 76.95
TP2= @ 77.47
TP3= @ 78.45
SL= Break below S2

Don't miss the great buy opportunity in CADJPYTrading suggestion:
. There is a possibility of temporary retracement to suggested support line (76.00). if so, traders can set orders based on Price Action and expect to reach short-term targets.
Technical analysis:
. CADJPY is in a range bound and the beginning of uptrend is expected.
. The price is below the 21-Day WEMA which acts as a dynamic resistance.
. The RSI is at 56.
Take Profits:
TP1= @ 77.10
TP2= @ 77.60
TP3= @ 78.36
SL= Break below S2


CAD JPY BUY (CANADIAN DOLLAR - JAPANESE YEN)Hi there. Price is forming a continuation pattern to the upside. Watch strong price action at the current price for buy.


CADJPY - BUY OPPORTUNITY.Keep on your watchlist for this coming week.
Wait for a confirmation on a lower timeframe.

Short Position on CAD/JPYHello trades,
Please push the LIKE & FOLLOW buttons and leave your COMMENT below.
This is my game plan for this pair CADJPY,
If you want to learn more about my strategies and follow my trades please leave me a message on TradingView or Telegram.
Telegram: NirKubaFX
WhatsApp: +972554373836

CADJPY daily analysisLast week, the pair reached values below 74.
Then we saw correction to 78,3.
Along with yesterday's decrease we expect that the correction is ended and will see lower values around 74.20 and 72.95.
Confirmation of the above situation will be break of correction area - look at the chart!
What movement do you expect for CADJPY?
Leave your thoughts in the comments below.
CADJPY - Updated Analysis!Previously I have written about the same idea on this pair. You can check the idea in linked link below. Still the same pattern, Ascending Triangle. But on the previous idea, the triangle pattern failed, it actually broke the trendline line, so the price dropped and touched the nearest support line, then bounced and now forming a new Ascending Triangle pattern. If this pattern succeeds, at least would rise 300 pips , but if it fails again, then re-break the trendline, the price would fall back to the support line, and possibly would turn back up after touching the support line. So that it would form a new pattern, which is Rectangle. Rectangle is a neutral pattern.

CADJPY - Ascending TriangleAscending Triangle is a pattern that signifies the continuation of the trend, when the trend is up. But if it occurs in a trend that is started by a downtrend, this pattern should signal a reversal. We will see!!

CADJPY LONGHello Bunny's, here is my analysis for CADJPY. Let me know in the comment section if you guys have any questions.
If you like my analysis please hit like. Thanks.


CADJPY expecting higher bearish continuation technicaly basedExepcting break of green trend line and higher bearish continuation.
ENTRY: 78.500
TP: 77.800
TP2: 77.200
TP3: 76.500
SL: 79.500
Chart time frame - 1W
Time for reaching TP - 1-2W
Follow, Like, Share or Comment
Thanks on supporting!
All best!


CADJPY BUY off strong support/resistance trendlineCADJPY at a very strong support/resistance trendline. The two hits on the trendline are almost perfect Looking for price to immediately reverse now towards the next key area which is the last high with much more potential to push towards the 38.2 % fib which is also a key area as well.
CADJPY BUY
start: 79.875
stop loss: 79.525
take profit: 81.123

CADJPY NEXT WEEK OUTLOOKPullback to weekly zone pending.
Enter on 4hr time frame price action confirmation.
Use appropriate risk and trade management.

Nube#32CADJPY sell limit@83.525
SL@84.047
TP@84.047
Looking for a retracement of last micro-wave that could give a proper Risk-Reward.
Target might be too far, so if activated, the trade should be watched carefully.
