CADJPY – holding for 109.50 While NOK (Norwegian krone) has the strongest statistical relationship with Brent and WTI crude, we can see a strengthening correlation between crude and the CAD. We see the 1-month correlation between crude and CADJPY at 0.68, so it's meaningful. We also see (on the daily) price breaking out of the top of its recent range of 108.50. While many will be concerned with being short JPY, given BoJ intervention risk, for now, traders remain happy to fade JPY strength as carry is still attractive (given the low volatility). Also, with crude on the rise the market sees this benefiting Canada’s terms of trade, while it negatively impacts Japan’s economics given, they are a big importer of energy. The bulls happy to hold for 109.50, stops on a daily close below the 5-Day EMA.
Cad-jpy

CADJPY Completing the shark patternAfter the completion of the shark pattern, the price had a jump towards the rise and will probably complete the 5-0 pattern

CADJPY Potential UpsidesHey Traders. In today’s trading session we are monitoring CADJPY for a buying opportunity around 107.100 zone, CADJPY is trading in an uptrend and currently is in a correction phase in which it is approaching the trend at 107.100 support and resistance area.
Trade safe, Joe.
cadjpy bearish ideacadyen is taken its previous liquidity and shifted its structure towards vdown side on on confirmatiomn we can go sells..also we have cad news later today good luck

CADJPY, Massive Ascending-Triangle, BREAKOUT Incoming!Hello There!
Welcome to my analysis about CADJPY on the 6-hour timeframe perspectives. Within the recent times CADJPY is forming a important formation that is likely to convert into a major bearish breakout to emerge in the next upcoming times especially when huge bearish volumes move in here and accelerate the trend-turning-dynamics to the downside this is a highly likely scenario to be expect next.
When looking at my chart CADJPY is forming there this paramount Descending-Channel-Formation in which CADJPY has several massive resistances within the structure firstly overly determined by the Descending-Resistance-Boundary within the Upper-Boundary of the channel formation. Furthermore, CADJPY is now completing the wave-count within the Ascending-Triangle-Formation which is pointing to a final breakout below the lower boundary to emerge in the near terms.
With a final breakout below the lower boundary CADJPY is going to setup the final continuation-origin-setup to continue into the lower spheres of the chart and accelerate heavy bearish momentum into these directions. Once CADJPY has broken out below the 65-EMA as well as the 200-EMA marked in my chart this will be a trigger for more massive and overly bearish momentum moving in to increase the bearish continuation.
Once the final targets marked in my chart have been reached it has to be determined how CADJPY continues from there on because especially when CADJPY continues with massive increased bearish momentum there is a high possibility given that CADJPY just continues into this direction and accelerates further bearish determinations. Otherwise when this is not the case and CADJPY manages to recover within this zone there is a possibility that CADJPY reverses in this zone. These determinations need to be assessed when the price-action developed here.
In this manner, thank you everybody for watching the analysis, support from your side is greatly appreciated.
VP

CADJPY Two scenarios but sell opportunity more closely.The CADJPY pair is trading within a 5-month Channel Up pattern, exactly on its 1D MA50 (blue trend-line). We notice the formation of a Triangle within it, similar to April's. If the 1D candle closes below its Higher Lows trend-line, then we will sell targeting 104.250 (Support 1). If the price breaks above the Lower Highs, we will buy and target long-term the 2.0 Fibonacci extension at 114.775.
-------------------------------------------------------------------------------
** Please LIKE 👍, FOLLOW ✅, SHARE 🙌 and COMMENT ✍ if you enjoy this idea! Also share your ideas and charts in the comments section below! **
-------------------------------------------------------------------------------
💸💸💸💸💸💸
👇 👇 👇 👇 👇 👇

CADJPY Potential upsidesHey Traders, in today’s trading session we are monitoring CADJPY for a buying opportunity around 106.900 zone, CADJPY is trading in an uptrend and currently is in a correction phase in which it is approaching the trend at 106.900 support and resistance zone.
Trade safe, Joe.

CADJPY: Resuming the uptrendI'm looking to buy again, I don't think we've seen the top, we're still miles off an ATH.
With JPY still weak, Oil strong (which gives CAD strength), and a bullish engulfing candle on the 4hr (and a pinbar almost complete) I think we've had a 50% retracement of the last impulse and now back up. It would be great for this 4hr candle to close above the previous with a green candle, but generally signs look like we have upward momentum to me.
I'm going to be careful around the previous high (109) and will likely TP to assess the situation, if we fail to break then I think we'll be heading down fast (I'm expecting JPY strength sometime soon)

Keep it Easy: CadJpy Long can go to 135I have marked 3possible scenario
Trade setups are all bullish
if we break through the oivot,then I will buy immediately. This is the last pivot and cad seems to break it
Scenario 2 if we dont break the pivot and cad falls back to the previous pivot,i will buy the pull back etc.
I also have marked the potential risk rewar ratio
See the chart above
Dont: No sells!Just Buy!
The CAD/JPY pair is trading at 108.99 at the time of writing. It continues to stay higher as the Japanese Yen Futures remain bearish. Fundamentally, Canada reported lower inflation in May, that’s why the CAD lost significant ground versus its rivals. Later, the BOJ Gov Ueda Speaks and Fed Chair Powell Speaks could change the sentiment.
CA Dollar to Yen forecast on Tuesday, July, 4: exchange rate 109.38 Yens, maximum 111.02, minimum 107.74. CAD to JPY forecast on Wednesday, July, 5: exchange rate 109.09 Yens, maximum 110.73, minimum 107.45. CA Dollar to Yen forecast on Thursday, July, 6: exchange rate 109.35 Yens, maximum 110.99, minimum 107.71. CAD to JPY forecast on Friday, July, 7: exchange rate 109.11 Yens, maximum 110.75, minimum 107.47.
In 1 week CA Dollar to Yen forecast on Monday, July, 10: exchange rate 109.20 Yens, maximum 110.84, minimum 107.56. CAD to JPY forecast on Tuesday, July, 11: exchange rate 109.34 Yens, maximum 110.98, minimum 107.70. CA Dollar to Yen forecast on Wednesday, July, 12: exchange rate 109.52 Yens, maximum 111.16, minimum 107.88. CAD to JPY forecast on Thursday, July, 13: exchange rate 110.56 Yens, maximum 112.22, minimum 108.90. CA Dollar to Yen forecast on Friday, July, 14: exchange rate 111.54 Yens, maximum 113.21, minimum 109.87.
CA Dollar to Yen forecast by day
Date Weekday Min Max Rate
04/07 Tuesday 107.74 111.02 109.38
05/07 Wednesday 107.45 110.73 109.09
06/07 Thursday 107.71 110.99 109.35
07/07 Friday 107.47 110.75 109.11
10/07 Monday 107.56 110.84 109.20
11/07 Tuesday 107.70 110.98 109.34
12/07 Wednesday 107.88 111.16 109.52
13/07 Thursday 108.90 112.22 110.56
14/07 Friday 109.87 113.21 111.54
17/07 Monday 109.24 112.56 110.90
18/07 Tuesday 109.24 112.56 110.90
19/07 Wednesday 110.65 114.01 112.33
20/07 Thursday 111.69 115.09 113.39
21/07 Friday 111.46 114.86 113.16
24/07 Monday 112.40 115.82 114.11
25/07 Tuesday 112.38 115.80 114.09
26/07 Wednesday 112.87 116.31 114.59
27/07 Thursday 111.99 115.41 113.70
28/07 Friday 112.66 116.10 114.38
31/07 Monday 113.05 116.49 114.77
01/08 Tuesday 112.58 116.00 114.29
02/08 Wednesday 113.71 117.17 115.44
03/08 Thursday 114.36 117.84 116.10
04/08 Friday 114.16 117.64 115.90

CADJPY Bullish within the Channel Up, bearish below it.CADJPY is trading within a Channel Up since the March 24 bottom. The price action maintained this bullish formation as not only did it recently made a Higher Low but from July 12 to July 18 all 1D candles successfully closed above the 1D MA50 (blue trend-line), something common since April 27. As long as this is taking place, we will stay bullish, targeting 109.250. That is a Lower Highs level, similar to the one on in April, whose fractal resembles today's.
On the other hand, if we close a 1D candle below the 1D MA50, we will sell and target 102.000, just above the 1D MA200 (orange trend-line).
-------------------------------------------------------------------------------
** Please LIKE 👍, FOLLOW ✅, SHARE 🙌 and COMMENT ✍ if you enjoy this idea! Also share your ideas and charts in the comments section below! **
-------------------------------------------------------------------------------
💸💸💸💸💸💸
👇 👇 👇 👇 👇 👇

CADJPY: Sell this consolidation.CADJPY is testing the 1D MA50 in the form of support on bearish 1D technicals (RSI = 42.279, MACD = -0.050, ADX = 56.167). A 1D candle close under the 1D MA50 signifies a validation of selling extension as after the rejection on R1, the long term support of the HL trendline broke.
We will sell this week's consolidation, which isn't just taking on the 1D MA50 but the S1 (104.120) as well, targeting initially the S2 (TP1 = 102.245) and then the S3 (TP2 = 99.350) assuming the 1D MA200 breaks.
## If you like our free content follow our profile to get more daily ideas. ##
## Comments and likes are greatly appreciated. ##

CADJPY on the MA50 (1d). Remains a sell.CADJPY reached the MA50 (1d) for the first time since May 4th.
The pattern is a Channel Up and this correction since its top, still has room to go before bottoming.
Trading Plan:
1. Sell on the current market price.
2. Buy at the bottom of the Channel Up and above the MA100 (1d) at 102.550.
3. Sell if the MA200 (1d) breaks.
Targets:
1. 102.550 (bottom of the Channel Up and near the MA100 1d).
2. 109.500 (Resistance 1).
3. 98.000 (Support 2 and near the 0.786 Fibonacci level).
Tips:
1. The RSI (1d) is headed for the 30.00 oversold level. A rebound near it can match conveniently with a bottom on the Channel Up, hence a buy opportunity.
Please like, follow and comment!!

CADJPY Potential UpsidesHey Traders, in tomorrow's trading session we are monitoring CADJPY for a buying opportunity around 105.600 zone, CADJPY is trading in an uptrend and currently is in a correction phase in which it is approaching the trend at 105.600 support and resistance zone.
Trade safe, Joe.
CADJPY | 32 pips | 1,57 RRRHi,
This is what I expect CADJPY to be doing once price manages to achieve into the entry range you see on the chart.
If you want to set-up your trade like me to achieve 1,57 risk to reward ratio follow my ladder order calculation you see to the left of current price. "Amount" acts as % in this example.
Always calculate your risk:
Avg. Entry: 109,1698725
Profit Target: 108,812
Stop Loss: 109,401

CADJPY Bullish over the 4hour MA50, bearish under it.CADJPY held again the 4hour MA50, which has been providing rebounds for the 1 month Channel Up with breaking since June 1st.
Buy as long as the price stays over it and target the September 13th High (Resistance A) at 110.600.
Sell if it breaks under the MA50 and target the 4hour MA100.
The 4hour RSI is holding its Rising Support. An additional pivot level to use.
Follow us, like the idea and leave a comment below!!

CAD/JPY - LongBullish pennant flag pattern building here.
- Recent strong bullish movements
- Indicators showing signs of further bullish movement
- In line with the overall trend
- Looking for a break of the resistance level around 109.30


CADJPY Upside PotentialHey Traders! 👋
For Day 28/100 of our challenge, we will look at CADJPY for upside potential this week/month
Technicals:
- Stuck in bullish range 104.8-103.6
- Mostly a fundamental-driven trade
- Engage in longs only when support above 104.8 is formed
Fundamentals:
- BoC surprise hike; regains status as hawkish CB
- BoJ meeting this week not expecting any shift from loose policy stance
- Rebound in commodity prices should help the CAD
Sentiment
- CAD also being net short for leveraged funds but JPY is a stronger short
- Retail positioning extreme short territory (we want to go against them)
That's it for today! A more in-depth view with technicals, fundamental, and sentiment.
This is 1/6 of our watchlist. What's in your watchlist?
Anyways, safe trading and see you tomorrow! 🥂

CADJPY: Ideal sell entry now.CADJPY hit today the top of the HH trendline that started the Channel Up at the start of the year. 1D is naturally on firm green level technically (RSI = 64.634, MACD = 1.030, ADX = 45.677) but the RSI has been trading on a flat Rectangle since May 18th. It is the same pattern that led to the February 18th High. Our trigger level to sell is the crossing under the dotted Channel Up. Our target will be the 1W MA100 and bottom of the Channel Up (TP = 98.500).
Prior idea:
## If you like our free content follow our profile to get more daily ideas. ##
## Comments and likes are greatly appreciated. ##

A SELL TRADE SETUP ON CADJPYHey Traders,
Check this analysis on CADJPY out.
There are two possibilities that could play out, and the broken resistance will be the judge of that.
A rebound from the the retest of the resistance means bullish trend and a break below followed by a simple retest means a harp sell off continuation.
Watch out.

BUY TRADE SETUP ON CADJPYHey Traders,
Check this trade analysis out on CADJPY.
A possible bullish run can be look for at any area of breakout of the symmetrical triangle.
Watch out.

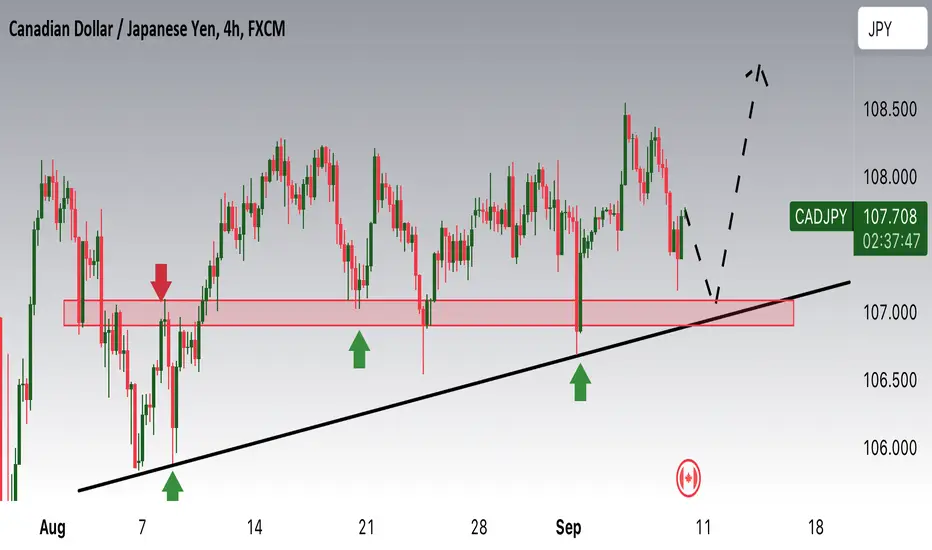
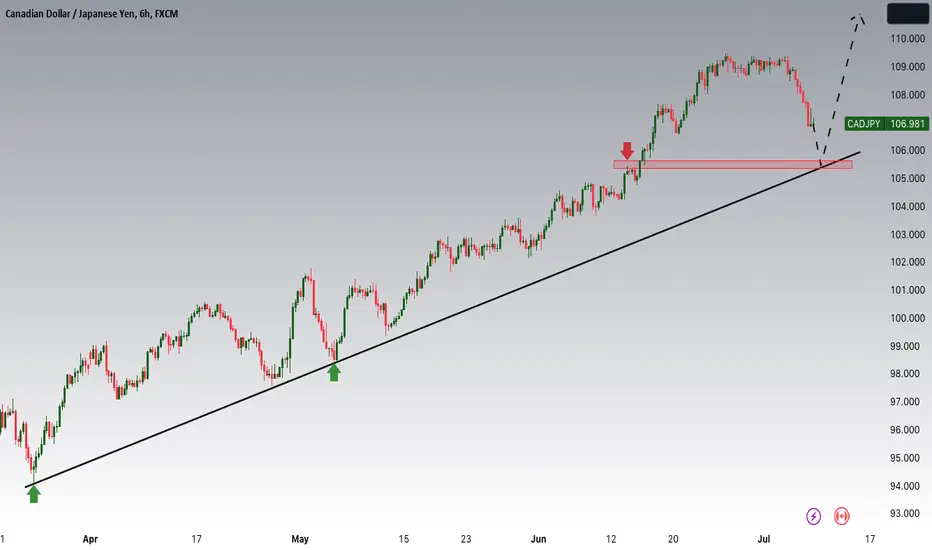
Analyzing CAD/JPY's Upward Trajectory Amidst USD/JPY's BullishThe CAD/JPY currency pair has been exhibiting sustained growth across various timeframes due to its significant correlation with USD/JPY. Notably, the USD/JPY pair has been experiencing a robust bullish trend, exerting downward pressure on the JPY and creating favorable conditions for the CAD to appreciate. A recent development of note is the price breakout of the Ascending Triangle pattern on the H4 timeframe. In light of this, our analysis suggests the likelihood of a new bullish continuation, aligning with the prevailing uptrend direction.

CAD/JPY - Long- Ascending triangle; looking for breakout above resistance level 102.95
- In line with overall bullish trend
- Strong rejection at support zones
- Indicators showing potential for bullish movement
