USD/CAD - Channel Pattern (22.04.2025)The USD/CAD Pair on the M30 timeframe presents a Potential Selling Opportunity due to a recent Formation of a Channel Pattern. This suggests a shift in momentum towards the downside in the coming hours.
Possible Short Trade:
Entry: Consider Entering A Short Position around Trendline Of The Pattern.
Target Levels:
1st Support – 1.3771
2nd Support – 1.3745
🎁 Please hit the like button and
🎁 Leave a comment to support for My Post !
Your likes and comments are incredibly motivating and will encourage me to share more analysis with you.
Best Regards, KABHI_TA_TRADING
Thank you.
CAD

Bullish rebound?CAD/JPY is falling towards the pivot which is a pullback support and could bounce to the 1st resistance which acts as a pullback resistance.
Pivot: 100.55
1st Support: 98.99
1st Resistance: 104.88
Risk Warning:
Trading Forex and CFDs carries a high level of risk to your capital and you should only trade with money you can afford to lose. Trading Forex and CFDs may not be suitable for all investors, so please ensure that you fully understand the risks involved and seek independent advice if necessary.
Disclaimer:
The above opinions given constitute general market commentary, and do not constitute the opinion or advice of IC Markets or any form of personal or investment advice.
Any opinions, news, research, analyses, prices, other information, or links to third-party sites contained on this website are provided on an "as-is" basis, are intended only to be informative, is not an advice nor a recommendation, nor research, or a record of our trading prices, or an offer of, or solicitation for a transaction in any financial instrument and thus should not be treated as such. The information provided does not involve any specific investment objectives, financial situation and needs of any specific person who may receive it. Please be aware, that past performance is not a reliable indicator of future performance and/or results. Past Performance or Forward-looking scenarios based upon the reasonable beliefs of the third-party provider are not a guarantee of future performance. Actual results may differ materially from those anticipated in forward-looking or past performance statements. IC Markets makes no representation or warranty and assumes no liability as to the accuracy or completeness of the information provided, nor any loss arising from any investment based on a recommendation, forecast or any information supplied by any third-party.

Bullish rise?AUD/CAD is reacting off the pivot and could rise to the 1st resistance.
Pivot: 0.88549
1st Support: 0.87948
1st Resistance: 0.89499
Risk Warning:
Trading Forex and CFDs carries a high level of risk to your capital and you should only trade with money you can afford to lose. Trading Forex and CFDs may not be suitable for all investors, so please ensure that you fully understand the risks involved and seek independent advice if necessary.
Disclaimer:
The above opinions given constitute general market commentary, and do not constitute the opinion or advice of IC Markets or any form of personal or investment advice.
Any opinions, news, research, analyses, prices, other information, or links to third-party sites contained on this website are provided on an "as-is" basis, are intended only to be informative, is not an advice nor a recommendation, nor research, or a record of our trading prices, or an offer of, or solicitation for a transaction in any financial instrument and thus should not be treated as such. The information provided does not involve any specific investment objectives, financial situation and needs of any specific person who may receive it. Please be aware, that past performance is not a reliable indicator of future performance and/or results. Past Performance or Forward-looking scenarios based upon the reasonable beliefs of the third-party provider are not a guarantee of future performance. Actual results may differ materially from those anticipated in forward-looking or past performance statements. IC Markets makes no representation or warranty and assumes no liability as to the accuracy or completeness of the information provided, nor any loss arising from any investment based on a recommendation, forecast or any information supplied by any third-party.

Bullish momentum to extend?AUD/CAD has bounced off the support level which is a pullback support and could potentially rise from this level to our take profit.
Entry: 0.88518
Why we like it:
There is a pullback support level.
Stop loss: 0.87962
Why we like it:
There is a pullback support level.
Take profit: 0.89544
Why we like it:
There is an overlap resistance level that lines up with the 61.8% Fibonacci projection.
Enjoying your TradingView experience? Review us!
Please be advised that the information presented on TradingView is provided to Vantage (‘Vantage Global Limited’, ‘we’) by a third-party provider (‘Everest Fortune Group’). Please be reminded that you are solely responsible for the trading decisions on your account. There is a very high degree of risk involved in trading. Any information and/or content is intended entirely for research, educational and informational purposes only and does not constitute investment or consultation advice or investment strategy. The information is not tailored to the investment needs of any specific person and therefore does not involve a consideration of any of the investment objectives, financial situation or needs of any viewer that may receive it. Kindly also note that past performance is not a reliable indicator of future results. Actual results may differ materially from those anticipated in forward-looking or past performance statements. We assume no liability as to the accuracy or completeness of any of the information and/or content provided herein and the Company cannot be held responsible for any omission, mistake nor for any loss or damage including without limitation to any loss of profit which may arise from reliance on any information supplied by Everest Fortune Group.

Could the Loonie reverse from here?USD/CAD is reacting off the support level which is an overlap support and could bounce from this level to our take profit.
Entry: 1.3833
Why we like it:
There is an overlap support level.
Stop loss: 1.3616
Why we like it:
There is an overlap support level that lines up with the 88% Fibonacci retracement.
Take profit: 1.4098
Why we like it:
There is an overlap resistance.
Enjoying your TradingView experience? Review us!
Please be advised that the information presented on TradingView is provided to Vantage (‘Vantage Global Limited’, ‘we’) by a third-party provider (‘Everest Fortune Group’). Please be reminded that you are solely responsible for the trading decisions on your account. There is a very high degree of risk involved in trading. Any information and/or content is intended entirely for research, educational and informational purposes only and does not constitute investment or consultation advice or investment strategy. The information is not tailored to the investment needs of any specific person and therefore does not involve a consideration of any of the investment objectives, financial situation or needs of any viewer that may receive it. Kindly also note that past performance is not a reliable indicator of future results. Actual results may differ materially from those anticipated in forward-looking or past performance statements. We assume no liability as to the accuracy or completeness of any of the information and/or content provided herein and the Company cannot be held responsible for any omission, mistake nor for any loss or damage including without limitation to any loss of profit which may arise from reliance on any information supplied by Everest Fortune Group.

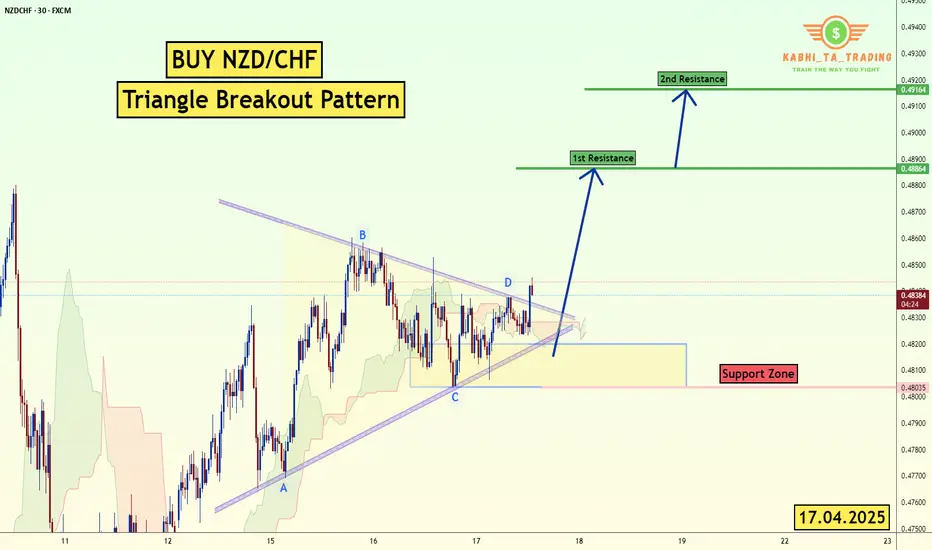
NZD/CHF Triangle Breakout (17.04.2025)The NZD/CHF pair on the M30 timeframe presents a Potential Buying Opportunity due to a recent Formation of a Breakout Pattern. This suggests a shift in momentum towards the upside and a higher likelihood of further advances in the coming hours.
Possible Long Trade:
Entry: Consider Entering A Long Position around Trendline Of The Pattern.
Target Levels:
1st Resistance – 0.4886
2nd Resistance – 0.4916
🎁 Please hit the like button and
🎁 Leave a comment to support for My Post !
Your likes and comments are incredibly motivating and will encourage me to share more analysis with you.
Best Regards, KABHI_TA_TRADING
Thank you.
CADJPY is perhaps the best sell signal long-term.The CADJPY pair has broken marginally below its 1W MA200 (orange trend-line) in recent weeks and turned sideways. This took place on the latest 1W MA50 (blue trend-line) rejection on January 13 2025. As long as the market remains below it, the long-term trend-line will be bearish.
The current 1W MA200 consolidation is in fact similar to what followed after the last major long-term rejection in December 2014. As you can see on the chart, we are on similar trading patterns as August - September 2015. Even the 1W RSI sequences among the two fractals are identical, starting off strong Bearish Divergencies that basically were an early signal for the 2015 - 2016 sell-off and possibly now the 2025 - 2026 sell-off.
As a result, we are bearish on this pair, expecting a 85.000 Target on high probabilities and a 2nd at 75.000 on lower, which is the 14-year Support Zone.
-------------------------------------------------------------------------------
** Please LIKE 👍, FOLLOW ✅, SHARE 🙌 and COMMENT ✍ if you enjoy this idea! Also share your ideas and charts in the comments section below! This is best way to keep it relevant, support us, keep the content here free and allow the idea to reach as many people as possible. **
-------------------------------------------------------------------------------
Disclosure: I am part of Trade Nation's Influencer program and receive a monthly fee for using their TradingView charts in my analysis.
💸💸💸💸💸💸
👇 👇 👇 👇 👇 👇

USDCAD - Bank of Canada keeps interest rates unchanged!The USDCAD pair is below the EMA200 and EMA50 on the 4-hour timeframe and is in its descending channel. The continuation of the downward movement of this pair will provide us with a buying position with a good risk-reward ratio. If the correction continues, we can sell within the specified supply zone.
On Wednesday, oil prices climbed by approximately 1%, driven by renewed optimism in the markets regarding potential trade talks between the United States and China. However, lingering concerns about the trade war’s negative effects on global energy demand limited further gains in oil prices.Initially, oil prices declined, but market sentiment shifted after Bloomberg reported—citing an anonymous source—that China was seeking greater respect from the Trump administration before agreeing to new negotiations. The same source also stated that China had requested a new outreach from the U.S. to initiate the discussions.
Giovanni Staunovo, an analyst at UBS, commented that easing trade tensions between the two nations could help reduce constraints on economic growth and energy demand, potentially exerting downward pressure on oil prices.
Meanwhile, the International Energy Agency (IEA) reported that global oil demand is expected to rise by just 730,000 barrels per day this year—well below both its previous projections and those of OPEC.
In a new report, the Fitch rating agency warned that the intensifying global trade war has significantly weakened the outlook for economic growth. According to the report, China’s economic growth will fall below 4% in both this year and the next, while the eurozone is projected to grow by less than 1%.
Fitch further estimates that global economic growth in 2025 will fall below 2%, marking the weakest performance since 2009 (excluding the COVID-19 pandemic period).
Despite the sharp decline in the U.S. growth outlook, Fitch expects the Federal Reserve to delay any interest rate cuts until Q4 of 2025. Conversely, deeper rate cuts are anticipated for the European Central Bank and emerging market economies.
In the energy sector, Fitch lowered its short-term oil price forecast due to risks stemming from weaker demand and trade disruptions but left its natural gas price forecast unchanged.
Additionally, the Bank of Canada maintained its policy rate at 2.75%. Highlights from the Bank’s monetary statement include:
• Tariffs and logistical challenges are driving price increases.
• New U.S. trade policies have heightened uncertainty, slowed growth, and sparked inflation fears.
• The Bank supports economic growth with inflation control but urges caution due to elevated domestic risks.
• Both upside risks (higher costs) and downside risks (weaker growth) to inflation are under close watch.
• Beginning in April, the removal of carbon taxes and cheaper oil are expected to temporarily lower inflation for about a year.
• The recent rise in inflation reflects renewed commodity price growth and the end of temporary sales tax relief.
• Due to high uncertainty related to U.S. trade tariffs, the Bank is refraining from issuing an economic forecast.
• The output gap in Q1 2025 was estimated between 0% and -1%.
• Annualized GDP growth for the same quarter was 1.8%, down from the January forecast of 2%.
• Two scenarios are under consideration: one involving tariff reduction via agreement, and another involving a prolonged global trade war.
• In the first scenario, Canadian and global growth temporarily decline, inflation drops to 1.5%, and later returns to the 2% target.
• In the second, the global economy slows sharply, inflation surges, and Canada enters a severe recession. Inflation surpasses 3% by mid-2026 before returning to the 2% target.
• In both scenarios, the neutral interest rate is estimated to be around the midpoint of the 2.25%–3.25% range.

NZD/CAD Fundamental Update (17.04.2025) The NZD/CAD Pair on the M30 timeframe presents a Potential Selling Opportunity due to a recent Formation of a Breakout Pattern. This suggests a shift in momentum towards the downside in the coming hours.
Possible Short Trade:
Entry: Consider Entering A Short Position around Trendline Of The Pattern.
Target Levels:
1st Support – 0.8138
2nd Support – 0.8077
🎁 Please hit the like button and
🎁 Leave a comment to support for My Post !
Your likes and comments are incredibly motivating and will encourage me to share more analysis with you.
Best Regards, KABHI_TA_TRADING
Thank you.

Falling towards Fibonacci confluence?CAD/CHF is falling towards the pivot and could bounce to the 1st resistance.
Pivot: 0.57865
1st Support: 0.56812
1st Resistance: 0.59362
Risk Warning:
Trading Forex and CFDs carries a high level of risk to your capital and you should only trade with money you can afford to lose. Trading Forex and CFDs may not be suitable for all investors, so please ensure that you fully understand the risks involved and seek independent advice if necessary.
Disclaimer:
The above opinions given constitute general market commentary, and do not constitute the opinion or advice of IC Markets or any form of personal or investment advice.
Any opinions, news, research, analyses, prices, other information, or links to third-party sites contained on this website are provided on an "as-is" basis, are intended only to be informative, is not an advice nor a recommendation, nor research, or a record of our trading prices, or an offer of, or solicitation for a transaction in any financial instrument and thus should not be treated as such. The information provided does not involve any specific investment objectives, financial situation and needs of any specific person who may receive it. Please be aware, that past performance is not a reliable indicator of future performance and/or results. Past Performance or Forward-looking scenarios based upon the reasonable beliefs of the third-party provider are not a guarantee of future performance. Actual results may differ materially from those anticipated in forward-looking or past performance statements. IC Markets makes no representation or warranty and assumes no liability as to the accuracy or completeness of the information provided, nor any loss arising from any investment based on a recommendation, forecast or any information supplied by any third-party.

Bearish drop off pullback resistance?AUD/CAD has rejected off the pivot which is a pullback resistance and could drop to the 1st support which has been identified as a pullback support.
Pivot: 0.88549
1st Support: 0.87205
1st Resistance: 0.89370
Risk Warning:
Trading Forex and CFDs carries a high level of risk to your capital and you should only trade with money you can afford to lose. Trading Forex and CFDs may not be suitable for all investors, so please ensure that you fully understand the risks involved and seek independent advice if necessary.
Disclaimer:
The above opinions given constitute general market commentary, and do not constitute the opinion or advice of IC Markets or any form of personal or investment advice.
Any opinions, news, research, analyses, prices, other information, or links to third-party sites contained on this website are provided on an "as-is" basis, are intended only to be informative, is not an advice nor a recommendation, nor research, or a record of our trading prices, or an offer of, or solicitation for a transaction in any financial instrument and thus should not be treated as such. The information provided does not involve any specific investment objectives, financial situation and needs of any specific person who may receive it. Please be aware, that past performance is not a reliable indicator of future performance and/or results. Past Performance or Forward-looking scenarios based upon the reasonable beliefs of the third-party provider are not a guarantee of future performance. Actual results may differ materially from those anticipated in forward-looking or past performance statements. IC Markets makes no representation or warranty and assumes no liability as to the accuracy or completeness of the information provided, nor any loss arising from any investment based on a recommendation, forecast or any information supplied by any third-party.

Bearish drop?NZD/CAD is reacting off the pivot and could drop to the 1st support.
Pivot: 0.82329
1st Support: 0.82448
1st Resistance: 0.83294
Risk Warning:
Trading Forex and CFDs carries a high level of risk to your capital and you should only trade with money you can afford to lose. Trading Forex and CFDs may not be suitable for all investors, so please ensure that you fully understand the risks involved and seek independent advice if necessary.
Disclaimer:
The above opinions given constitute general market commentary, and do not constitute the opinion or advice of IC Markets or any form of personal or investment advice.
Any opinions, news, research, analyses, prices, other information, or links to third-party sites contained on this website are provided on an "as-is" basis, are intended only to be informative, is not an advice nor a recommendation, nor research, or a record of our trading prices, or an offer of, or solicitation for a transaction in any financial instrument and thus should not be treated as such. The information provided does not involve any specific investment objectives, financial situation and needs of any specific person who may receive it. Please be aware, that past performance is not a reliable indicator of future performance and/or results. Past Performance or Forward-looking scenarios based upon the reasonable beliefs of the third-party provider are not a guarantee of future performance. Actual results may differ materially from those anticipated in forward-looking or past performance statements. IC Markets makes no representation or warranty and assumes no liability as to the accuracy or completeness of the information provided, nor any loss arising from any investment based on a recommendation, forecast or any information supplied by any third-party.

Bullish bounce off 38.2% Fibonacci support?GBP/CAD is falling towards the support level which is a pullback support that aligns with the 38.2% Fibonacci retracement and could bounce from this level to our take profit.
Entry: 1.8286
Why we like it:
There is a pullback support level that lines up with the 38.2% Fibonacci retracement.
Stop loss: 1.8183
Why we like it:
There is a pullback support level that lines up with the 61.8% Fibonacci retracement.
Take profit: 1.8469
Why we like it:
There is an overlap resistance level.
Enjoying your TradingView experience? Review us!
Please be advised that the information presented on TradingView is provided to Vantage (‘Vantage Global Limited’, ‘we’) by a third-party provider (‘Everest Fortune Group’). Please be reminded that you are solely responsible for the trading decisions on your account. There is a very high degree of risk involved in trading. Any information and/or content is intended entirely for research, educational and informational purposes only and does not constitute investment or consultation advice or investment strategy. The information is not tailored to the investment needs of any specific person and therefore does not involve a consideration of any of the investment objectives, financial situation or needs of any viewer that may receive it. Kindly also note that past performance is not a reliable indicator of future results. Actual results may differ materially from those anticipated in forward-looking or past performance statements. We assume no liability as to the accuracy or completeness of any of the information and/or content provided herein and the Company cannot be held responsible for any omission, mistake nor for any loss or damage including without limitation to any loss of profit which may arise from reliance on any information supplied by Everest Fortune Group.

USDCAD Selling not over yet.Last time we looked at the USDCAD pair (March 21, see chart below), we got the most optimal sell entry that easily hit our 1.4000 Target:
As the price broke below its 1D MA200 (orange trend-line) having made a significant correction since the February 03 High, we believe there is more selling to be made at least on the short-term.
That is because the Higher Lows Zone that started on the May 2021 market bottom, hasn't yet been tested and since December 2023, the market always broke inside it before rebounding.
As a result, we expect a new rejection on the 1D MA200, delivering a 1.38200 Target.
-------------------------------------------------------------------------------
** Please LIKE 👍, FOLLOW ✅, SHARE 🙌 and COMMENT ✍ if you enjoy this idea! Also share your ideas and charts in the comments section below! This is best way to keep it relevant, support us, keep the content here free and allow the idea to reach as many people as possible. **
-------------------------------------------------------------------------------
Disclosure: I am part of Trade Nation's Influencer program and receive a monthly fee for using their TradingView charts in my analysis.
💸💸💸💸💸💸
👇 👇 👇 👇 👇 👇

AUDCAD - BULLISH MOVEHello Traders !
The AUDCAD failed to create a new lower low !
The Lower high is broken (change of character).
So, I expect a bullish move🚀
________________
TARGET: 0.88480🎯

After CAN CPIs, it's time to prepare for BoC rate decisionLooking at the CPI numbers that came out, we are noticing some weakness in the CAD right now. This weakness may spill over into tomorrow's trading, as the BoC is expected to keep the rates unchaged.
Let's dig in!
FX_IDC:USDCAD
MARKETSCOM:USDCAD
Let us know what you think in the comments below.
Thank you.
77.3% of retail investor accounts lose money when trading CFDs with this provider. You should consider whether you understand how CFDs work and whether you can afford to take the high risk of losing your money. Past performance is not necessarily indicative of future results. The value of investments may fall as well as rise and the investor may not get back the amount initially invested. This content is not intended for nor applicable to residents of the UK. Cryptocurrency CFDs and spread bets are restricted in the UK for all retail clients.

USD/CAD Breakout Pattern (15.04.2025)The USD/CAD pair on the M30 timeframe presents a Potential Buying Opportunity due to a recent Formation of a Breakout Pattern. This suggests a shift in momentum towards the upside and a higher likelihood of further advances in the coming hours.
Possible Long Trade:
Entry: Consider Entering A Long Position around Trendline Of The Pattern.
Target Levels:
1st Resistance – 1.4034
2nd Resistance – 1.4131
🎁 Please hit the like button and
🎁 Leave a comment to support for My Post !
Your likes and comments are incredibly motivating and will encourage me to share more analysis with you.
Best Regards, KABHI_TA_TRADING
Thank you.

NZDCAD - Change of character Hello Traders !
The NZDCAD failed to create a new lower low !
The Lower high is broken (change of character).
So, I predict a bullish move🚀
________________
TARGET: 0.81780🎯

Falling towards Fibonacci confluence?CAD/CHF is falling towards the pivot and could bonce to the 1st resistance which is a pullback resistance.
Pivot: 0.57865
1st Support: 0.56812
1st Resistance: 0.59362
Risk Warning:
Trading Forex and CFDs carries a high level of risk to your capital and you should only trade with money you can afford to lose. Trading Forex and CFDs may not be suitable for all investors, so please ensure that you fully understand the risks involved and seek independent advice if necessary.
Disclaimer:
The above opinions given constitute general market commentary, and do not constitute the opinion or advice of IC Markets or any form of personal or investment advice.
Any opinions, news, research, analyses, prices, other information, or links to third-party sites contained on this website are provided on an "as-is" basis, are intended only to be informative, is not an advice nor a recommendation, nor research, or a record of our trading prices, or an offer of, or solicitation for a transaction in any financial instrument and thus should not be treated as such. The information provided does not involve any specific investment objectives, financial situation and needs of any specific person who may receive it. Please be aware, that past performance is not a reliable indicator of future performance and/or results. Past Performance or Forward-looking scenarios based upon the reasonable beliefs of the third-party provider are not a guarantee of future performance. Actual results may differ materially from those anticipated in forward-looking or past performance statements. IC Markets makes no representation or warranty and assumes no liability as to the accuracy or completeness of the information provided, nor any loss arising from any investment based on a recommendation, forecast or any information supplied by any third-party.

Pullback resistance ahead?GBP/CAD is rising towards the resistance which is a pullback resistance that lines up with the 127.2% Fibonacci extension and could reverse from this level to our take profit.
Entry: 1.8372
Why we like it:
there is a pullback resistance that lines up with the 127.2% Fibonacci extension.
Stop loss: 1.8465
Why we like it:
There is an overlap resistance that is slightly below the 161.8% Fibonacci extension.
Take profit: 1.8227
Why we like it:
There is a pullback support level.
Enjoying your TradingView experience? Review us!
Please be advised that the information presented on TradingView is provided to Vantage (‘Vantage Global Limited’, ‘we’) by a third-party provider (‘Everest Fortune Group’). Please be reminded that you are solely responsible for the trading decisions on your account. There is a very high degree of risk involved in trading. Any information and/or content is intended entirely for research, educational and informational purposes only and does not constitute investment or consultation advice or investment strategy. The information is not tailored to the investment needs of any specific person and therefore does not involve a consideration of any of the investment objectives, financial situation or needs of any viewer that may receive it. Kindly also note that past performance is not a reliable indicator of future results. Actual results may differ materially from those anticipated in forward-looking or past performance statements. We assume no liability as to the accuracy or completeness of any of the information and/or content provided herein and the Company cannot be held responsible for any omission, mistake nor for any loss or damage including without limitation to any loss of profit which may arise from reliance on any information supplied by Everest Fortune Group.

Bullish bounce off pullback support?GBP/CAD has bounced off the pivot which has been identified as a pullback support and could rise to the 1st resistance which aligns with the 61.8% Fibonacci retracement.
Pivot: 1.8091
1st Support: 1.7913
1st Resistance: 1.8417
Risk Warning:
Trading Forex and CFDs carries a high level of risk to your capital and you should only trade with money you can afford to lose. Trading Forex and CFDs may not be suitable for all investors, so please ensure that you fully understand the risks involved and seek independent advice if necessary.
Disclaimer:
The above opinions given constitute general market commentary, and do not constitute the opinion or advice of IC Markets or any form of personal or investment advice.
Any opinions, news, research, analyses, prices, other information, or links to third-party sites contained on this website are provided on an "as-is" basis, are intended only to be informative, is not an advice nor a recommendation, nor research, or a record of our trading prices, or an offer of, or solicitation for a transaction in any financial instrument and thus should not be treated as such. The information provided does not involve any specific investment objectives, financial situation and needs of any specific person who may receive it. Please be aware, that past performance is not a reliable indicator of future performance and/or results. Past Performance or Forward-looking scenarios based upon the reasonable beliefs of the third-party provider are not a guarantee of future performance. Actual results may differ materially from those anticipated in forward-looking or past performance statements. IC Markets makes no representation or warranty and assumes no liability as to the accuracy or completeness of the information provided, nor any loss arising from any investment based on a recommendation, forecast or any information supplied by any third-party.

Could the Loonie bounce from here?The price is currently at the pivot which is an overlap support and could bounce to the 1st resistance.
Pivot: 1.3876
1st Support: 1.3602
1st Resistance: 1.4147
Risk Warning:
Trading Forex and CFDs carries a high level of risk to your capital and you should only trade with money you can afford to lose. Trading Forex and CFDs may not be suitable for all investors, so please ensure that you fully understand the risks involved and seek independent advice if necessary.
Disclaimer:
The above opinions given constitute general market commentary, and do not constitute the opinion or advice of IC Markets or any form of personal or investment advice.
Any opinions, news, research, analyses, prices, other information, or links to third-party sites contained on this website are provided on an "as-is" basis, are intended only to be informative, is not an advice nor a recommendation, nor research, or a record of our trading prices, or an offer of, or solicitation for a transaction in any financial instrument and thus should not be treated as such. The information provided does not involve any specific investment objectives, financial situation and needs of any specific person who may receive it. Please be aware, that past performance is not a reliable indicator of future performance and/or results. Past Performance or Forward-looking scenarios based upon the reasonable beliefs of the third-party provider are not a guarantee of future performance. Actual results may differ materially from those anticipated in forward-looking or past performance statements. IC Markets makes no representation or warranty and assumes no liability as to the accuracy or completeness of the information provided, nor any loss arising from any investment based on a recommendation, forecast or any information supplied by any third-party.

USDCAD - Long-Term Long!Hello TradingView Family / Fellow Traders. This is Richard, also known as theSignalyst.
📈USDCAD has been overall bullish from a macro perspective trading within the rising blue channel.
This week, USDCAD has been in a correction phase trading within the falling red channel.
Moreover, the green zone is a strong resistance turned support.
🏹 Thus, the highlighted blue circle is a strong area to look for buy setups as it is the intersection of support and lower red/blue trendlines acting non-horizontal support.
📚 As per my trading style:
As #USDCAD approaches the blue circle zone, I will be looking for bullish reversal setups (like a double bottom pattern, trendline break , and so on...)
📚 Always follow your trading plan regarding entry, risk management, and trade management.
Good luck!
All Strategies Are Good; If Managed Properly!
~Rich
Disclosure: I am part of Trade Nation's Influencer program and receive a monthly fee for using their TradingView charts in my analysis.
