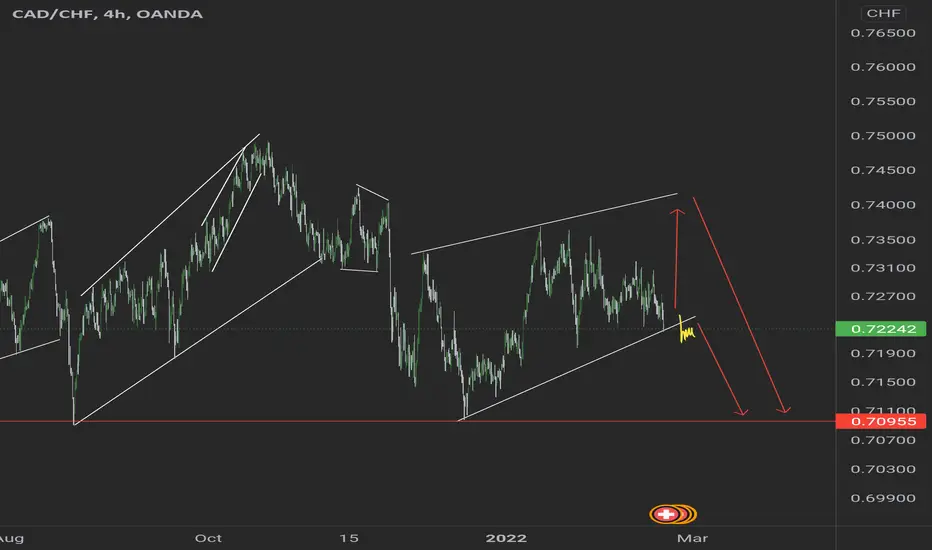
Short CADCHFWhat I see:
- Price has reached major structure high
- A bearish hammer has been formed
- Stochastic is currently overbought and crosses
I'll be expecting price to short towards the closest and most respected support zone which is 0.72326.
Like and subscribe to never miss an idea!
Cadchfanalysis

CAD/CHF Multi-Timeframe & Order Flow analysis Hello Traders, here is the full analysis for this pair, let me know in the comment section below if you have any questions, the entry will be taken only if all rules of the strategies will be satisfied. I suggest you keep this pair on your watchlist and see if the rules of your strategy are satisfied. Please also refer to the Important Risk Notice.

CADCHF | Good Opportunity to sell.When it comes to CADCHF technical analysis , this currency pair is right now in a downtrend.
If you find this technical analysis useful, please like & share our ideas with the community.
What do you think is more likely to happen? Please share your thoughts in comment section. And also give a thumbs up if you find this idea helpful. Any feedback & suggestions would help in further improving the analysis.
Good Luck!
Disclaimer!
This post does not provide financial advice. It is for educational purposes only! You can use the information from the post to make your own trading plan for the market. But you must do your own research and use it as the priority. Trading is risky, and it is not suitable for everyone. Only you can be responsible for your trading.

Long CADCHFI'll be expecting price to long towards 0.73055 (previous major swing high) after breaking middle resistance zone and shows bullish momentum.

CADCHF FOR A BULLISH REVERSAL?Price is in a downtrend on the hourly timeframe, as lower highs and lower lows are being printed. However, recent price action tells us that we might see a short term reversal.
Price is testing a key resistance level at 0.72350, after a possible higher low has been formed.
Before taking long positions, price needs to break above the level with a clear impulse, and then on the pullback shows signs of a continuation.
We do not want to get caught against the trend, so patience is needed to see this trade play out.

Cadchf ready to big Fall are u ready Dont missed Great Entry Cadchf ready to big Fall are u ready Dont missed Great Entry monthly downtrend daily down trend I m expecting h4 from supply

Long CADCHF6 rejections and 1 false breakout from the ascending trend line on the daily chart. The trend line was respected since March 2020. Price rejected of from the resistance horizontal zone twice, turned into a support zone and price rejected that twice in the 4hr chart. I'll be expecting price to long towards 0.72900.

CADCHF clear bearish price action Hi Traders,
CADCHF is consolidating within a bearish continuation correction which with the Global events occurring I suspect CHF to gain strength. Price action clearly shows sharp impulses after the corrections complete and with the Russia and Ukraine tension happening, we may expect another impulse move downward.
Always wait for confirmation before taking your trade. Follow your trading plan!
Good luck!
Comment below and share your view on this pair! Support more of these by clicking the like button if this has helped you!
Bearish price action, look for a SELLHi Traders
CADCHF is showing bearish price action with multiple corrective structures developing. The last correction gave us an LTF correction at the top of the channel to validate a sell opportunity. Price pushed down and gave us a CAB entry (correction after breakout).
Manage your targets appropriately and follow your trading plan.
Click the like button if this has helped you!

CAD/CHF 1HR SELL SET UPHi TRADERS this is my trade set up for the CAD/CHF
CAD/CHF Coming in to area of resistance I am looking to take a sell only
This is my analysis only please trade with caution and risk management in place
clean crisp charts I hope it helps if you have any questions please private message me
good luck for this weeks trading
please like comment and follow

Short CADCHFI expect price to fall towards the previous swing low as it has been respected several times since December 2021. My second reason is because price has broken out of the ascending trend line which has also shown strength since December 2021. After seeing that there has been a clear break to the low side, I won't be surprised if price heads up for a retest before shorting towards 0.71950, which is also a major ascending trend line that started in March 2020.

Long opportunity Hello traders
As you can see on the chart, the price is in a bullish trend.
Now the price makes a HL . After a good signal it will go up for making a new HH.
Always use stop loss
What do you think about this idea?

CAD/CHF Ready For the M Pattern Completion ? Hello Traders, here is the full analysis for this pair, let me know in the comment section below if you have any questions, the entry will be taken only if all rules of the strategies will be satisfied. I suggest you keep this pair on your watchlist and see if the rules of your strategy are satisfied. Please also refer to the Important Risk Notice.

CADCHFHello traders. With the break of the uptrend line, the price is expected to return to the levels of 50% to 61.8% and decrease to the previous floor. Be profitable

CADCHFHello traders. I expect the price to fall 110 pips by breaking this trend line so that the previous floor is a safe place. Are you agree?


CADCHF SetupCADCHF is trading in a parrallel bearish channel, making swing lower high and lower lows.
We are expecting bears to drag the price from the resistance zone.
Trade your levels accordingly.
Don't forget to share your valuable feedback in comment section.
Check our other Forex and Crypto Setup on Profile.

CAD/CHF: more Bearish continuationHello, everybody, and welcome to my TradingView’s profile, my name is Gianni and today I’m going to analyse the asset , translating the market information by using a full technical analysis on different time frames, giving you a personal opinion about the next most likely market movement and helping you to spot and manage market opportunities.
My ideas are for those who are interested in improving their financial education and for those who are looking for new trading opportunities, according with their own strategies.
Monthly timeframe:
Weekly timeframe:
Daily timeframe:
4 hours timeframe:
The market is currently following a descending channel and as you can see on the chart, at the beginning of this channel, the most trading activity was on the higher part, clue that the buyers were still trying to push the price up.
Recently the view is changed, in fact sellers now seem to be very aggressive, just look how quickly they reject the price!
When, where and why would I step into the market?
Considering the recent trading activity on the lower part of this dynamic value area, I will be only looking for sell positions.
I will patiently wait a price retracement back to the higher value of the channel and only in that moment (if it will happen), I will be looking for a bearish price action and a good entry point with a RRR of 1:2 or greater.
My SL would be above the channel and my first TP around the middle line.
If you enjoy this trade idea, please support my work with a thumb up and don’t forget to follow my profile for more detailed market analyses!
Trade safe and responsibly,
Gianni
DISCLAIMER
Please note the views are not investment advice and should be used only for educational purpose

Cadchf ProjectionsSo, the structural change from the canadian dollar and czech currency have been looking bullish lately.
Here's my projction!


CAD/CHFThree market phases. Looking for a bounce back up to the order block above. We are currently in the expansion phase.


CADCHF (15m) May Pump to 0.73777It's not late to jump in and ride the short term wave for 60+pips.
Strategy: Shift in Direction
There is BOS and Correction to 78.6% fibo level of the swing that caused the break. I expect price to grow to my target 2, but first, i have to cover the cost by taking profit in-between.
LET ME KNOW HWAT YOU THINK (LIKE, COMMENT AND FOLLOW ME PLEASE)
