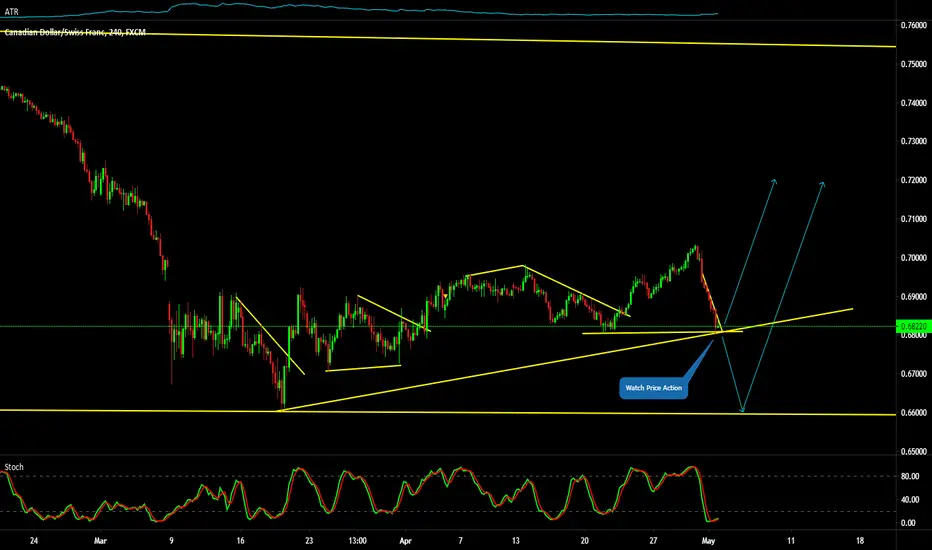
CADCHF LongA 4h timeframe channel is formed inside a bigger channel on the 1d timeframe, in an uptrend. Will wait price to pullback to the lower side of the 4h channel, then wait for a reversal, followed by right candle formation to enter the trade.
Cadchflong

CADCHFbuy at 0.69789 but in case the chart goes down a little bit to 0.69537 and confirm a bounce back from there then buy it from there put your tp otherwise sell it.

CADCHF, Fake Breakout Possible.Still strong rejection point at 1D,1W,4H TF.
Could be fake breakout.
Might go LONG still.
If market opens below and candle closes
then might start dipping targeting 0.67 range.
Else 0.7 can be expected.

CAD/CHF Ascending channel has been broken. $CAD $CHF $EUR $USDCAD/CHF Price has been broken through the support line of ascending channel. We expect price to go back to support line which then will become resistance. After the price has reached now resistance line price will be going down. This could be great trade opportunity for next week. We are opening short positions putting our SL tight, right over the resistance line.

CAD/CHF : Buy Trade SetupFormed a Bullflag after complete engulfing candlestick
Watch Price and Buy.
ThankYou

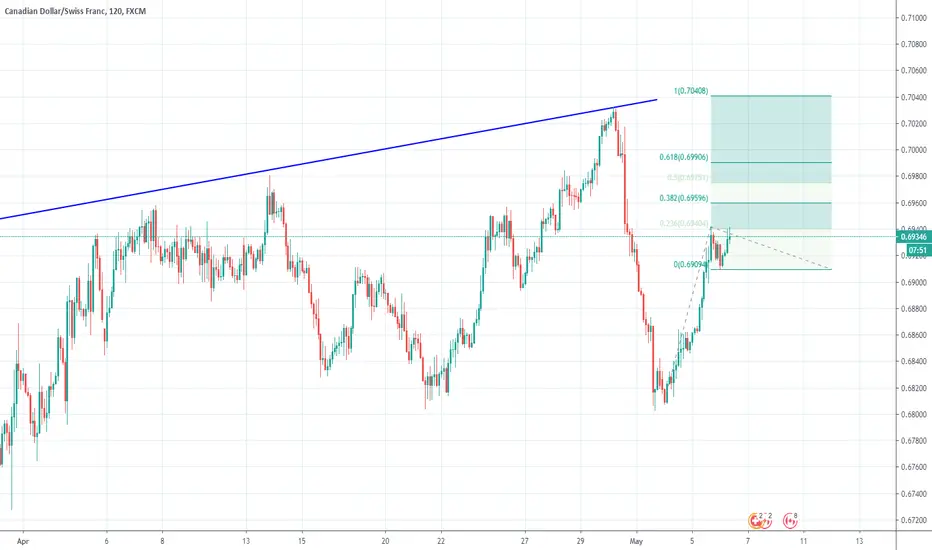
CADCHF could be seeing a drop from here | 8 May 2020Price is testing resistance in line with our 78.6% fibonacci retracemenet and 78.6% fibonacci extension where we could see a reversal to our take profit level. Attached is the written version, do check that out as well and leave a comment on which currency pair you would like to see next. Cheers!

CADCHF hitIf you entered on the pullback call you should be up good right now... might add a position if price pulls back again

CAD/CHF : Wait for complete flag and Go SHORT We can see continue downfall after Complete bearFlag.
ThankYou

CADCHF continuation to top RES line (Mid-Term)could see FX:CADCHF trade up towards 61.8%
UPDATES to follow
CADCHF LongI see a nice pull back setting up for a continuation for the general trend...not sure how deep the pullback maybe

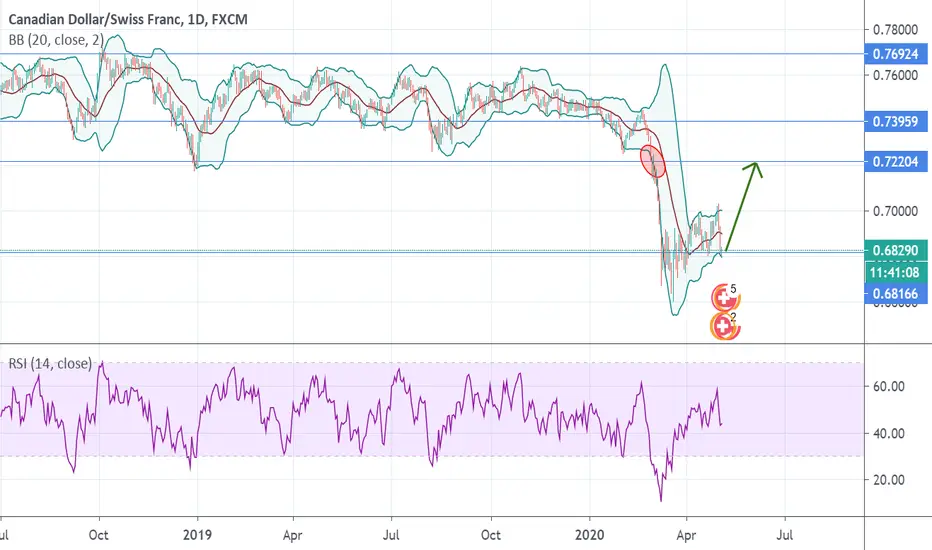
CADCHF LongMy favorite formation came to success AGAIN.
1) Price bouncing on the daily support level
2) Price is also bouncing on the lower side of the daily uptrend channel
3) Oversell confirmation by RSI
4) Proper candlestick formation triggering the trade.
Easy Simple, and 1:1:5 R2R.


CADCHF third attempt.Hopefully now this pair will shoot up where it is supposed to as it tried to reach the target twice and kept coming back to the previous low before going up. Support tested three times so should be a good buy.

Doomsday Over For CADCHF!!! Going back up to where it belongs!!!If we observe CADCHF, 0.7220 price level was once a strong support level with a strong resistance at 0.7692 price level. We could see many price movement within this 2 price level with the support and resistance holding this price level very strongly. However, we could see that 0.7220 price level was eventually broken turning the price level to a strong resistance level. What we should be looking at for now is a bullish movement back up to retest that level. If manage to break that resistance level with a clean breakthrough the price level will be back to where it belong, However, we see a rejection at that level we could see this price dropping back to the support level or even futher. I will update again when we are near that level.
If you do like my idea, do drop a thumbs up and comment what you feel about this pair below. For more analysis and updates, feel free to drop me a follow and you will not miss any updates and analysis from me again. Thanks for the support.
CADCHF===Market outlook and forecasting Hy! Smart Trader, Welcome to My Analysis and forecasting Section on Trading view.
We are Creative price action Trader. Join with us as we document the in's and out's of my trading journey. we are publish Multiple Time frame Analysis and forecasting (totally Free)
Never Trade alone
we really hope you enjoy All trade..
Disclaimer:
the content on this analysis is subject to change at any time without notice, and is provided for the sole purpose of assisting traders to make independent investment decisions.
_______________________________________________________________________________________________
Thank you for your support!
CANADIAN DOLLAR / SWISS FRANC (CADCHF) Monthly, Weekly, DailyDates in the future with the greatest probability for a price high or price low.
The Djinn Predictive Indicators are simple mathematical equations. Once an equation is given to Siri the algorithm provides the future price swing date. Djinn Indicators work on all charts, for any asset category and in all time frames. Occasionally a Djinn Predictive Indicator will miss its prediction date by one candlestick. If multiple Djinn prediction dates are missed and are plowed through by same color Henikin Ashi candles the asset is being "reset". The "reset" is complete when Henikin Ashi candles are back in sync with Djinn price high or low prediction dates.
One way the Djinn Indicator is used to enter and exit trades:
For best results trade in the direction of the trend.
The Linear Regression channel is used to determine trend direction. The Linear Regression is set at 2 -2 30.
When a green Henikin Ashi candle intersects with the linear regression upper deviation line (green line) and both indicators intersect with a Djinn prediction date a sell is triggered.
When a red Henikin Ashi candle intersects with the linear regression lower deviation line (red line) and both indicators intersect with a Djinn prediction date a buy is triggered.
This trading strategy works on daily, weekly and Monthly Djinn Predictive charts.
Trades made when the monthly, weekly and daily arrows are pointing in the same direction are the most profitable.
This is not trading advice. Trade at your own risk.

Time for a longProfit taken on my recent short, now in for a long as the structure has finished making the higher low

CADCHF LONGRejection of ascending trendline and 0.5 FIB.
Also rejected 50MA on the 1 hour. Nice small stop loss for this one with an open TP.


CADCHF LongA classic breakout trade in the daily uptrend (4h trend has been terminated). Will wait for the price pullback, along with bullish candle formation engulfing the previous bearish candle to signify the reversal and will jump to a 1:1 R2R trade.


