Cadchfsetup

CADCHF TO THE MOON PROBABLYCADCHF is in an upward trend, as it was in a short retesting phase and breaks its retesting phase, it is now going to touch its highs.

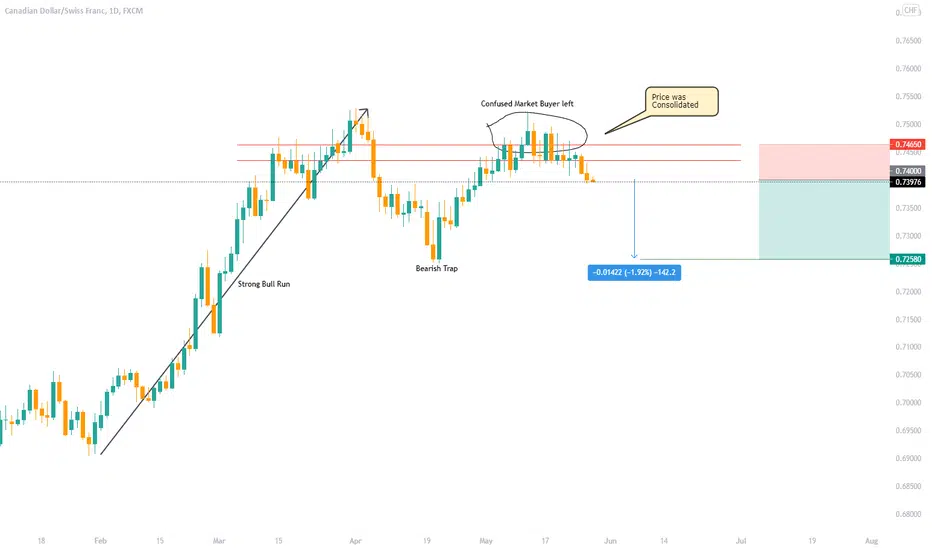
CADCHF Expecting ShortCADCHF currently breaks out its recent higher high on the D1 chart, and the market already consolidated many times and created a resistance level. I'm expecting a short for the upcoming days.
CAD/CHF Running In 90Pips Profits ,The Next Movement ExplainedThis is an educational + analytic content that will teach why and how to enter a trade
Make sure you watch the price action closely in each analysis as this is a very important part of our method
Disclaimer : this analysis can change at anytime without notice and it is only for the purpose of assisting traders to make independent investments decisions

CADCHF: short opportunity on 4hHi Traders,
This is my view on this pair for the next few days.
#CADCHF
SELL 0.7427
SL 0.74570
TP 0.73
I remind you that this is only a forecast based on what current data are.
Therefore the following signal will be activated only if specific rules are strictly respected.
If you follow my strategy you will be able to identify the right filters and triggers to enter correctly the market and avoid fake signals.
I really hope you liked this video and I would like to know what do you think about this analysis, so please use the comment section below this video to give me your point of view.
Thank You
———————————
Pietro from Trading Kitchen


CAD/CHF Running In 65 Pips Profits , Is It Will Continue ?This is an educational + analytic content that will teach why and how to enter a trade
Make sure you watch the price action closely in each analysis as this is a very important part of our method
Disclaimer : this analysis can change at anytime without notice and it is only for the purpose of assisting traders to make independent investments decisions

CAD/CHF New Long Setup Available To Catch 150 Pips This is an educational + analytic content that will teach why and how to enter a trade
Make sure you watch the price action closely in each analysis as this is a very important part of our method
Disclaimer : this analysis can change at anytime without notice and it is only for the purpose of assisting traders to make independent investments decisions

CADCHF Strong SHORT 📉What I see in this pair is quite nice and as clear as possible, as you see in the chart,
Blue area you see just above the price is strong supply which price reacted to it perfectly, you can see they pushed price lower and lower after reaching to its strong supply,
Price were moving in strong uptrend channel , which 2 weeks ago that channel were broken to down, now we reached again broken point of channel , we consider it as a strong resistance. if price break this resistance we see it higher and higher, but for now we have all confirmations for sell as long as price is bellow 0.7380 ,
we have strong support just bellow price we use them as our 1st and 2nd TP .
Any more info Comment or DM
as always more than welcome to answer your questions
1:4 R:R LOVELY 👌🏻✅
GOODLUCK Everyone!!!
FxShzd ✅📈📉✅

CAD/CHF Trying To Make Inverted Head&Shoulders ,Long Setup HereThis is an educational + analytic content that will teach why and how to enter a trade
Make sure you watch the price action closely in each analysis as this is a very important part of our method
Disclaimer : this analysis can change at anytime without notice and it is only for the purpose of assisting traders to make independent investments decisions

CAD/CHF Trying To Make A New Leg And Short Setup Avialbe This is an educational + analytic content that will teach why and how to enter a trade
Make sure you watch the price action closely in each analysis as this is a very important part of our method
Disclaimer : this analysis can change at anytime without notice and it is only for the purpose of assisting traders to make independent investments decisions


CAD/CHF Did What Should To Do Exactly This is an educational + analytic content that will teach why and how to enter a trade
Make sure you watch the price action closely in each analysis as this is a very important part of our method
Disclaimer : this analysis can change at anytime without notice and it is only for the purpose of assisting traders to make independent investments decisions

CAD/CHF Trying To Break Very Important Res Area !This is an educational + analytic content that will teach why and how to enter a trade
Make sure you watch the price action closely in each analysis as this is a very important part of our method
Disclaimer : this analysis can change at anytime without notice and it is only for the purpose of assisting traders to make independent investments decisions


CADCHF: SELL NOWCADCHF time to short
Risk Reward Ratio 1:2 / 1:3
GOOD LUCK
If you have any idea, Write down on the comment.
If you agree, do not forget to like this idea

CAD/CHF 2 Entries To Catch 200 Pips This is an educational + analytic content that will teach why and how to enter a trade
Make sure you watch the price action closely in each analysis as this is a very important part of our method
Disclaimer : this analysis can change at anytime without notice and it is only for the purpose of assisting traders to make independent investments decisions

Possible Bullish Breakout on CAD/CHF Hi Traders
CAD/CHF (H4 Timeframe)
A high probability, to go LONG is forming @ 0.74762 after the market found support @ 0.74069. Only the downward break of 0.74069 would cancel this bullish scenario.
Trade details
Entry: 0.74762
Stop loss: 0.74069
Take profit 1: 0.75127
Take profit 2: 0.75780
Take profit 3: 0.76845
Score: 10
Strategy: Bullish Breakout

CAD/CHF New Entry To Catch 250 PipsThis is an educational + analytic content that will teach why and how to enter a trade
Make sure you watch the price action closely in each analysis as this is a very important part of our method
Disclaimer : this analysis can change at anytime without notice and it is only for the purpose of assisting traders to make independent investments decisions

CADCHF - SHORT; Get ready to dump this one hard!!"Commodity Super-cycle" = Inflation = Tooth Fairy.
SHORT it hard 0.7320-0.7350
The Daily;

CAD/CHF New Analysis And 2 Entries To Catch More Than 200 Pips This is an educational + analytic content that will teach why and how to enter a trade
Make sure you watch the price action closely in each analysis as this is a very important part of our method
Disclaimer : this analysis can change at anytime without notice and it is only for the purpose of assisting traders to make independent investments decisions


CAD/CHF Multi-Timeframe analysisHi Traders
CAD/CHF Multi-Timeframe analysis
H1 CHART ( BULLISH )
A very high probability, entry signal to go LONG was given at 0.71104 after the market found support at 0.70829 . Only the downward break of 0.70829 would cancel the bullish scenario.
Support & Resistances
0.70789 0.71094
0.70455 0.71331
0.70165 0.71621
H4 CHART ( BULLISH )
A very high probability, entry signal to go LONG was given at 0.71104 after the market found support at 0.70829 . Only the downward break of 0.70829 would cancel the bullish scenario.
Support & Resistances
0.70789 0.71094
0.70455 0.71331
0.70293 0.71621
DAILY CHART ( BULLISH )
A medium probability, entry signal to go LONG was given at 0.70611 after the market broke the resistance level at 0.70611 .
Support & Resistances
0.70224 0.70550
0.69035 0.71444
0.68610 0.72959
WEEKLY CHART ( BULLISH )
Waiting for a retracement lower towards the 0.70070 support level, in order to reinstate LONG positions. Next important support is the 0.68165 level.
Support & Resistances
0.70070 0.71194
0.68165 0.72008
0.67449 0.72512
