Cadchfshort

CADCHF 0.72 Zone Four Year Critical Area Of Interest 0.72 zone marks an important area where CADCHF is current market. This could be shorted with tight stop loss and possibly low drawdown

Take a short position on CADCHF 4HAs you can see, price is going up in parallel channel. Price has reached to it's high level and need to get a bit rest for next movements. So I expect to see a bit decrease within the channel and almost 150 pips profit is possible.

CADCHF - Beautiful SHORT set up - DO NOT MISSThis week I am looking for CAD weakness and just so happens that CADCHF is in the perfect area to short. It's currently rejecting the channel resistance and the 786 fib.
Risk Entry: Short now and stops above the channel
Safe entry: Wait for break of the trendline and zone marked and await retest
Do make sure to leave a comment and a thumbs up if you agree! Trade safe.


CADCHF Daily Long, Algo TradingCADCHF Daily longs. Trade was transferred from MT4 > Tradingview, all indicators aren't present. Keltner + bolly bands = trending, momentum = up, Means the pair is trending.
Volume isn't fully present to enter full risk position (fill 2%, enter with .05%)
QQE signals long
Strength is Long
Pair is Trending.

CADCHF - SELL SELL BIAS
Price has approached a triple top zone, need to wait for an LTF correction as drawn-out before entering a sell trade

CADCHF analysisThe price came to our key level!
These are reason i'd go short:
1)RSI divergence + overbought zone
2)The price broke through our trendline and it may retest it
3)Selling pressure around our key level
4)Impulse move on the 4h chart

CADCHF Price at Resistance CADCHF price made clear breakout above the resistance and now retesting the resistance.
CADCHF trade looks more fishy here with pin bad candle at resistance need clear breakout here upside or down side.

CADCHFIf you find this helpful and want more FREE forecasts in TradingView
. . . . . Please show your support back,
. . . . . . . . Hit the 👍 LIKE button,
. . . . . . . . . . Drop some feedback below in the comment!
❤️ Your Support is very much 🙏 appreciated!❤️
💎 Want us to help you become a better Forex trader?
Now, It's your turn!
Be sure to leave a comment let us know how you see this opportunity and forecast

CAD/CHF all the way down🧙🏻♂️The pair has retraced the upper boundary of the uptrending channel with a strong bearish candle. From this area we are opening short positions and aiming for the lower boundary of the channel🙌🏻

CADCHF shortPrice at daily resistance and price is over extended to the upside. A short position was taking looking to target .382 of the fib retracement tool


CADCHF - ShortAs the CAD deals with the BoC interest rate decision, traders can look to continue to sell the Loonie.
What we need is price to break 0.69400 on the 4hr, retest this level and reject, to continue its path lower.
We will be giving this setup a look on Monday morning during our live trading session.
- RP Forex (Price Action Analyst)

CADCHF looking to go shortThe importance of the area around 0.70225 is evident.
It has held this pair several times in the recent past and I am looking to go short.
If you like my analysis please give it a “thumbs up” and follow me to get immediate notifications.
As always, please use sound money and risk management in all your trades.

Bearish Alt Bat, Wave Correction CADCHF BEARISH ALT BAT, WAVE CORRECTION
Market Sell Order Set Up.
Sell Entry: (0.70171)
Min Take-Profit: (0.69754)
Max Take-Profit: (0.69489)
Stop-Loss: (0.70581)
Max Risk-Reward: (1.66)
Smash a Like button and leave a Comment, I appreciate every support. Goodluck.

CADCHF Short (Sell) Trade SetupPrice is currently reacting from a zone of interest and we may get a bearish engulfing candlestick close on the open of the London session.

Bearish Bat PatternCADCHF BEARISH BAT PATTERN
Market Sell Order Set Up.
Sell Entry: (0.69862)
Min Take-Profit: (0.69554)
Max Take-Profit: (0.69362)
Stop-Loss: (0.70186)
Max Risk-Reward: (1.54)
Smash a Like button and leave a Comment, I appreciate every support. Goodluck.

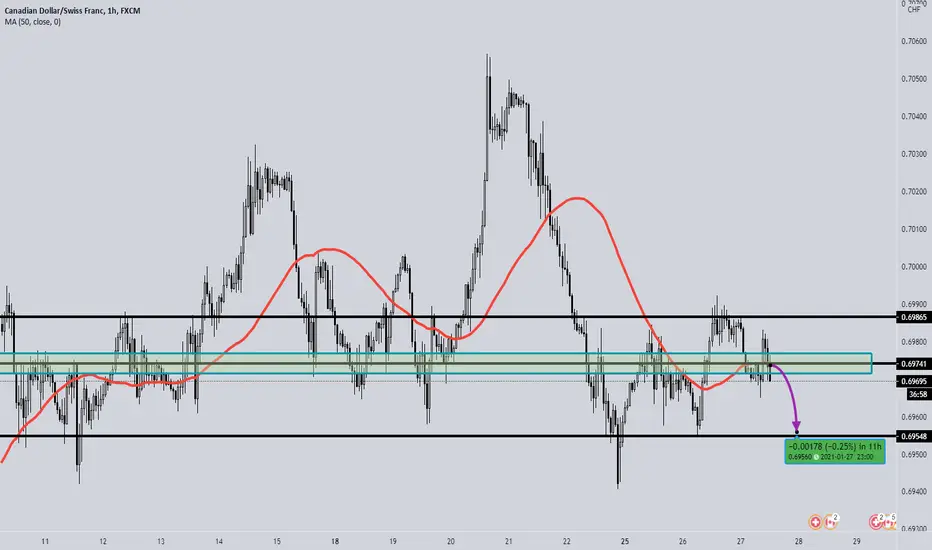
CADCHF - Bearish BiasCAD - BEARISH
1️⃣ investors digest prospects of further economic stimulus in the US, lower oil prices and concerns over rising coronavirus infections and the economic impact of lockdowns around the world.
CHF - BULLISH
1️⃣ Fading hopes for rapid approval of the long-awaited US economic stimulus plan comes amid growing market worries about the potential economic fallout from the continuous surge in coronavirus cases.
2️⃣ Escalating US-China tensions in the South China Sea, further weighed on investors' sentiment and dampened the market mood.
=====
Technical
=====
We are selling the CADCHF at resistance + below SMA 50 on the H1 chart.
CADCHF: A SHORT term opportunity on this PULLBACK!Hi traders and welcome to my channel, if you enjoy my FREE Technical Analysis 📈 and Trading Tips 📉, support the idea hitting the LIKE 👍 button and don't forget to SUBSCRIBE ✔️ my channel, you won't miss anything !
🟢 Forex Pair :
CAD/CHF
⚪ Technical Analysis :
In the weekly time frame, since the end of March 2020, the price has been moving creating an interesting ascending triangle pattern, bouncing on its dynamic support line in July, October 2020 and also in January 2021.
In the daily time frame, the price clearly got many rejections on a strong resistance zone at about 0.70400 and it's now moving in the opposite direction, with a possibility to see the price retesting the main weekly trendline.
In the h4 time frame, since the end of December 2020, the price has been following a strong ascending channel and it broke it on the 22th of January.
It has currently broken a daily S/R level at about 0.69650 and the next price action will be essential to understand the next market movement.
🔴 Conclusion :
In a long term I definitely want to see the price growing more but I'm confident to see it collapsing down until to retest the main trendline.
I'll be waiting for a pullback on the S/R level at about 0.69750 before getting a short position on this trade.
Stay tuned for Updates and Trading Signals !
What's your opinion? Share your idea writing a comment!
⚠️ Please note the views are not investment advice and should be used only for educational purposes ⚠️
Trade Safe and Responsibly ,
Gianni

Bearish Shark PatternCADCHF BEARISH SHARK PATTERN
Market Sell Order Set Up.
Sell Entry: (0.70489)
Min Take-Profit: (0.70213)
Max Take-Profit: (0.69996)
Stop-Loss: (0.70764)
Max Risk-Reward: (1.79)
Smash a Like button and leave a Comment, I appreciate every support. Goodluck.

CAD/CHF SHORT SETUPfter nearly 6 months of consolidation, we saw the bottom fakeout and the begining of the rising up of the Canadian currency. At the 66.7% fibo level, we saw the beginning of the start movement and the creating formation of the HnS pattern. At the moment, we expect a retest of the neckline and another drop down. If the market does not negate the pattern, we expect further reactions in the 50-66.7% fibo zone and a correction that will probably break out the imbalances that occurred around the neckline. The continuation of the movement is expected to the 1.61% level of fibo expansion, which at the same time may complete another HnS pattern in D1 tf, which will probably start of full trend reversing
The yellow fields are the supply / demand zones. The places marked in red are the most important zones where fibo, s / d, s / r pivots clusters overlap. Note that moving avarages in chart works as support / resistance .
It is also worth taking a look at the strong reaction at the fibo levels of 55.9% and 61.8 (excluded) -66.7% fibo+Elliot Waves
Warning! Im using different settings of cloud
If you want to know more about the strength teamt and the precise direction of the trend and reaction to the zones, I recommend that you start using Heikin Ashi and Renko candles
If u have any questions ur always welcome to write amilerski@icloud.com
~~~Remember that the above analysis is only an idea :) You are responsible for your money yourself.~~~~
The market will verify! Bless!

