NZDCAD:🟢Buy Opportunity🟢
As you can see, the price swept the liquidity below the previous day's low and shifted the market structure.
Now we can expect that the price move lower to collect the inducement and then move higher.
We can define buy-side liquidity as the first target and the previous day's high as our final target.
Please pay attention: We need LTF confirmation in this scenario.
💡Wait for the update!
🗓️27/03/2024
🔎 DYOR
💌It is my honor to share your comments with me💌
Caddollar

USDCAD WEEKLY ANALYSIS Hello, traders here is an analysis of USDCAD as you can see the market has been neutral for the past weeks and months and now I am waiting for the market to decide on which direction it chooses. I have two decisions first, if the market decides to go up I will wait for It to break the resistance zone then retest it then I will look for buying opportunities, Second If the market chooses to go down I will wait for it to break the support zone then retest it then I will look for selling opportunities.

Canadian Dollar - CAD - pairs(This post is to be a collection place/"container" for all CAD - Canadian Dollar - and related pairs.
-------------------------------------------------------------------------------------------------------------------
After weeks of consolidation near the bottom of a rising, long-term, weekly price trend channel, the USDCAD looks to be poised for a near-term, +500 pt topside breakout, toward visible targets around the 1.3650s level.
The well-formed, large bullish Wedge further suggests a potentially swift, upward price move.
The USDCAD Daily;

EURCAD: Support breakout, continuation following retest?We can see that EURCAD has been on a downtrend since the last week of August.
With Oil prices rising I think the fundamentals for the Canadian Dollar continue to look good, the EURO on the other hand doesn't have much going for it.
I have noted a break through support and looking for a short any time soon, there's minor support at 1.402 which will be my target, however I think this won't put up too much of a fight and we'll be down around 1.375 soon.

GBPCAD MASSIVE BEARISH MOVE TO 1.40500GBPCAD have been on a bullish move since last year, and currently is on a bullish continuation pattern, which indicates that price might go bullish for a while again.
Now let's have a strong look to the long wick we can see below, that's huge liquidity and is expected to be taken. So how do price get to that zone?
It first have to go bullish and hit the resistance zone or the point of 1.68400 before it sells massively, we still have time for that to happen. I will keep you updated on this.
Meanwhile, i will love the support I have been having, I appreciate a lot.
For me to feel more happy a share and a follow will be appreciated.
Have a nice week.
Thank you.

LONG GBPCAD on Daily ChartThe tradeWELL FX algo printed an entry-with-trigger on long GBPCAD on 08/01 with entry between 1.56667 and 1.56917. Initial target at 1.59838 with stop at 1.53496 trailing. I actually entered late and into the 1.575 resistance. Recent price action forming what appears to be a cup-and-handle with fairly distinct rounded bottom.
Counter-trend trade, so precarious.

CADUSDhello guys, the targets are:
1- 0.83$
2- 0.9$
3- 0.97$
.
.
.
.
.
and the stoploss is 0.76$
I hope you enjoy.

Higher oil stronger CADUsdCad is expected to fall due to higher oil price. CanadianDollar strengthening.

EUR/CAD DAILY CHARTIf we see oil breakdown further we could expect eur/cad to make new highs, as usd is weak, euro will be stronger. backing fundamentally this technical set up.


UsdCad on 45m(Sell)UsdCad is seen following the bullish trendline respectively. However now seen retracting on top trendline for a good sell back to bottom trendline ,..Then wait for reversals before buying back upto 1.32600. As long as no break of trendlines follow analyses respectively, Please comment and share your ideas on this particular pair too. thanks!

CAD getting strong - Daily OBV for the yearLooking for that break above the red ribbons.
200 MA broke
33 MA above
Currently pinching for direction on daily but long term looks like up via technical data.

USDCAD H4Price has reached weekly support level, along with the bottom of the big picture triangle pattern. Price is rejecting off this level again & looks like buyers are about ready to push price back higher from off this support level once again.

EURCAD Buy setupEurcad has a nice upside move to it. We have an impulsive move and corrected back to the bottom. I expect another wave back up to 1.49 zone and/or farther.

CADCHFI am eyeing USDCAD to sell again... (Will wait for a continuation signal before I enter)
Currently in a buy from the bottom daily on cadchf.
TP around 78.50
SL below Aug 15th daily low by 25 pips or so...
Please trade with risk management as always. Ideas are Ideas not truths...keep your probabilities within range and dont overleverage. 90% of my trades work out in our favor...it is the ones trying to chase the money who lose! Let the market come to us as I always like to say :)

CAD may strenghten...D1
-->> pullback to support
--->> a break below the cloud invalidate buying CAD

Simple Sell setupPrice has impulsed down twice on daily. We are looking for a 3rd drop since price has retested 1.35 zone and failed to hold. There is strong resistance on the hourly and lower frames with a consolidated sell flag accumulating as well for a trend continuation. I am looking a nice pullback up and a solid fail around 1.33 to enter short.

CADUSD broke out the triangle but a strong resistance aheadThe price action was moving within a symmetrical triangle and after hitting the support it made double bottom at the support of triangle.
In the meanwhile the price line had also completed the formation of gartley and entered in potential reversal zone moreover the volume profile is also showing a very low interest of people to trade below that area.
The double bottom formation and potential reversal zone of gartley and low interest of people as per volume profile produced a powerful bull thrust so the price action broke out the resistance of the triangle.
Now the price action is moving up the trader's interest is too high between 0.382 to 0.618 fibonacci (upto $78.50), and above @78.50 can be a strong sell area coz.
The pivot resistance is above the strong sell area.
And we have a pivot point beneath the price action which can pull down the price action after hitting the area between 0.382 to 0.618 fibonacci of A to D leg of gartley.
But the final decision can be made when the price action will be entered in 0.382 to 0.618 fibonacci after that we need to see the movement of price action and all indicators if they will give bearish signals then we can sell.
Regards,
Atif Akbar (moon333)

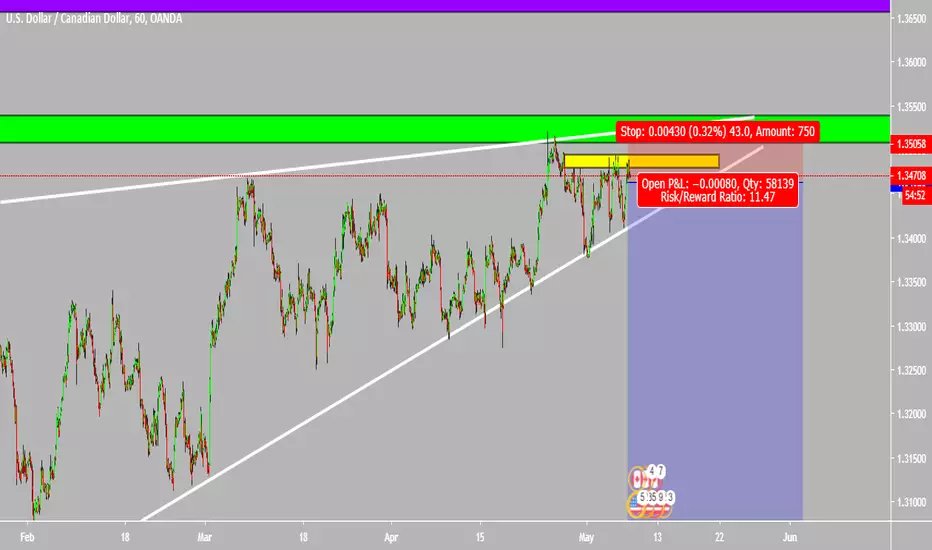
7th of may usd/cad bearish setup.USD/CAD has reached daily resistance zone (green). Price went on to make a rising wedge after with a retracement of 0.7 from previous HIGH at weekly resistance level (purple).
Price than consolidated for a bit ranging between 1.347 to 1.340 with price creating a new 4hr resistance zone (yellow).
USDCAD H4Inverse Head on shoulders formation forming, along with price breaking the counter trendline along with resistance. Watching for price to pullback & retest broken structure as new support, along with a retest of the broken descending trendline for price to create a new higher high.

USDCAD H2 Double top, & price has made a bearish engulfing breakout back below support zone. Will be looking at price to make its way back to daily support from here..


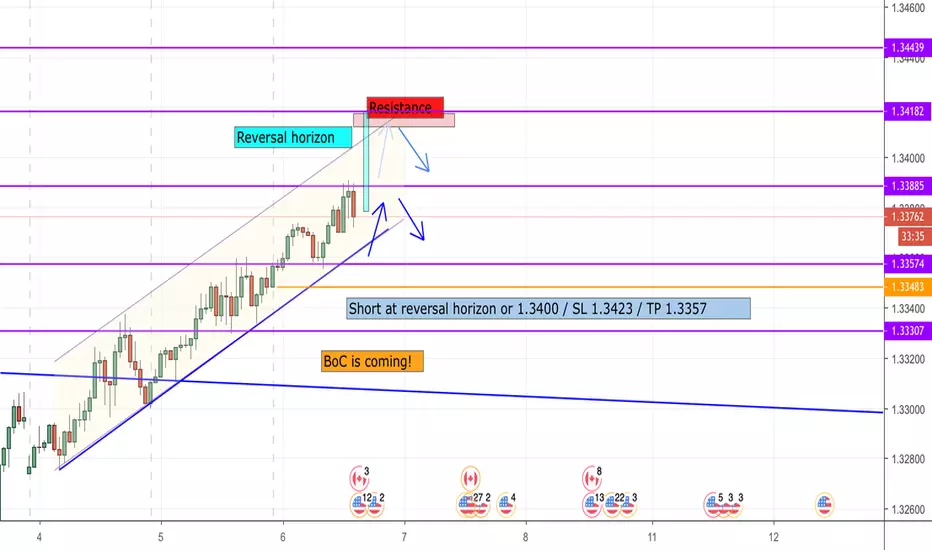
0306-USDCAD
USDCAD
BoC is ready to release the interest rate decision and projection of future economic condition.
USDCAD is obviously in uptrend channel, but it may have correction after BoC announcement, due to 1.3388~1.34 are relative resistance area that CAD may have momentum to pullback, in addition, DXY doesn't seem well after US trade balance data release.
So, in my opinion, better consider short USDCAD after BoC announcement.
Support: 1.3331 / 1.3357
Resistance: 1.3388 / 1.3418
Like if you trade, make Ideas or comments with me :D