CADJPY - 1H - LONG POSITION - SUPPORT & RESISTANCEIn this chart, we draw support & resistance lines and it clearly shows us it will bounce back from S1 and go upwards
so we trigger buy limit at the entry price of S1 and SL is S3 and take profit is R1
CADJPY

CADJPY 15m 1h LongIn CADJPY chart we have several items that show us price can goes up and this is a good position for Long . all of things are clear on the chart .
I will open a position at this area and will take a good profit in upper band of channel .

CADJPY Pair : CADJPY ( Canadian Dollar / Japanese Yen )
Description :
Break of Structure
Rising Wedge as an Corrective Pattern in Short Time Frame
Completed " 12345 " Impulsive Waves
RSI - Divergence

CADJPY Will Fall! Short!
Please, check our technical outlook for CADJPY.
Time Frame: 6h
Current Trend: Bearish
Sentiment: Overbought (based on 7-period RSI)
Forecast: Bearish
The market is testing a major horizontal structure 111.409.
Taking into consideration the structure & trend analysis, I believe that the market will reach 110.837 level soon.
P.S
We determine oversold/overbought condition with RSI indicator.
When it drops below 30 - the market is considered to be oversold.
When it bounces above 70 - the market is considered to be overbought.
Like and subscribe and comment my ideas if you enjoy them!

Capitalizing on CAD/JPY: Seizing Selling Opportunities Amid ExteHey traders,
Let's talk about CAD/JPY and the lucrative selling opportunities it presents amidst changing external liquidity conditions.
With two significant liquidity takeouts, the market is signaling potential turbulence. It's a critical time to adapt your strategy and capitalize on selling opportunities.
Utilizing the SIBI analysis:
Strength: Evaluate the strength of CAD and JPY individually, looking at economic data and market sentiment.
Interest: Assess market interest in CAD/JPY through trading volumes and sentiment indicators.
Balance: Gauge the balance between supply and demand, watching key levels and chart patterns.
Imbalance: Identify any market imbalances that could favor selling, such as overbought conditions or divergences.
If you're eyeing a sell position, wait for confirmation signals that align with your strategy. Manage your risk diligently and stay disciplined.
Remember, trading carries risk. This analysis serves for informational purposes only. Good luck out there!

Cadjpy Short Analysis Or Chart As of now, it may touch back the upper level a bit. then
It will come back after touching a resistance which you can see on this 4 hour chart.
If we talk about the weekly trend, then the weekly trend will also go down with strong formations and it includes strong candle formations.
you Can sell it from 111.75-111.85 Area and you can use Stop loss 112.55
First Target of this trade is 110.55 and for second Target you can Hold it for 109.50 Level

CAD-JPY Will Grow! Buy!
Hello,Traders!
CAD-JPY keeps going up
So we are bullish biased
And after the pair retests
A rising support we will
Be expecting a further
Move up
Buy!
Like, comment and subscribe to help us grow!
Check out other forecasts below too!

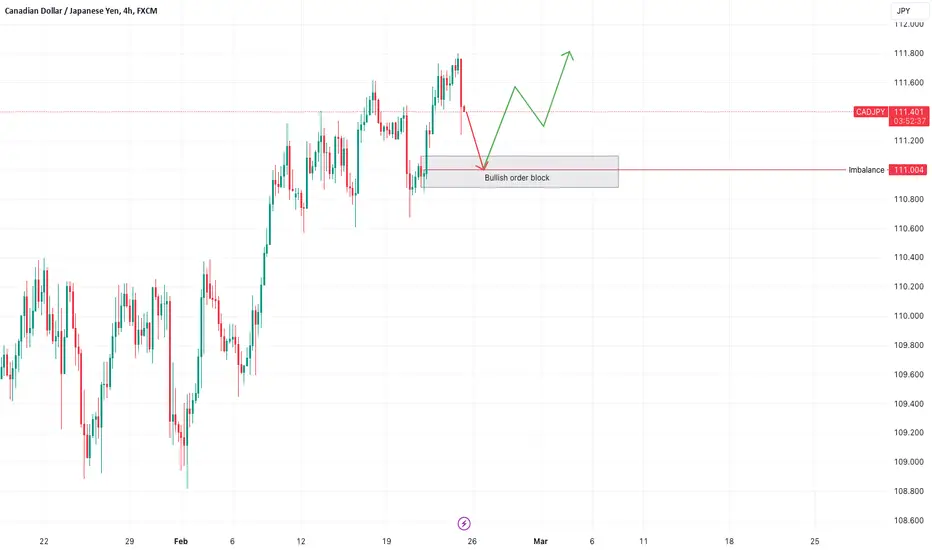
CADJPY - Potential long ✅Hello traders!
‼️ This is my perspective on CADJPY.
Technical analysis: Here we are in a bullish market structure from 4H timeframe perspective, so I am looking for a long. I wait price to continue the retracement to fill the imbalance lower and then to reject from bullish order block + institutional big figure 111.000.
Like, comment and subscribe to be in touch with my content!
✅CAD_JPY WILL KEEP GROWING|LONG🚀
✅CAD_JPY is trading in an uptrend
Along the rising support line
Which makes me bullish biased
And the pair is about to retest the rising support
Thus, a rebound and a move up is expected
With the target of retesting the level above at 111.862
LONG🚀
✅Like and subscribe to never miss a new idea!✅

CADJPY SELL | Day Trading AnalysisHello Traders, here is the full analysis.
I think we can soon see more fall from this range! GOOD LUCK! Great SELL opportunity CADJPY
I still did my best and this is the most likely count for me at the moment.
Support the idea with like and follow my profile TO SEE MORE.
Traders, if you liked this idea or if you have your own opinion about it, write in the comments. I will be glad 🤝
Patience is the If You Have Any Question, Feel Free To Ask 🤗
Just follow chart with idea and analysis and when you are ready come in THE GROVE | VIP GROUP, earn more and safe, wait for the signal at the right moment and make money with us💰

CADJPY Massive Short! SELL!
My dear friends,
CADJPY looks like it will make a good move, and here are the details:
The market is trading on 111.54 pivot level.
Bias - Bearish
Technical Indicators: Supper Trend generates a clear short signal while Pivot Point HL is currently determining the overall Bearish trend of the market.
Goal - 110.93
About Used Indicators:
Pivot points are a great way to identify areas of support and resistance, but they work best when combined with other kinds of technical analysis
———————————
WISH YOU ALL LUCK

CADJPY: Bullish Trend Continues 🇨🇦🇯🇵
CADJPY is trading in a long term bullish trend.
After an extended correction, the market resumed growth
and set a new higher high higher close on a daily, violating a key horizontal resistance.
We can expect a bullish trend continuation.
Next resistance - 112.5
❤️Please, support my work with like, thank you!❤️

CADJPY H1 | Potential bearish breakout Based on the H4 chart analysis, we can see that the price is currently at our sell entry at 110.87, which is a breakout support level
Our take profit will be at 110.38, a pullback support.
The stop loss will be placed at 111.44, above a swing-high resistance
High Risk Investment Warning
Trading Forex/CFDs on margin carries a high level of risk and may not be suitable for all investors. Leverage can work against you.
Stratos Markets Limited (www.fxcm.com):
CFDs are complex instruments and come with a high risk of losing money rapidly due to leverage. 66% of retail investor accounts lose money when trading CFDs with this provider. You should consider whether you understand how CFDs work and whether you can afford to take the high risk of losing your money.
Stratos Europe Ltd, previously FXCM EU Ltd (www.fxcm.com):
CFDs are complex instruments and come with a high risk of losing money rapidly due to leverage. 70% of retail investor accounts lose money when trading CFDs with this provider. You should consider whether you understand how CFDs work and whether you can afford to take the high risk of losing your money.
Stratos Trading Pty. Limited (www.fxcm.com):
Trading FX/CFDs carries significant risks. FXCM AU (AFSL 309763), please read the Financial Services Guide, Product Disclosure Statement, Target Market Determination and Terms of Business at www.fxcm.com
Stratos Global LLC (www.fxcm.com):
Losses can exceed deposits.
Please be advised that the information presented on TradingView is provided to FXCM (‘Company’, ‘we’) by a third-party provider (‘TFA Global Pte Ltd’). Please be reminded that you are solely responsible for the trading decisions on your account. There is a very high degree of risk involved in trading. Any information and/or content is intended entirely for research, educational and informational purposes only and does not constitute investment or consultation advice or investment strategy. The information is not tailored to the investment needs of any specific person and therefore does not involve a consideration of any of the investment objectives, financial situation or needs of any viewer that may receive it. Kindly also note that past performance is not a reliable indicator of future results. Actual results may differ materially from those anticipated in forward-looking or past performance statements. We assume no liability as to the accuracy or completeness of any of the information and/or content provided herein and the Company cannot be held responsible for any omission, mistake nor for any loss or damage including without limitation to any loss of profit which may arise from reliance on any information supplied by TFA Global Pte Ltd.
The speaker(s) is neither an employee, agent nor representative of FXCM and is therefore acting independently. The opinions given are their own, constitute general market commentary, and do not constitute the opinion or advice of FXCM or any form of personal or investment advice. FXCM neither endorses nor guarantees offerings of third party speakers, nor is FXCM responsible for the content, veracity or opinions of third-party speakers, presenters or participants.

CADJPY sell setup and analysisWe have a very good setup on CADJPY with lower TF confirmations. Tight Stop loss will give you 66 Risk to Reward ratio. All my analysis can be wrong so do your own research and analysis before investing.
#cadjpy

CAD/JPY Technical Analysis and Trade IdeaMarket Observations: CAD/JPY has demonstrated a sustained bullish trend. However, the monthly timeframe indicates the pair is overextended. Furthermore, a double top pattern on the 1D chart suggests a potential retracement to the 50-61.8% Fibonacci levels. This zone could provide the necessary liquidity for major market players to accumulate long positions.
Trade Strategy:
Short Entry: Consider a counter-trend short entry at the current price level with a stop above the highs. 1:1 RR.
Buy Entry: Target a buy entry near the 61.8% Fibonacci retracement level to capitalize on potential long positions initiated by larger institutions. SL at the lows and targets as mentioned in the video.
Disclaimer: This analysis reflects my personal perspective and should not be misconstrued as financial advice. Always conduct your own thorough research and assess your risk tolerance before entering any trades.

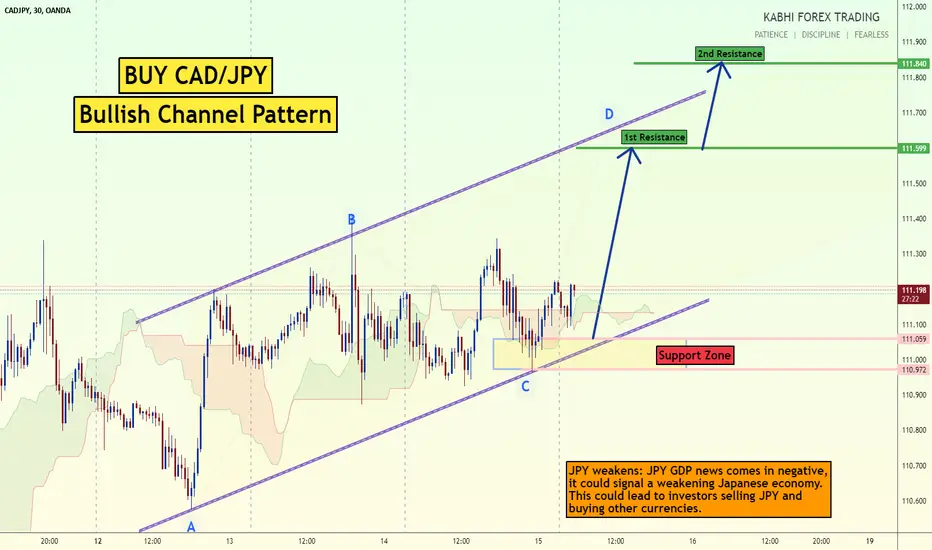
Buy CADJPY Bullish channelThe CAD/JPY pair on the M30 timeframe presents a potential buying opportunity due to a well-defined bullish channel pattern. This pattern suggests ongoing buying pressure and a higher likelihood of further advances in the coming minutes or hours.
Buy Entry: Consider entering a long position around the current price of 111.19, positioned close to the channel support. This offers an entry point near a potential continuation of the upward move.
Target Levels: Initial bullish targets lie at the resistance levels of 111.60 and 111.84, marking previous resistance zones within the channel.
Stop-Loss: To manage risk, place a stop-loss order below the support line of the channel at 110.90. This helps limit potential losses if the price reverses and breaks back down.
Thank you
CADJPY Divergence & MyFxBook Sentiment > 90% ShortCADJPY price actions shows 4H divergence with >90% bearish/short sentiment. Will it execute the bearish sentiment?
Trade Plan (Bearish Bias)
SL: Price HH
Entry: Previous HL
TP: 1:1 risk and reward + strong support level

USDCAD LONG TERM BULLISH CONTINUATION USDCAD Long term bullish continuation.
The Formation of long term yearly double bottom that was broken long ago and now the yearly candles are finishing the heavy load retesting heavy that took years to form.
And on 2024 I'm expecting USDCAD to start the long gone rally that is supposedly to finish the formation of double bottom, break and retest of it and a rally finish that finishes the pattern.

CADJPY: Bearish Divergence Warns of Trend Reversal📉 Overview:
CADJPY, previously bullish, now shows bearish divergence on the 1-hour timeframe, forming its first lower high. With a strong 90% short market sentiment, there is significant support for an anticipated bearish reversal.
📊 Technical Analysis:
Bearish divergence and the formation of a lower high suggest a potential shift from bullish to bearish.
📈 Market Sentiment:
At 90% short sentiment, substantial support for the expected bearish reversal is evident.
📉 Trade Strategy:
Consider short positions, aligning with the bearish signals, and anticipate further downward movement.
🛑 Risk Management:
Mitigate risks with effective stop-loss orders to safeguard capital.
📈 Conclusion:
CADJPY offers a concise opportunity for a bearish trend reversal, supported by bearish divergence and strong market sentiment. Monitor for confirmation and adjust positions accordingly.

CADJPY above support area, 200 pips upsideCADJPY
The price is moving in a parallel channel, and price is also above the support area, as long as price stays above the Support, I expect the price to move higher....
Trade Wisely
*The content on this analysis is subject to change at any time without notice, and is provided for the sole purpose of assisting traders to make independent investment decisions.

10 daily outlooks. D2Will analyse markets and possible entries every day for 10 days. Send your pairs or questions
☝️The main purpose of my resources is free, actionable education for anyone who wants to learn trading and improve mental and technical trading skills. Learn from hundreds of videos and the real story of a particular trader, with all the mistakes and pain on the way to consistency. I'm always glad to discuss and answer questions. 🙌
☝️ALL videos here are for sharing my experience purposes only, not financial advice, NOT A SIGNAL. YOUR TRADES ARE YOUR COMPLETE RESPONSIBILITY. Everything here should be treated as a simulated, educational environment. Important disclaimer - this idea is just a possibility and my extremely subjective opinion.

CADJPY: Bearish Continuation & Short Signal
CADJPY
- Classic bearish setup
- Our team expects bearish continuation
SUGGESTED TRADE:
Swing Trade
Short CADJPY
Entry Point - 110.80
Stop Loss - 111.12
Take Profit - 110.09
Our Risk - 1%
Start protection of your profits from lower levels
❤️ Please, support our work with like & comment! ❤️

CADJPY Massive Short! SELL!
My dear subscribers,
This is my opinion on the CADJPY next move:
The instrument tests an important psychological level 110.85
Bias - Bearish
Technical Indicators: Supper Trend gives a precise Bearish signal, while Pivot Point HL predicts price changes and potential reversals in the market.
Target - 109.85
My Stop Loss - 111.5
About Used Indicators:
On the subsequent day, trading above the pivot point is thought to indicate ongoing bullish sentiment, while trading below the pivot point indicates bearish sentiment.
———————————
WISH YOU ALL LUCK
