CAD/JPY BEARS ARE STRONG HERE|SHORT
CAD/JPY SIGNAL
Trade Direction: short
Entry Level: 103.925
Target Level: 100.915
Stop Loss: 105.911
RISK PROFILE
Risk level: medium
Suggested risk: 1%
Timeframe: 1D
Disclosure: I am part of Trade Nation's Influencer program and receive a monthly fee for using their TradingView charts in my analysis.
✅LIKE AND COMMENT MY IDEAS✅
CADJPY

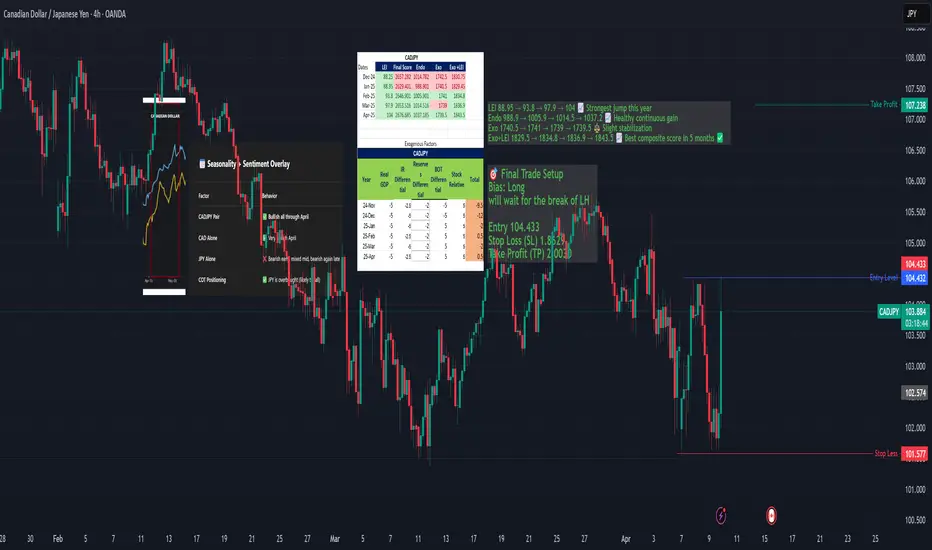
CADJPY: Bullish Setup Building — Fundamental AnalysisCADJPY is approaching a major support zone with a strong macro and seasonal backdrop favoring a bullish reversal.
Macro scores (LEI, endogenous) show consistent strength
Seasonality supports upside from late April into May
JPY is overbought per COT data
🔁 However, price structure remains bearish on 4H and Daily, so we are waiting for a confirmed CHoCH and HL before executing a swing long.
This idea is a "watch & prepare" setup — get ready to strike once structure flips.
CAD/JPY At Interesting Supp , Long Setup Valid To Get 200 Pips !Here is my Analysis On CAD/JPY , I See that the price starting giving a good bullish Price Action , So we can enter a buy trade if the price back again to my support and give us any good bullish P.A , And we can put our target at high of down trend line , and if we have a closure above we can continue .
This Is An Educational + Analytic Content That Will Teach Why And How To Enter A Trade
Make Sure You Watch The Price Action Closely In Each Analysis As This Is A Very Important Part Of Our Method
Disclaimer : This Analysis Can Change At Anytime Without Notice And It Is Only For The Purpose Of Assisting Traders To Make Independent Investments Decisions.

LONG ON CAD/JPYCAD/JPY is respecting a major demand area/zone
It has given a inverse head and shoulders in the recent pass, and now a double bottom at the same zone.
I will be buying this pair as a market order aiming for the next level of resistance/liquidity.

CADJPY: Bullish Continuation & Long Signal
CADJPY
- Classic bullish formation
- Our team expects pullback
SUGGESTED TRADE:
Swing Trade
Long CADJPY
Entry - 101.91
Sl - 101.20
Tp - 103.24
Our Risk - 1%
Start protection of your profits from lower levels
Disclosure: I am part of Trade Nation's Influencer program and receive a monthly fee for using their TradingView charts in my analysis.
❤️ Please, support our work with like & comment! ❤️

Bullish bounce?CAD/JPY is falling towards the pivot and could bounce to the 1st resistance.
Pivot: 101.88
1st Support: 101.45
1st Resistance: 102.91
Risk Warning:
Trading Forex and CFDs carries a high level of risk to your capital and you should only trade with money you can afford to lose. Trading Forex and CFDs may not be suitable for all investors, so please ensure that you fully understand the risks involved and seek independent advice if necessary.
Disclaimer:
The above opinions given constitute general market commentary, and do not constitute the opinion or advice of IC Markets or any form of personal or investment advice.
Any opinions, news, research, analyses, prices, other information, or links to third-party sites contained on this website are provided on an "as-is" basis, are intended only to be informative, is not an advice nor a recommendation, nor research, or a record of our trading prices, or an offer of, or solicitation for a transaction in any financial instrument and thus should not be treated as such. The information provided does not involve any specific investment objectives, financial situation and needs of any specific person who may receive it. Please be aware, that past performance is not a reliable indicator of future performance and/or results. Past Performance or Forward-looking scenarios based upon the reasonable beliefs of the third-party provider are not a guarantee of future performance. Actual results may differ materially from those anticipated in forward-looking or past performance statements. IC Markets makes no representation or warranty and assumes no liability as to the accuracy or completeness of the information provided, nor any loss arising from any investment based on a recommendation, forecast or any information supplied by any third-party.

WHY CADJPY IS BULLISH ?? DETAILED ANALYSIS CAD/JPY is currently trading around 104.200, forming a falling wedge pattern—a technical indicator often suggestive of a potential bullish reversal. Traders are closely monitoring this setup for a breakout, which could potentially propel the pair toward the target price of 107.000, indicating a prospective gain of approximately 300 pips.
Fundamentally, the Canadian dollar's performance is closely tied to global oil prices, given Canada's status as a major oil exporter. Recent stability in oil markets has provided underlying support to the loonie. Conversely, the Japanese yen, traditionally viewed as a safe-haven currency, has experienced fluctuations influenced by shifts in global risk sentiment and the Bank of Japan's monetary policy stance. The divergence in economic indicators and central bank policies between Canada and Japan may contribute to the anticipated bullish momentum in the CAD/JPY pair.
Technical analysis reinforces this outlook. The falling wedge pattern observed on the charts is characterized by converging trendlines sloping downward, indicating diminishing bearish momentum. A decisive breakout above the upper trendline of the wedge, accompanied by increased trading volume, would serve as a confirmation of the bullish reversal. Key resistance levels to monitor include 105.000 and 106.000, with a sustained move above these thresholds enhancing the likelihood of reaching the 107.000 target.
Traders should exercise prudent risk management strategies, such as setting appropriate stop-loss orders, to mitigate potential market volatility. Additionally, staying informed about upcoming economic data releases and central bank communications from both Canada and Japan will be crucial in navigating this trade effectively. By aligning technical insights with fundamental developments, traders can position themselves to capitalize on the potential bullish breakout in the CAD/JPY pair.

CADJPY Will Go Up! Long!
Please, check our technical outlook for CADJPY.
Time Frame: 1D
Current Trend: Bullish
Sentiment: Oversold (based on 7-period RSI)
Forecast: Bullish
The market is approaching a key horizontal level 102.695.
Considering the today's price action, probabilities will be high to see a movement to 106.707.
P.S
Please, note that an oversold/overbought condition can last for a long time, and therefore being oversold/overbought doesn't mean a price rally will come soon, or at all.
Disclosure: I am part of Trade Nation's Influencer program and receive a monthly fee for using their TradingView charts in my analysis.
Like and subscribe and comment my ideas if you enjoy them!

CAD/JPY Bearish Setup Near Resistance – Rejection Incoming?📉 Trend Analysis:
The pair is in a downtrend, confirmed by the descending trendline.
Lower highs and lower lows indicate bearish momentum.
📌 Key Levels:
Resistance Zone (104.5 - 106.0): Marked in purple, this area has previously acted as support and is now a key resistance zone.
Support Area: Around 100.0 - 101.0, a psychological level where price may find demand.
📊 Trade Scenario:
Bearish Rejection Expected: Price is approaching the resistance zone and trendline confluence. If rejection occurs, a downward move towards 100.0 is likely.
Break Above? If price breaks above the resistance zone and trendline, bullish momentum could invalidate the bearish setup.
🔍 Conclusion:
Watching for rejection near 105.0-106.0 to confirm a short opportunity.
If rejection happens, next targets are 102.0 → 100.0.
A bullish breakout above 106.0 could shift momentum upwards.

CAD/JPY "Loonie-Yen" Forex Bank Heist Plan (Day / Swing Trade)🌟Hi! Hola! Ola! Bonjour! Hallo! Marhaba!🌟
Dear Money Makers & Robbers, 🤑 💰💸✈️
Based on 🔥Thief Trading style technical and fundamental analysis🔥, here is our master plan to heist the CAD/JPY "Loonie-Yen" Forex Bank . Please adhere to the strategy I've outlined in the chart, which emphasizes long entry. Our aim is the high-risk Red Zone. Risky level, overbought market, consolidation, trend reversal, trap at the level where traders and bearish robbers are stronger. 🏆💸"Take profit and treat yourself, traders. You deserve it!💪🏆🎉
Entry 📈 : "The heist is on! Wait for the MA breakout (106.000) then make your move - Bullish profits await!"
however I advise to Place Buy stop orders above the Moving average (or) Place buy limit orders within a 15 or 30 minute timeframe most recent or swing, low or high level.
📌I strongly advise you to set an "alert (Alarm)" on your chart so you can see when the breakout entry occurs.
Stop Loss 🛑:
Thief SL placed at the recent/swing low level Using the 2H timeframe (104.500) Day / swing trade basis.
SL is based on your risk of the trade, lot size and how many multiple orders you have to take.
🏴☠️Target 🎯: 108.200 (or) Escape Before the Target
🧲Scalpers, take note 👀 : only scalp on the Long side. If you have a lot of money, you can go straight away; if not, you can join swing traders and carry out the robbery plan. Use trailing SL to safeguard your money 💰.
CAD/JPY "Loonie-Yen" Forex Bank Heist Plan (Day / Swing Trade) is currently experiencing a bullishness,., driven by several key factors.
📰🗞️Get & Read the Fundamental, Macro, COT Report, Quantitative Analysis, Sentimental Outlook, Intermarket Analysis, Future trend targets.. go ahead to check 👉👉👉🔗
⚠️Trading Alert : News Releases and Position Management 📰 🗞️ 🚫🚏
As a reminder, news releases can have a significant impact on market prices and volatility. To minimize potential losses and protect your running positions,
we recommend the following:
Avoid taking new trades during news releases
Use trailing stop-loss orders to protect your running positions and lock in profits
💖Supporting our robbery plan 💥Hit the Boost Button💥 will enable us to effortlessly make and steal money 💰💵. Boost the strength of our robbery team. Every day in this market make money with ease by using the Thief Trading Style.🏆💪🤝❤️🎉🚀
I'll see you soon with another heist plan, so stay tuned 🤑🐱👤🤗🤩

CADJPY Massive Long! BUY!
My dear followers,
This is my opinion on the CADJPY next move:
The asset is approaching an important pivot point 103.33
Bias - Bullish
Safe Stop Loss - 102.73
Technical Indicators: Supper Trend generates a clear long signal while Pivot Point HL is currently determining the overall Bullish trend of the market.
Goal - 104.29
About Used Indicators:
For more efficient signals, super-trend is used in combination with other indicators like Pivot Points.
Disclosure: I am part of Trade Nation's Influencer program and receive a monthly fee for using their TradingView charts in my analysis.
———————————
WISH YOU ALL LUCK

CADJPY Will Move Lower! Sell!
Please, check our technical outlook for CADJPY.
Time Frame: 1h
Current Trend: Bearish
Sentiment: Overbought (based on 7-period RSI)
Forecast: Bearish
The price is testing a key resistance 103.448.
Taking into consideration the current market trend & overbought RSI, chances will be high to see a bearish movement to the downside at least to 102.631 level.
P.S
The term oversold refers to a condition where an asset has traded lower in price and has the potential for a price bounce.
Overbought refers to market scenarios where the instrument is traded considerably higher than its fair value. Overvaluation is caused by market sentiments when there is positive news.
Disclosure: I am part of Trade Nation's Influencer program and receive a monthly fee for using their TradingView charts in my analysis.
Like and subscribe and comment my ideas if you enjoy them!

CAD/JPY SHORT FROM RESISTANCE
CAD/JPY SIGNAL
Trade Direction: short
Entry Level: 104.075
Target Level: 101.220
Stop Loss: 105.968
RISK PROFILE
Risk level: medium
Suggested risk: 1%
Timeframe: 1D
Disclosure: I am part of Trade Nation's Influencer program and receive a monthly fee for using their TradingView charts in my analysis.
✅LIKE AND COMMENT MY IDEAS✅

Bearish breakout?CAD/JPY is reacting off the pivot which acts as an overlap support and could drop to the 1st support which has been identified as a pullback support.
Pivot: 103.58
1st Support: 102.28
1st Resistance: 104.70
Risk Warning:
Trading Forex and CFDs carries a high level of risk to your capital and you should only trade with money you can afford to lose. Trading Forex and CFDs may not be suitable for all investors, so please ensure that you fully understand the risks involved and seek independent advice if necessary.
Disclaimer:
The above opinions given constitute general market commentary, and do not constitute the opinion or advice of IC Markets or any form of personal or investment advice.
Any opinions, news, research, analyses, prices, other information, or links to third-party sites contained on this website are provided on an "as-is" basis, are intended only to be informative, is not an advice nor a recommendation, nor research, or a record of our trading prices, or an offer of, or solicitation for a transaction in any financial instrument and thus should not be treated as such. The information provided does not involve any specific investment objectives, financial situation and needs of any specific person who may receive it. Please be aware, that past performance is not a reliable indicator of future performance and/or results. Past Performance or Forward-looking scenarios based upon the reasonable beliefs of the third-party provider are not a guarantee of future performance. Actual results may differ materially from those anticipated in forward-looking or past performance statements. IC Markets makes no representation or warranty and assumes no liability as to the accuracy or completeness of the information provided, nor any loss arising from any investment based on a recommendation, forecast or any information supplied by any third-party.

02.04.25 Morning ForecastPairs on Watch -
FX:CADJPY
A short overview of the instruments I am looking at for today, multi-timeframe analysis down to what I will be looking at for an entry. Enjoy!

Falling towards pullback support?CAD/JPY is falling towards the pivot and could bounce to the 1st resistance which is a pullback resistance.
Pivot: 104.27
1st Support: 103.54
1st Resistance: 105.58
Risk Warning:
Trading Forex and CFDs carries a high level of risk to your capital and you should only trade with money you can afford to lose. Trading Forex and CFDs may not be suitable for all investors, so please ensure that you fully understand the risks involved and seek independent advice if necessary.
Disclaimer:
The above opinions given constitute general market commentary, and do not constitute the opinion or advice of IC Markets or any form of personal or investment advice.
Any opinions, news, research, analyses, prices, other information, or links to third-party sites contained on this website are provided on an "as-is" basis, are intended only to be informative, is not an advice nor a recommendation, nor research, or a record of our trading prices, or an offer of, or solicitation for a transaction in any financial instrument and thus should not be treated as such. The information provided does not involve any specific investment objectives, financial situation and needs of any specific person who may receive it. Please be aware, that past performance is not a reliable indicator of future performance and/or results. Past Performance or Forward-looking scenarios based upon the reasonable beliefs of the third-party provider are not a guarantee of future performance. Actual results may differ materially from those anticipated in forward-looking or past performance statements. IC Markets makes no representation or warranty and assumes no liability as to the accuracy or completeness of the information provided, nor any loss arising from any investment based on a recommendation, forecast or any information supplied by any third-party.

CAD/JPY hits resistance ahead of tariffs dayThe CADJPY rebounded alongside risk assets, but its now testing key resistance at 104.50, where the recovery might falter.
This level was prior support and resistance, and where the 21-day exponential moving average comes into play.
Given an overall bearish structure, I wouldn't be surprised if the selling resumes here.
By Fawad Razaqzada, market analyst with FOREX.com

Pullback resistanceahead?CAD/JPY is rising towards the pivot which acts as a pullback resistance and could reverse to the 1st support which is a pullback support.
Pivot: 104.77
1st Support: 103.15
1st Resistance: 105.39
Risk Warning:
Trading Forex and CFDs carries a high level of risk to your capital and you should only trade with money you can afford to lose. Trading Forex and CFDs may not be suitable for all investors, so please ensure that you fully understand the risks involved and seek independent advice if necessary.
Disclaimer:
The above opinions given constitute general market commentary, and do not constitute the opinion or advice of IC Markets or any form of personal or investment advice.
Any opinions, news, research, analyses, prices, other information, or links to third-party sites contained on this website are provided on an "as-is" basis, are intended only to be informative, is not an advice nor a recommendation, nor research, or a record of our trading prices, or an offer of, or solicitation for a transaction in any financial instrument and thus should not be treated as such. The information provided does not involve any specific investment objectives, financial situation and needs of any specific person who may receive it. Please be aware, that past performance is not a reliable indicator of future performance and/or results. Past Performance or Forward-looking scenarios based upon the reasonable beliefs of the third-party provider are not a guarantee of future performance. Actual results may differ materially from those anticipated in forward-looking or past performance statements. IC Markets makes no representation or warranty and assumes no liability as to the accuracy or completeness of the information provided, nor any loss arising from any investment based on a recommendation, forecast or any information supplied by any third-party.

CADJPY Will Move Lower! Sell!
Here is our detailed technical review for CADJPY.
Time Frame: 4h
Current Trend: Bearish
Sentiment: Overbought (based on 7-period RSI)
Forecast: Bearish
The market is approaching a significant resistance area 104.000.
Due to the fact that we see a positive bearish reaction from the underlined area, I strongly believe that sellers will manage to push the price all the way down to 102.916 level.
P.S
The term oversold refers to a condition where an asset has traded lower in price and has the potential for a price bounce.
Overbought refers to market scenarios where the instrument is traded considerably higher than its fair value. Overvaluation is caused by market sentiments when there is positive news.
Disclosure: I am part of Trade Nation's Influencer program and receive a monthly fee for using their TradingView charts in my analysis.
Like and subscribe and comment my ideas if you enjoy them!

Potential bearish drop?CAD/JPY gas rejected off the pivot which is a pullback resistance and could drop to the 1st support/
Pivot: 105.18
1st Support: 101.71
1st Resistance: 107.74
Risk Warning:
Trading Forex and CFDs carries a high level of risk to your capital and you should only trade with money you can afford to lose. Trading Forex and CFDs may not be suitable for all investors, so please ensure that you fully understand the risks involved and seek independent advice if necessary.
Disclaimer:
The above opinions given constitute general market commentary, and do not constitute the opinion or advice of IC Markets or any form of personal or investment advice.
Any opinions, news, research, analyses, prices, other information, or links to third-party sites contained on this website are provided on an "as-is" basis, are intended only to be informative, is not an advice nor a recommendation, nor research, or a record of our trading prices, or an offer of, or solicitation for a transaction in any financial instrument and thus should not be treated as such. The information provided does not involve any specific investment objectives, financial situation and needs of any specific person who may receive it. Please be aware, that past performance is not a reliable indicator of future performance and/or results. Past Performance or Forward-looking scenarios based upon the reasonable beliefs of the third-party provider are not a guarantee of future performance. Actual results may differ materially from those anticipated in forward-looking or past performance statements. IC Markets makes no representation or warranty and assumes no liability as to the accuracy or completeness of the information provided, nor any loss arising from any investment based on a recommendation, forecast or any information supplied by any third-party.

CADJPYOANDA:CADJPY can go either way. It made a daily 61.8% retracement but, it's at a daily support. It price breaks below H4 support then we can sell towards 103.200 area. If price respects H4 support, then price should push towards 106.170 area.

CADJPY BUY AnalysisBuy Analysis Overview:
1. Clear Bullish Market Structure
• The chart shows a series of higher highs and higher lows, confirming bullish momentum.
• Price has broken previous resistance levels and is now using them as support (e.g., zones around 105.000 – 105.260).
2. Retest of Previous Breakout Zone
• Price recently broke above a significant resistance (now turned support) around 105.200 – 105.300.
• It’s currently retesting that area — a bullish continuation pattern if it holds.
• The current consolidation just above the support zone is a healthy sign of buyers defending the level.
3. Support from Moving Averages
• Price is sitting above both the 50 EMA (blue) and 100 EMA (black), which are also sloping upward.
• These EMAs are acting as dynamic support, further strengthening the bullish outlook.
4. Entry from Demand Zone
• The small demand zone (light blue box) around 105.200 has been tapped multiple times without being broken — showing strong buying interest.
• Ideal spot for buy entries with minimal drawdown.
5. Clear Upside Target
• If the support holds, the next bullish target is around 106.500 – 107.250.
• The top green zone (~107.259) marks a logical take profit, based on historical supply and prior swing highs.
⸻
Entry & Risk Plan:
• Entry Idea: Long around 105.200–105.300 zone (on confirmation of bullish candle or engulfing pattern)
• Stop Loss: Below 104.950 (beneath the demand zone to avoid fakeouts)
• Take Profit Zones:
• TP1: 106.500
• TP2: 107.250

CADJPY Will Fall! Short!
Take a look at our analysis for CADJPY.
Time Frame: 1D
Current Trend: Bearish
Sentiment: Overbought (based on 7-period RSI)
Forecast: Bearish
The market is on a crucial zone of supply 105.385.
Taking into consideration the current market trend & overbought RSI, chances will be high to see a bearish movement to the downside at least to 101.727 level.
P.S
We determine oversold/overbought condition with RSI indicator.
When it drops below 30 - the market is considered to be oversold.
When it bounces above 70 - the market is considered to be overbought.
Disclosure: I am part of Trade Nation's Influencer program and receive a monthly fee for using their TradingView charts in my analysis.
Like and subscribe and comment my ideas if you enjoy them!
