CADJPY SPIKEprice is in an uptrend with structure confirmation. Waiting for price to pull back into retracement levels and give confirmation signals before committing to a long position
Cadjpylong

CADJPY LONGLooking at CADJPY long. Entry at 104.901.
Trade analysis: Price broke out of 4H time frame trend line, retested, and broke above the trend line. The canadian index is currently reversing for more upside, whilst the Japanese index continues to decline. Take profits were set as to the next significant WEEKLY LINE (of resistance), given that the 'big money' (banks and hedge funds) are more concerned with higher timeframes than intraday trading and significant line often act as a magnet. If we can not break above the previous high on the 4H then trade will be closed until further notice.

Cadjpy Looking for SHORTS.....Am waiting for the breakout of the denoted level and retest for entry short .....
Targets on chart. Like & Subscribe.

CADJPY longRejection off the daily pivot with bullish engulfing on the 15, 30, and 1hr TF. Rejections also on a 4 hour support and 0.61% fib zone. Long term uptrend is respected.

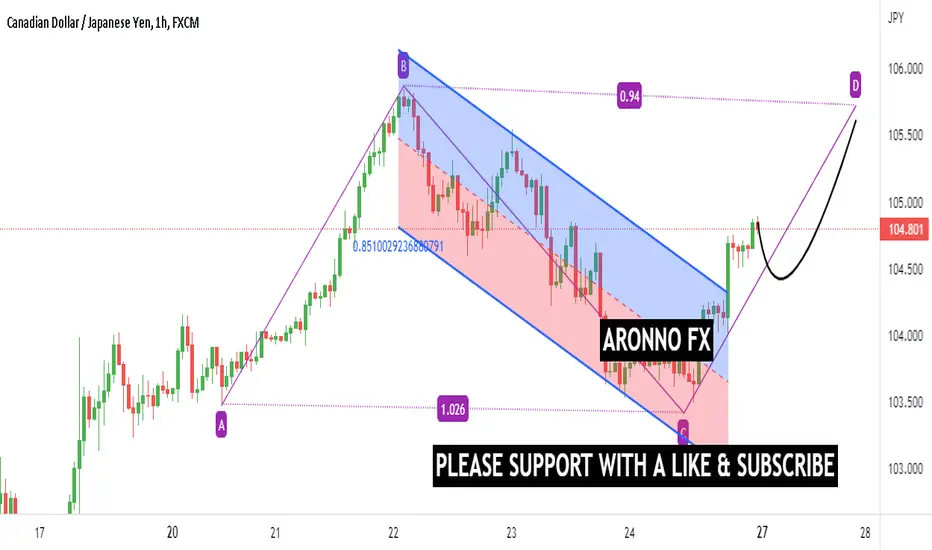
Long on CADJPYWe are exploring the possibility of going long on CADJPY and breaking the level, giving us a space of 80 - 100 pips upward movement. The trading idea that we have prepared for you has the following parameters:
CADJPY BUY @ 103.77
TP: 104.574
SL: 103.440


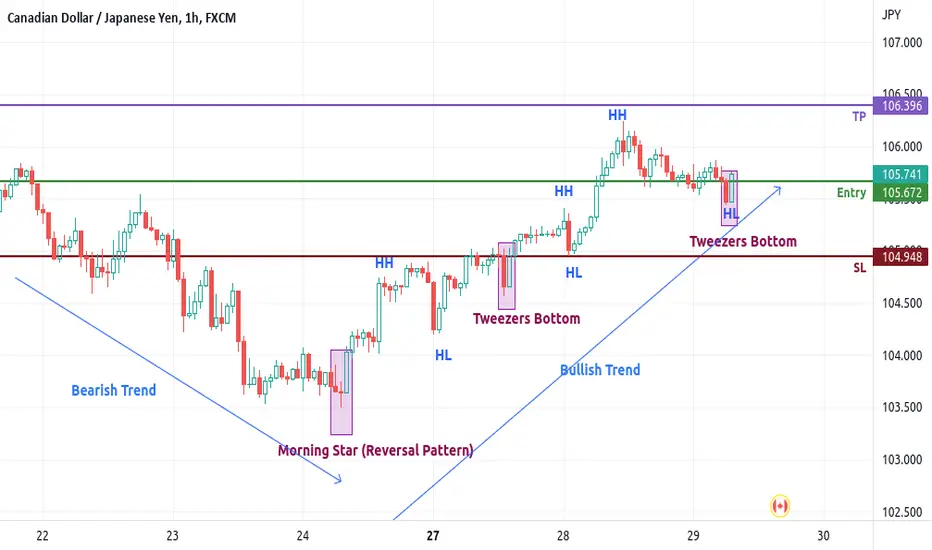
CADJPY Long - Dow Theory + Bullish Indicators - Week 03 03CADJPY Long position on basis of HHs and HLs as learned in Dow Theory and on basis of bullish indicators in the bearish trend.
- Morning Star, Tweezers Bottom has been marked
- SL is last HL
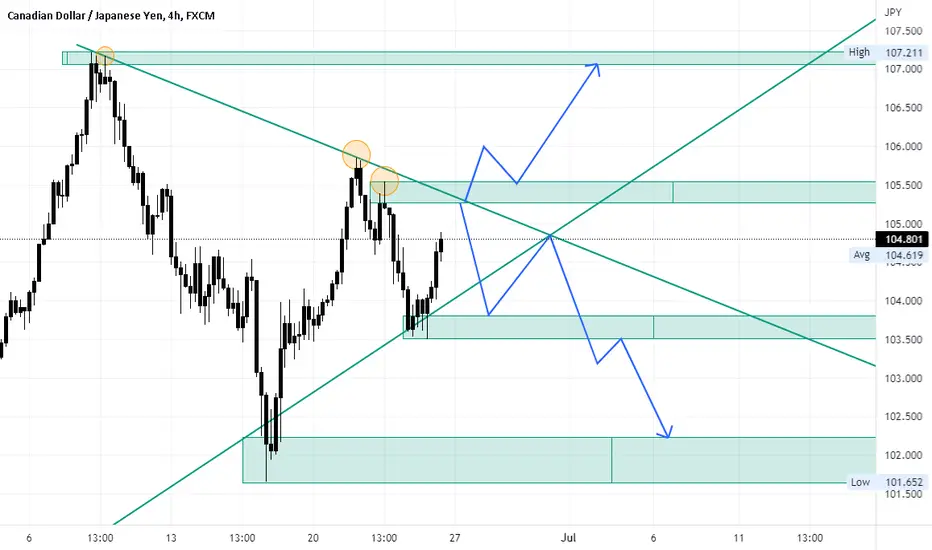
CADJPY | good range !We considered two scenarios
1. For LONG, we wait for the blue range to be broken, then enter the position after the pullback
2. For SHORT, after a reaction or a bearish signal, we enter the blue range
I think the first scenario is more likely, because in this Trend I see that a lower LOW is not made


CADJPY - Comprehensive Ichimoku AnalysisCADJPY is bullish across multiple timeframes. A comprehensive top-down Ichimoku analysis can help us confirm our bias and find the best time to enter.
Weekly:
On the weekly chart, it is bullish. We have strong Ichimoku signals such as Tenkan-sen above Kijun-sen, a bullish Kumo cloud, Chikou span above price, and lower highs forming in price action.
If we use a Kyushu legs analysis, we can see that the market is continuously bullish. Kyushu legs analyses momentum over the past 9 weeks and can also help us analyse time cycles and trend length.
Using Kyushu legs, we can see that the last major bullish trend lasted 33 weeks. This gives us two targets. Given that the current bull period has lasted 23 weeks, we could expect it to either continue for 3 more weeks (making a total of 26 weeks, a significant Ichimoku number), or for the full 33 weeks, which would take us all the way to September. Either way, these both show that there is potential momentum remaining in this bull run.
Daily:
From the daily point of view, it is also bullish. We have price above Tenkan and Kijun sen, Chikou above price, and a bullish Ichimoku cloud. One thing that gives me caution is that the Kumo cloud is both flat and thin. This means it is weak and may not be a strong support in the case of a retracement.
If we leave my weekly targets in view, we can look at the daily and plan some scenarios:
The main scenario is a continuous move bullish, with minor retracements until 5 September. However, we do have major resistance points ahead as outlined below.
4H and below:
On the 4H chart we can easily see the potential resistance points at 105.843 and 107.211. These are pivot highs, and I would not buy going into these. It is very risky, but a successful breakout of these levels would be powerful. Other signals on the 4H chart are positive. Bullish Kumo, recent bullish TK crossover, and Chikou just coming above candles right now.
The 1H chart is also clearly bullish. However, the Tenkan-sen, Kijun-sen and Kumo lines are all flat. This is significant. It means that the market is not making new highs. We can even see this based on the wick from the previous candle. I would only buy into a market is Tenkan-sen, Kijun-sen, and Kumo are angled up. Whenever you see flat lines, it means that a retracement back to Kijun-sen or the Kumo cloud is more likely.
How to enter:
The long-term view is bullish, so I am currently looking for a chance to enter on the 5m chart. I am currently waiting for a resistance breakout, at the same time as bullish stochastic, price above bollinger bands, and relative strength on the pair versus all other CAD pairs. All of these confluences can give me the confidence of taking a bullish long trade with a very large lot size and small stoploss.
You can use any entry criteria you like, as long as Ichimoku remains bullish on either the 1D and 4H chart, or 4H and 1H chart. If Ichimoku is bullish, then it increases the probability of a breakout, and in turn, increases the success of your trades.
Conclusion:
- Bullish on the weekly chart, with at least 3-7 weeks of potential bullish momentum
- Bullish on the daily, with upcoming resistance points at 105.843 and 107.211
- Bullish on intraday timeframes, with a recent TK cross on the 4H chart
- Waiting for a clear edge on the 5m chart to make an entry. I will wait until relative strength is observed, combined with resistance break, bullish stochastics, and bullish bollinger bands.
I cannot emphasize enough that you need to wait for a clear edge to appear on lower timeframes. This type of trading is essentially breakout trading, and the majority of breakouts fail. Ichimoku helps us see when breakouts are more likely to occur, but Ichimoku by itself won't give you the exact trading signal to buy or sell. The entry might happen in a few minutes, later today, or not at all. We could see a bounce off resistance or a clear breakout. The beauty of Ichimoku is that it can help you plan your scenarios and easily see opportunities like this. Despite the long writeup, I was able to see everything above in less than 5 minutes of scanning.
Keep an eye on multiple timeframes, use Ichimoku to gauge the trend strength, and use lower timeframes to find the edge to enter.
Good luck!

USDJPY and CADJPY top-down analysisHello traders, this is the full breakdown of this pair. We will take this trade if all the conditions are satisfied as discussed in the analysis. Smash the like button if you find value in this analysis and drop a comment if you have any questions or let me know which pair to cover in my next analysis.

CADJPY showing bullish momentumCAD getting stronger overtime. also sent this one last week. I'll go long with this one too. because the stucture is uptrend and price broke past EMA.

GBPJPY can possibly head Higher Good morning traders. this trade would be suitable to be taken If this candlestick closed like this, and above EMA. this is not a trade recomendation just an idea in which I'm going long.

CADJPY long - 6/27/22Bullish break of sideways channel to the upside. Positive ADX on the 1hr. The current trend is up. This is also a break to the upside of a larger descending channel.

CAD/JPY buy signal....VIEW
Hello Traders, here is the full analysis for this pair,
let me know in the comment section below if you have any questions,
the entry will be taken only if all rules of the strategies will be
satisfied. I suggest you keep this pair on your watch list and see if
the rules of your strategy are satisfied.
Dear Traders,
If you like this idea, do not forget to support with a like and follow.
PLZ! LIKE COMMAND AND SUBSCRIBE.
CADJPY Set UpMy CADJPY analysis. I'm not sure just yet what this pair will do. Naturally, I have a sell bias on a lot of my JPY pairs, however, I'll see what this pair does! But these are the 2 scenarios I see for this pair :).
CADJPY long - 6/23/22CJ showing bullish structure on the 4hr timeframe, with bullish move to the upside and retracement back to 0.50% fib and rejection for continuation to the upside.

USDCAD top-down analysis, UPDATEDHello traders, this is the full breakdown of this pair. We will take this trade if all the conditions are satisfied as discussed in the analysis. Smash the like button if you find value in this analysis and drop a comment if you have any questions or let me know which pair to cover in my next analysis.

Cadjpy risky longsCadjpy has been in a long term uptrend, so we should be preparing for a distribution.
Nevertheless, this lends credence to a trend following approach being optimal.
A pullback to the previous high of the pair should signify a highly probable formation of a Higher Low to shoot for a continuation long.
Incidentally the pullback zone is also the 61.8%/50% fib level of the upmove.
The bullish break and retest of the LTF descending trend line and the LTF minor resistance should most probably start a bullish climb to equal highs at least.
Pls like and drop quick sub and COMMENT!.

Short CADJPY - Mutiplie time frame analysish1: the pullback broken
m15: start downtrend wave
so up a short position
Target R:R 1:6.8

CADJPY $CADJPY Initial LongCADJPY $CADJPY Initial Long. SL and TPs on chart. 10-20x leverage. Move SL on TP.

