CADJPY Ending Diagonal Into Yearly R3 PivotIn this update we review the recent price action in the CADJPY and identify the next high probability trading opportunity and price objectives to target
Cadjpyshort

2X CADJPY 1D Tech. Analysis!CADJPY has broken the mid-term bullish trendline and came back to retest the order block in the 106.375 area. We also see a possible head and shoulders forming, so this is what we are going to play down to the long-term trendline! We are going to wait for the break of the short-term bull trendline for a safer entry! but my entry is already in @106 area! Wait for confirmation, be patient and lock in profit!

CADJPY short15M supply zone. 15M sell zone. Golden fib zone. 15M bearish reversal pattern. Sell Sell Sell...Targets at the next 1H demand zone and bank zone.

CANADIAN DOLLAR / JAPANESE YEN (CAD JPY) ANALYSIS Hi guys
. I have marked the important levels in the chart.
.The price is near the resistance range. We expect the price to fail to break the resistance. We are looking for a reversal signal to enter a sell position
. This analysis is a personal opinion
. If the analysis was interesting to you, share it with your friends
. Follow to see more of my analysis.
.Comment your opinion for me

CADJPY sell opportunityCADJPY also rejected from the top and it can go up to the supply zone
wait for the market to reach there and sell CADJPY on retest after confirmations
always remember that patience and money management are the key to success

CADJPY shortPrice is below daily pivot with bearish sequence. 1H negative momentum. 1H tweezer top. Rejection off 0.786% fib inside 15M supply zone. 1H Structure making lower lows and highs. Price action around key bank zone.

Huge drop?Hey traders as we can see in daily time frame CADJPY is at huge resistance so I expect a great fall towards price level 103.800
Good luck all if you like my idea like it and comment your opinion ☺️

CadjpyMy previus setup on cadjpy hit sl but here is the update one..do not miss this opportunity coz it reach new major supply..probably this time will go down drastically..R:R 1:10 as usual

CADJPY - 240 MINS TIME FRAMEThe Structure looks good to us, waiting for the this to correct and then give us these opportunities as shown on this instrument (chart).
Note: its my view only and its for educational purpose only. only who has got knowledge in this strategy will understand what to be done on this setup. its purely based on my technical analysis only (strategies). we don't focus on the short term moves, we look for only for Bullish or Bearish Impulsive moves on the setups after a good price action is formed as per the strategy. we never get into corrective moves. because it will test our patience and also it will be a bullish or a bearish trap.
we do not get into bullish or bearish traps. we anticipate and get into only big bullish or bearish moves (Impulsive moves).
Just ride the bullish or bearish impulsive move. Learn & Know the Complete Market Cycle.
buy low and sell high concept. buy at cheaper price and sell at expensive price.
Keep it simple, keep it Unique.
please keep your comments useful & respectful.
Thanks for your support....

CADJPY My Bias is Short Simple Support And Resistance Analysis with the help of Trend line Keep Your Eyes on it...

CADJPY SHORT IDEA 26TH AUGUST 2022
We have seen a clear bearish movement from the daily time frame of the chart and we have seen a series of bearish candle movements previously from our last entry. The supply zone we are currently in have seen to hold price for some time now and we have shifted to the lowertime frames for extra confirmation and we have set out and entry and stoploss, if the markets decides to switch to the bearish mode from here will be looking at a RR of 1:150
UNDERCOVER TRADING!!!!!!

⁉️ CADJPY - Market AnalysisHello traders!
⁉️This is my analysis on CADJPY .
Here I expect price to continue the retracement to fill the imbalance and to reject from bearish orderblock + institutional big figure 106.000. We can correlate this move with JPYBASKET.
Like, comment and subscribe to be in touch with my content!

CADJPY SELL SETThis pair has reached our POINT OF INTEREST(POI) premium area to load sells, we are already in this trade waiting for the move down and God bless our hustle. Take this as presentation of an opinion and not financial advise. God be with you if you are going to be trading this.

CADJPY H1: Bearish outlook seen, further downside below 105.50On the H1 time frame, prices are testing the resistance zone at 105.50 in line with the graphical resistance where a break below the downside confirmation level at 104.80 could provide the bearish acceleration for further downside moves to the support zone at 103.50. This support zone lines up with the 78.6% Fibonacci retracement. Stochastics is testing resistance and seeing bearish divergence as well as highlighted in red where we could see further downside in prices.

💡Don't miss the great sell opportunity in CADJPYTrading suggestion:
". There is still a possibility of temporary retracement to the suggested resistance line (105.60).
if so, traders can set orders based on Price Action and expect to reach short-term targets."
Technical analysis:
. CADJPY is in a range bound, and the beginning of a downtrend is expected.
. The price is above the 21-Day WEMA, which acts as a dynamic support.
. The RSI is at 46.
Take Profits:
TP1= @ 105.00
TP2= @ 104.71
TP3= @ 104.21
TP4= @ 103.70
TP5= @ 103.26
SL: Break Above R2
❤️ If you find this helpful and want more FREE forecasts in TradingView
. . . . . Please show your support back,
. . . . . . . . Hit the 👍 LIKE button,
. . . . . . . . . . . Drop some feedback below in the comment!
❤️ Your Support is very much 🙏 appreciated!❤️
💎 Want us to help you become a better Forex / Crypto trader?
Now, It's your turn!
Be sure to leave a comment; let us know how you see this opportunity and forecast.
Trade well, ❤️
ForecastCity English Support Team ❤️

💡Don't miss the great sell opportunity in CADJPYTrading suggestion:
". There is still a possibility of temporary retracement to the suggested resistance line (105.60).
if so, traders can set orders based on Price Action and expect to reach short-term targets."
Technical analysis:
. CADJPY is in a range bound, and the beginning of a downtrend is expected.
. The price is above the 21-Day WEMA, which acts as a dynamic support.
. The RSI is at 47.
Take Profits:
TP1= @ 105.00
TP2= @ 104.71
TP3= @ 104.21
TP4= @ 103.70
TP5= @ 103.26
SL: Break Above R2
❤️ If you find this helpful and want more FREE forecasts in TradingView
. . . . . Please show your support back,
. . . . . . . . Hit the 👍 LIKE button,
. . . . . . . . . . . Drop some feedback below in the comment!
❤️ Your Support is very much 🙏 appreciated! ❤️
💎 Want us to help you become a better Forex / Crypto trader ?
Now, It's your turn !
Be sure to leave a comment; let us know how you see this opportunity and forecast.
Trade well, ❤️
ForecastCity English Support Team ❤️

CADJPY OUTLOOKCJ at a 3h supply zone has broken structure to the downside signifying a change of trend to bearish. going down to m15 a CHoCH has alreaady happened, I zoomed in to m1 waiting for price to return to the m15 zone - now a CHoCH has happened on m1 and I'm placing a sell limit at the OB that caused CHoCH on m1, hopefully it gets triggered at NYKZ. NOT A FNANCIAL ADVICE, JUST A TRADNG IDEA. TP AT 1:3RR


CADJPY SELL ANALYSISLooing at CADJPY on 30M timeframe
We looking for a possible SELL/SHORT position
We looking for a possible downward at this distribution phase

CADJPY Sell set upHello everyone
Here's the latest CADJPY analysis.As you can see, this is just price action analysis and you should be patient till get right candle stick confirmation.
good luck

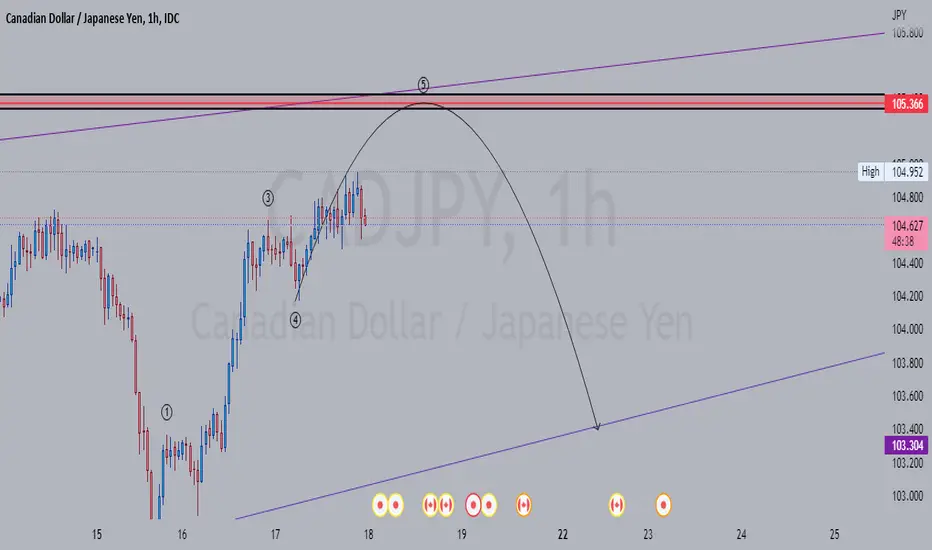
CADJPY: Elliot Price ActionHello. According to the chart and the expectation of a downward trend in the time frame, we see a distributed trend up to the specified value, which is trying for the fifth wave, and wave c will be created from the trend of wave b, and then we will have a downward trend.