CAD/JPY - 2H/1H - SHORT !FX : CAD/JPY short !
what is your opinion???
Do not forget Maney management !
Cadjpyshort

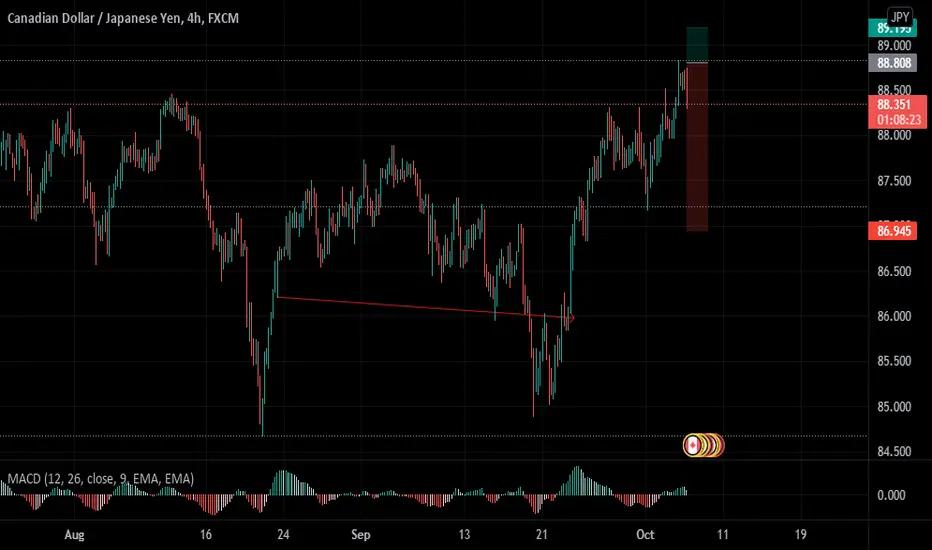
CADJPY - Sell Back In Line The Bearish ChannelCADJPY has been temporarily sleep-walking up out of a down trending channel through an up thrust.
Some resistance rejected at 88.30. Smart pin.
Expecting to return back in line revisiting the channel.
Exaggerated Divergence (Bearish).
TP1 - 86.50
TP1 - 85.50
Good loot management in play.

Shortprice heading to area of liquidity and we should expect a bounce off to the downward for 500+ pips.


CADJPY Beasish Idea (Risky Trade)For the past few days, CAD showed its strength against JPY! Technically, there's a great chance to see some weaknesses in CAD for the coming few weeks! Any reversal candlestick pattern on a lower time frame will be a good sign for bearish moves on CADJPY!


CADJPYBullish Indicators:
1) HH HL
2) Upward trend
3) Taking Support from the lower trendline
Bearish Indicators:
1) Resistance area at 88.698
Plan A: On the bounce from the lower trendline one can buy for the target of 88..698 and then for the 89.795.
Plan B: Failure to take a support from here one can take a short position for the target of 87.157.


AGAIN SELL 100 PIPS//this is making right shoulder on h4 for h & s pattern..
but i am happy with my quick 100 pips cheers..
this is old signal of this pair..

CADJPY SHORT CADJPY is due for a big sell over 200 pips our sell entry will be at the 61.8% fibonacci retracement level or 50% retracement level


CADJPY A Great Selling Opportunity 🤨👌Trade Proposal:
There is a probability of first tp to the proposed ( 87.60 ) Direction line. So, Traders can set orders based on Price Action and expect to reach short-term goals.
Technical analysis:
CADJPY is in Downtrend and It is Expected to Continue Downtrend.

CADJPY Short Analysis Hey traders, here is the analysis for the CADJPY. Let me know if you guys have any questions in the comment section. If you guys like my analysis please hit like. Thanks. NOTE - Please do your own analysis before taking the trade.
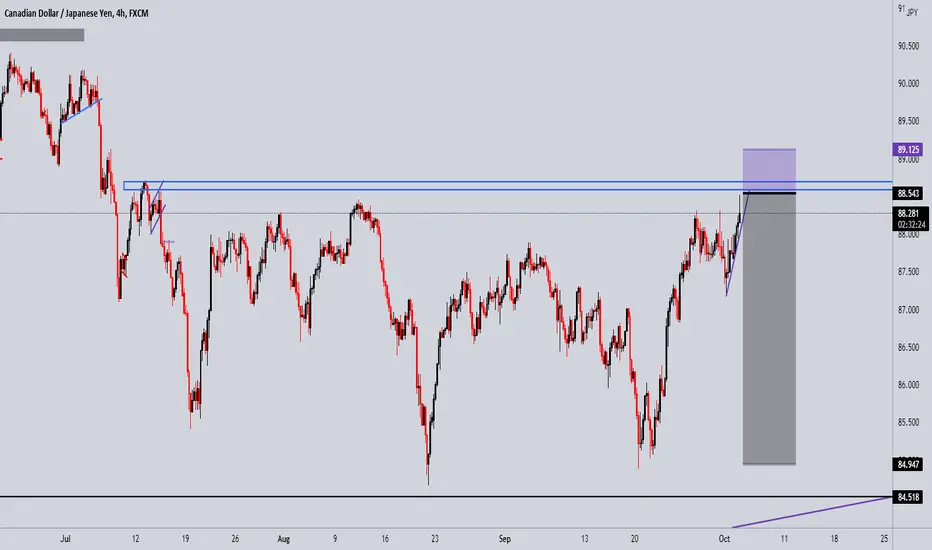
CADJPY ShortMy view of CADJPY . Potential short opportunity.
This will be plain and simple. From Sep. 28th to Sep. 30th we respected the MRA (Major Resistance Area) . Although the price tried to break out of the Consolidation area , the sellers prevailed. SO! Looking at the fact we are in a Consolidation area, I expect the price to go down to our MSA (Major Support Area) . Entry is at 87.821 with a Stop Loss above the MRA and Consolidation area at 88.794 . Take profit is at MSA (85.075) . Break of mSA (minor Support Area) would confirm lower levels and continuing the move down to our Take Profit. I also made an example showing 2 possible outcomes if we break to the upside or downside.
PARAMETERS
- Entry: 87.821
- SL: 88.794
- TP: 85.075
KEY NOTES
- Sep. 28th to Sep. 30th we respected the MRA (Major Resistance Area) .
- If we break the Consolidation area at our SL , it would confirm higher levels.
- Break of mSA (minor Support Area) would confirm lower levels and continuing the move down to our Take Profit .
Happy trading!

CADJPY SHORT?As i always say enter after only confirmations and analysis with your own ideas too
spotted a parelell channel trade on cadjpy
i hope it will help you and dont forget to me a like

CADJPY Weekly Forex Analysis & Trading Idea for 4th - 8th OctobeCADJPY Weekly Forex Analysis & Trading Idea for 4th - 8th October 2021

cadjpywe are publishing an idea about cadjpy short position that nobody tell it to you.
sell ater engulfing candle in purple zone... but if not you can enter the long position...We are waiting for now... goodluck guys

A Short term Sell :)Nothing much to talk about cadjpy this just quick 60+ pips trade but
also price IS ON daily sell continuation Trend line so it may go further down...
this short term trade confirm by rsi divergence and market patterns..
what you think about this pair? lets talk in comments section..

cadjpy shortin a downtrend, price reacting to a supply area and make a down move and create another supply area.
the price is in that second supply area, we expect the price will make another down movement at least to 50% fibonacci retracement and monitor price action at that area to possibility go down to lowest demand area.

CADJPY Sell Trade Opportunity (Go Very Very Short)Nice Selling Opportunity With This Pair (CADJPY).... Counting On Trend Reversal or A Slight Pause With The Trend... SL>> Slightly Above Previous High In-case Trend Strength Pics Up & TP 1 & TP 2 Indicated By The Dotted Lines ... Good Luck!!!

