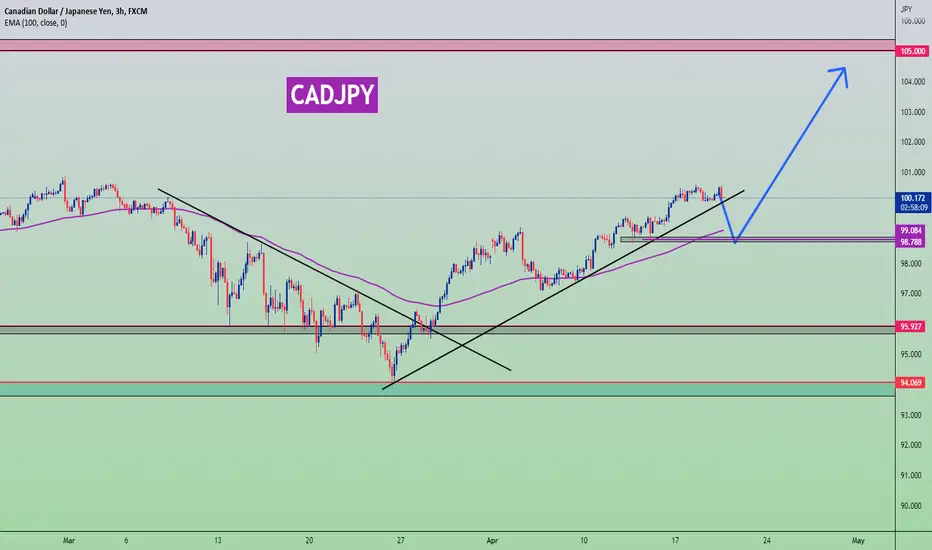
CADJPY: Retested Bullish Trendline, Continue its Bull Run Again?Hello Fellow Global Forex Investor/Trader, Here's an Outlook for CADJPY!
Price Action Analysis
1. FX:CADJPY has retested on the multiple rejection area and Bullish Trendline
2. Then, forming a Falling Wedge, the pattern indicates a bullish continuation pattern
3. Breakout of the pattern confirmed the possibility of the upside movement
4. The MACD Indicator also made a Golden Cross, signifying the possible upside movement to the target area.
Other Technical Drives :
1. JPYBasket is moving in the bearish trend or below EMA200
2. Breakout of the Rising Wedge indicates a possible continuation of the bearish trend
The roadmap will be invalid after reaching the target/resistance area.
Support the channel by smashing the rocket button and sharing your opinions in the comment below!
"Disclaimer: The outlook is only for educational purposes, not a recommendation to put a long or short position on the CADJPY"
Cadjpyshort

CAD JPY SET UP Hello guys,
CAD JPY has been moving in an ascending channel, and the price has reached the support trend line. Do you think the price will break through or bounce? I expect a bounce, so I'm waiting for the BUY confirmations.
If the price breakthrough, I will be looking to go short after the retest of the broken support level, tell me what you think guys.

CADJPY - Bearish Trend According to my analysis using the Relative Strength Index (RSI) indicator, there is no divergence present at the moment. Trend is printing series of LHs and LLs.
As part of my personal trade plan, I intend to enter a short trade with a 1:1 risk/reward ratio.
However, it is essential that you conduct your own thorough research and risk management strategies before making any trading decisions.

CADJPY Live TradeThe CADJPY has been trading strongly since April 26th, 2023. There was a big increase on Friday and it continued today. However, based on our wavecount analysis, we believe that three wave structures have been completed and it's likely a good time to sell. We took a short position at 101.05, with a 10-pip risk and a target of the GM4A (100.64) of the fibo.
Enjoy!

CAD/JPY, possible short soon...CAD/JPY is nearing a major resistance level, and if see price reacting to that resitance level i will open short postions.

CAD/JPY SHORT ENTRY Hey Guys!
I just aborted the entire cad/jpy short position due to possible current long strength kicking back in.
That's it! Have a great day!
Ken

CADJPY SHORTOn 4h timeframe it got rejected on resistance level, it looks sideways though, for 2hr timeframe it looks bearish for me, and might go back to the 2hr supply area and sweep the internal liquidity. However on 30m timeframe there is a supply area, if ever it price gets rejected on that supply area, I guess it can be considered as the new Lower high and may not proceed to the 2hr Supply.

CADJPY Trade! Before / After.Hello traders around the world!
My name is Alexandre Karim and today I am going to tell you how I took my double short position on CADJPY.
In my previous analysis on this pair (Shared Apr 18), I was looking for a reversal pattern in this area since we are on the third touch of the upper TL.
The price went up correctively reaching this area & gave us a double top as well for more confirmation.
Therefore, the pattern that I took (First short position) was the break out of the hourly ascending channel and I sat my SL above the previous high (100.664). When the price gave us the first impulse all the way down to (98.930) I moved my SL to Break Even.
The second pattern / second position that I took was the hourly bearish flag signaling a continuation to the downside.
My entry was at the break out of the structure (Bear flag) + my SL at (99.588) above the previous high.
Then moved my SL to BE when the price gave us the impulse to the downside.
Currently both of my positions are at BE now and I will be waiting for 1 hour corrections to lock above them and secure %
Patience is key.
Risk management is crucial.
Aim for quality trades.
#THEPRIMES

CAD/JPY INTRADAY SHORTFake Choc identified
Demand of interest still not reached to go long
No price exhaustion observed
Volume kicked in on area for short and started ranging indicating a possible reversal
Since is counter main trend tighter risk management would apply

CAD/JPY SHORT ENTRY Hey Guys!
The Weekly bias on the cad/jpy is short. Or in other words, price is likely to reach 94.06 before reaching 100.87.
Moreover, I just took an aggressive short entry. In this post I explain the reasoning for the short bias, how I entered the short entry, as well as how I plan to manage this short trade.
That's it!
I'll keep you guys updated!
Ken

CADJPY reaching supply ZoneHere we can see that CADJPY is reaching its supply zone from the major uptrend.
with the major news coming for cad this week. i expect CADJPY to get short and reach the downside highlighted zones.
best of luck .
target remains to be 97.55


CADJPY BEARISHThe strength of the yen continues against the Canadian dollar, sentiment indicates that the price will continue falling against the CAD.

CADJPY : Current Situation & Technical , Fundamental View#CADJPY
- CADJPY is currently selling after a STRUCTURE BREAK because the current MARKET SENTIMENT is NEUTRAL. Somehow, JPY is becoming somewhat STRONG. Similarly, the YEILD given by the BOJ to JP10Y increased, making the JPY STRONG.
- The reason for that is because the Central Bank of Japan did not intervene in the long term to strengthen the JPY, they are strengthening the JPY in other ways without raising the rate. Meanwhile, the price of OIL has gone down a bit, so the CAD has become very weak in the last few days. Anyway, as expected in the BOC RATE DECISION the other day, the RATE HIKE was done.
- But somehow the CANADIAN CENTRAL BANK has become HAWKISH. Therefore, CADJPY should definitely be slightly UP until the 105.00 LEVEL. Before that, there is definitely a very high possibility to sell to 98.78 LEVEL. So FOLLOW STRUCTURES. If JPY becomes strong, it can sell at 93.01 level.
CADJPY PLAN!Hello traders around the world!
I want to talk about CADJPY and what I'm planning on this pair for this week.
First of all, If you go back to the weekly chart, you can clearly see that the price reached a mass psychological level since Dec 2014 (106.501).
On Monday 18 Apr 2022 the price started to create an ascending channel till Monday 07 Nov 2022 reaching the mass psychological level since Dec 2014 (106.501).
The price broke to the downside impulsively and might be currently forming a bearish correction.
Now, moving to the 4H Timeframe, we have two rejection lines:
1st one: 101.204
2nd one: 100.863
We can also draw an upper trend line If we connect these previous two prices & we can see that the current price is just under the upper TL.
I am currently looking for a reversal pattern on the 1H chart for a short position. I am also considering the rejection lines as mentioned before.
Patience is key.
#THEPRIMES

CADJPY - Sell-off expected ✅Hello traders!
‼️ This is my perspective on CADJPY.
Technical analysis: Here we are in a bearish market structure from 4H timeframe perspective, so I am looking for shorts. I expect bearish price action from here as price could reject from bearish order block + institutional big figure 100.000. My target for long term is sell stop liquidity.
Like, comment and subscribe to be in touch with my content!

CADJPY Movement Within the HOLY GRAILPrice will be contained within arc SV and UW long term.
Is the duty of the analyst to determine the various turning points within the arcs.
As vector UV moves along arc SV indicating the TOPS.
TOPS ( Price Unit)
1. 359.7 ( 354 Lunar sequence ). Double top formed on 17 oct 2022 ( 6 weeks apart )
2. 263.64 ( 278 Lunar sequence). Double top confirmed 10 apr 2023 ( 6 weeks apart)
Next Expected top = 203.93 ( 219 lunar sequence )
CORRECTION BOTTOMS ( Price Unit )
1. Double Bottom within 16 Jan 2023 and 20 mar 2023 ( 9 weeks apart )
206.17 ( 219 lunar sequence)
2. Next Expected bottom = 185.29 ( 172 Lunar sequence)
Use strict SL slight above 101.558
TP @ 92.535

AUDCADMy bias on AUDCAD is to the downside, any retracement you see is an opportunity for you to look for bearish set-up

CADJPY Double Top Reversal RSI Bearish 1H TF CADJPY instruments shows bearish RSI divergence at 1H TF. Short the instrument at the double top neckline or previous HL. TP1 shows a support S1.

CadJpy- Rallies above 100 should be soldSince the beginning of 2023, CadJpy has traded in a range between 96 and 100 (with some spikes in either direction).
I expect the pair to remain in this familiar range and, with the price rising towards resistance, traders could look to sell eventual rallies above 100.
Considering 100 pips stop loss and a target to the lower boundary of the range, a phenomenal 1:4 R: R could be achieved for a swing trade.

CADJPYI think it's time to watch short position. Because now you're seeing bearish pattern so it's mean market bearish

CADJPY: Appears to be in a corrective phaseWe have witnessed a significant bullish ride on the CADJPY pair from the low of the 24th March at 94.069 to the high of 31st March at 98.745, accounting for over 450pips move. After this rally, it appears that the move has reach a termination point, where correction of the 467Pips bullish move is expected. My expectation of the corrective downward move is based on the following market realizations:
1. The formation of a bearish crab harmonic pattern on H1 TF. The long AB axis, confirming the possibility of an extended Wave 1.
2. Price divergence. (This divergence occurred on my indicator vs the price). This lend credence to the fact that buyers may be getting exhausted. And sellers are about stepping in.
3. The formation of rejection candles to the upside.
Based on these parameters, I will be entering short on the pair with a target to 97.164 region, which also coincides with my fib golden ratio.
I'm also aware that the corrective wave could be a flat and we may see a temporary price rally to 98.830, but my overall outlook is bearish until the correction is over.

CADJPY Bullish Harmonic AB=CD 1H TFCADJPY instrument shows bullish harmonic reversal pattern AB=CD at 1H TF.
