CADJPY Analysis H1Here is my analysis for CADJPY on H1 using Order Block. The price could go bullish, you can put a pending order on the Order block or find an entry on LTF within OB Zone. Trade Safe!
Cadjpysignal

CADJPY Buy H1Here is my analysis for CADJPY on H1 using Order Block. The price could go bullish, you can put a pending order on the Order block or find an entry on LTF within OB Zone. Trade Safe!

CADJPY Bearish Bias!CAD-JPY has hit the
Horizontal resistance
Of 107.0 from where we
Are seeing a bearish
Reaction and I think
That the pair will go
Further down!

SELL CADJPYHi fellow traders, CADJPY has reached the blue box after completing this large WXY correction. Look for a sell opportunity anywhere from this area. Target the wave 'X' low. Good luck and trade safe!

CADJPY : Short Trade , 1hHello traders, we want to check the CADJPY chart. The price is moving in a downward trend and has pulled back to the specified key level. We expect this breakout level to act as a support level and cause the price to fall further. We will have a price drop of 106,900 and 106,300. Good luck.

CADJPY Analysis H1Here is my analysis for CADJPY on H1 using Order Block. The price could go bullish, you can put a pending order on the Order block or find an entry on LTF within OB Zone. Trade Safe!

CAD/JPY - LONG; Buy it up!This should be self explanatory. The Loonie should also benefit - including for the long run! - from the global re-centralization toward NAFTA.

CADJPY Analysis 10July2023I believe for this pair that the bullish trend has collapsed, the trend is turning bearish for now. usually after a trend collapse, the price will correct back to near the previous HH, it's a good idea to place pending orders in the area you have marked.
CADJPY Analysis H4Here is my analysis for CADJPY on H4 using Order Block. The price could go bullish, you can put a pending order on the Order block or find an entry on LTF within OB Zone. Trade Safe!

CADJPY Signal 27June2023price is seen breakingout the H1 trendline with a fairly full bearish candle. I see this as one of the minor bearish signs.

CADJPY ____ INCOMING BEARISH MOVEHello Guys,
As I had mentioned in my previous post on USDCAD (inserted below), CADJPY which is correlated to USDCAD is also at a very important supply region (weekly order block).
My speculation is that CADJPY may continue some more inducements and manipulation on its way to the top before it begins selling.
If you look left, you will notice the buy-side liquidity (equal highs) that the price may just spike above before selling or creating another equal high.
You should put this pair under your radar as it has more potential to deliver on the short.
Follow me for more updates like this.
USDCAD ANALYSIS
Cheers,
Jabari

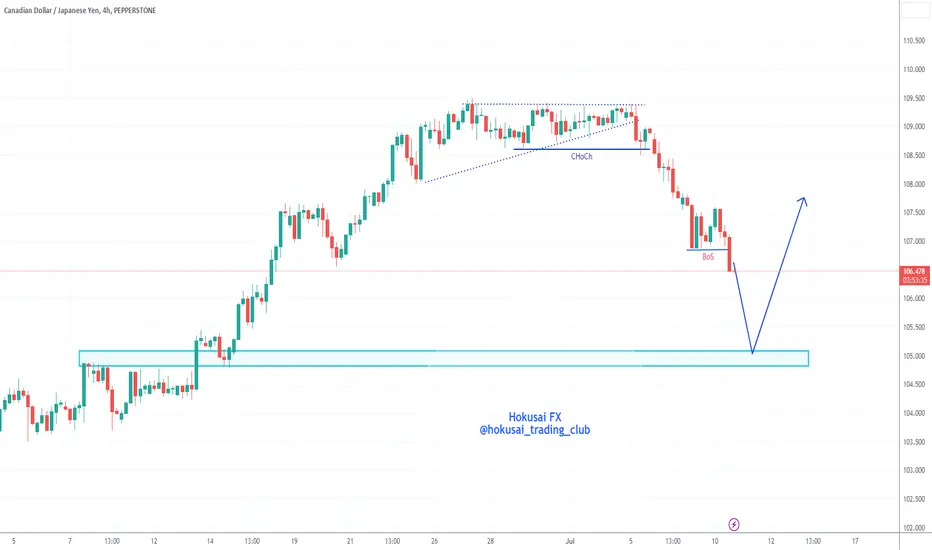
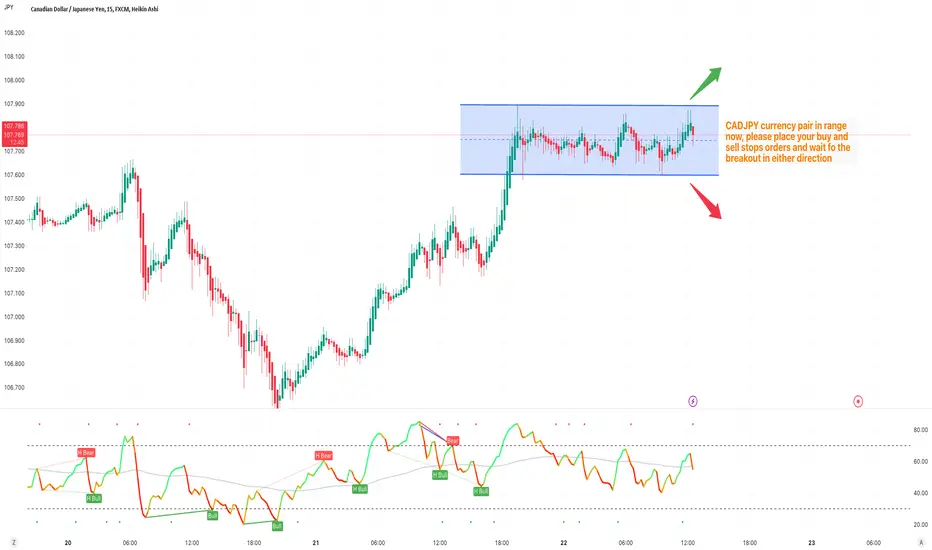
CADJPY Potential Breakout TradeCADJPY is about to break its range please place buy and sell order to take trade or wait for breakout.

CADJPY Analysis H1Here is my analysis for CADJPY on H1 using Order Block. The price could go bullish, you can put a pending order on the Order block or find an entry on LTF within OB Zone. Trade Safe!

CADJPY Breakout SetupCADJPY is about to break its range please place buy and sell order to take trade.
Manage your risk accordingly.
CADJPY Resistance Breakout SetupCADJPY currency pair breakout trade on resistance side, You can also place Sell stop below resistance line or wait for breakout.

cadjpy short 1:10 r:r ratiocadjpy short 1:10 r:r ratio
daily high , 4HR liquidity grab area ,1HR OB in that area

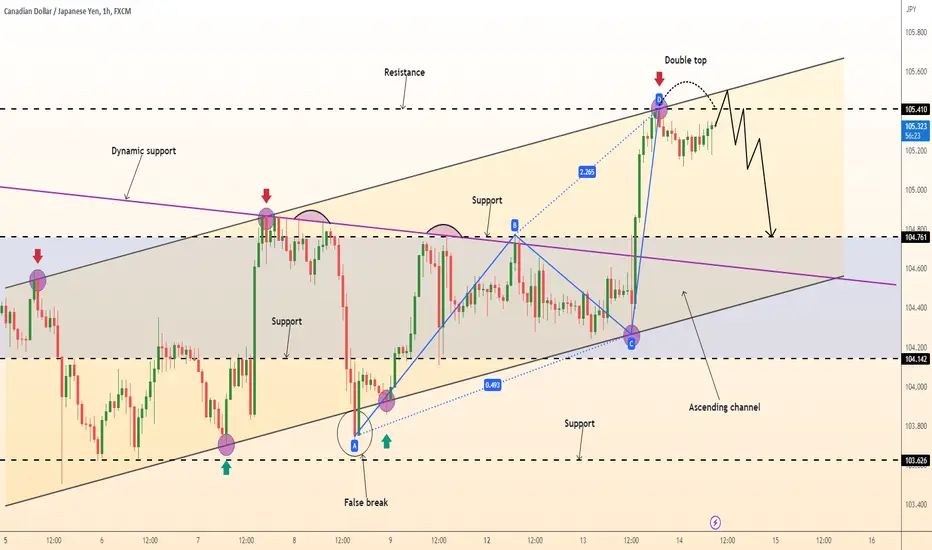
DeGRAM | CADJPY double top at the resistance levelCADJPY is decelerating at resistance level on the 4H chart. It created a double top.
The market shows a divergence at the resistance level, meaning a pullback might happen.
Kill zone: resistance and an equal-measured move.
-------------------
Share your opinion in the comments and support the idea with Like. Thanks for your support!
CADJPY ____ INCOMING BEARISH MOVEHello Traders,
CADJPY traded into a strong weekly order block last week but didn't sell as expected. However, it created both buy-side and sell-side liquidity. My speculation is that It hunts the buy-side liquidity first, then go for the sell-side liquidity.
This simply means that the price would run deeper into the weekly order block to gather momentum for the bearish move.
Follow for more updates.
Cheers,
Jabari

CADJPY TradingViewHere is my analysis for CADJPY on H1. The price could go bullish, you can put a pending order on the Order block or find an entry on LTF within OB Zone. Trade Safe!

cadjpycadjpy setup
price is currently bullish
retesting a previous high/resistance turned support
BIG bearish wick showing buy power

CADJPY AnalysisAs I study the economy of Japan, its economy is strong, but they did not increase their interest rate. So in this situation, I think Yen will remain weak. Better to look buying opportunity on this pair.

CADJPY ____ LIQUIDITY SWEEP INCOMINGHello Traders,
Have approached a monthly supply zone (marked with red). Price is meant to reach this level. Due to the fact that this is obvious to everyone, price manipulation will have to happen to ensure people are liquidated before the sell-off.
One way the market does this price manipulation is to induce people and form a liquidity pool that it will sweep before the bearish expansion.
As marked on my chart, you will notice that there is buy-side liquidity just below the monthly supply zone. Once the price sweeps this liquidity, I would have liquidated enough people before the selling begins.
I will advise you to wait and see how the price reacts to this zone before you decide to look for a bearish setup to trade.
Follow me for more updates like this.
Cheers,
David

CADJPY ____ SHORT-TERM BEARISH MOVEHey Guys,
Just like EURJPY and SGDJPY (inserted below), CADJPY will give a short-term retracement as shown in my chart before the bullish rally continues.
Follow for more.
Cheers,
David
