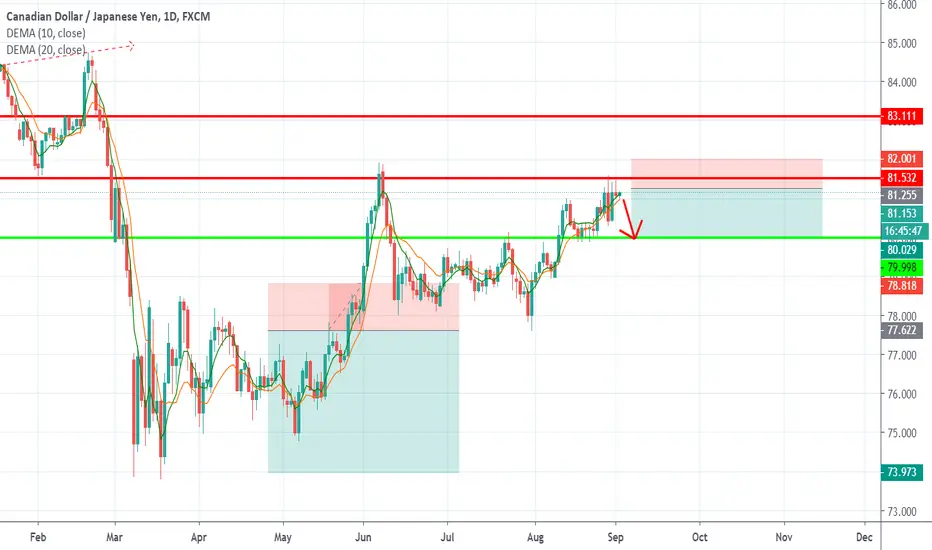
CadJpy- I'm still bearishLast week I said that CadJpy could have found a top at 81.50 zone and a drop to 80 is not out of the question.
The pair is consolidating under this resistance as if is waiting for a trigger.
I maintain my bearish outlook and I expect CadJpy to drop to at least 80 zone. Also, a correction in Oil price would t hurt...
Cadjpytrade

CADJPY - sell biased Hi all traders,
Im still looking to sell this pair and i will take it as a range trading for now.
So keep a good look out for this pair as this week we have some cad news and this pair is gonna be very interesting to get some nice pips out of it.
Any buy will only happen if the top of the range is broke out of it.
Cheers and have a nice day!
Share this trade idea with all your friends and follow me on tradingview for more trading ideas and analysis.
Disclaimer: all trade ideas shared are only of my own personal views, it's not a financial advice, thanks!

CADJPY Bearishprice is bearish can hit lower support zone.
not shorting here will check for some harami candle if i see any good shorting setup

CadJpy- a drop in 80 zone is possibleLast Friday CadJpy has finished the day putting in a big bearish engulfing on our daily chart and also this bearish engulfing translates in a Pin Bar on the weekly chart.
Yesterday we have a Pin Bar on daily from exactly the same resistance and it looks like the pair is ready for a drop.
In conclusion, rallies against resistance should be sold and 80 zone could be our target.
CADJPY, daily tf, bearish divergence at resistanceHello my friends,
I just found an interesting setup to trade right now.
CADJPY formed a bearish divergence exactly below the 81.50-70 resistance.
This is a strong resistance in my opinion and a bearish divergence exactly at this point might push price go down.
Sell CADJPY 81.20
Stop loss 81.95
Take profit 1 @80.40
Take profit 2 @79.70
Disclaimer : I've sold CADJPY from 81.20
Use only 1-2% risk
Good luck

CADJPY - range trading for this pair till breakout happens.Hi all traders.
Im looking to trade the ranges for this pair till we have see a definite breakout for this pair.
Not the best pair to trade, but if u are doing some scalp, might consider to take some pips from here.
Cheers!

CAD/JPY Buy BiasLooking for a buy when the price retracing to the zone box. the trend is very clean to the upside.

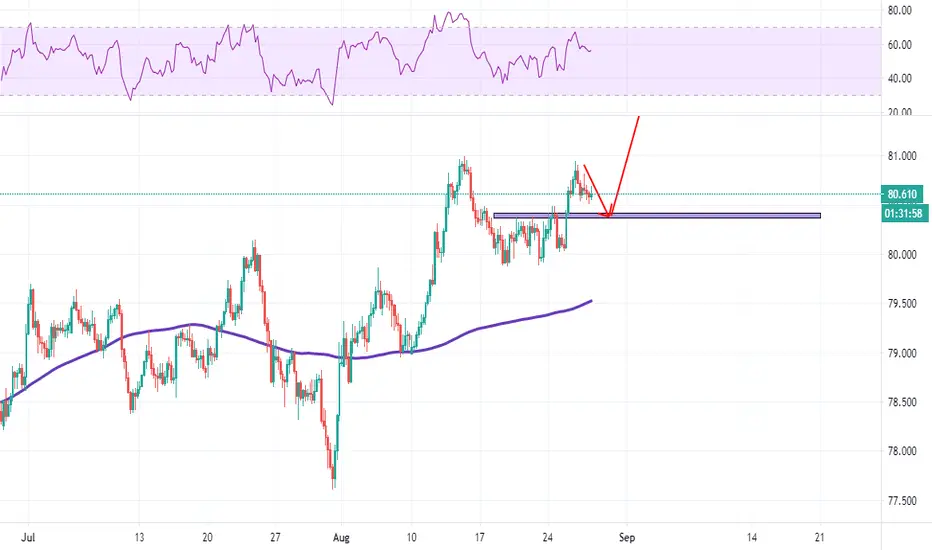
CADJPY - retest of the purple areaHi all traders,
Today trade idea for cadjpy
Retracement have started since yesterday.
This pair is still an uptrend pair.
As such, im expecting the re-test to happen today to touch the purple area then immediate bounce up higher n stronger.
Cheers!

CADJPY - trading idea for todayMorning everyone!
This is one of the setup i have for cadjpy
Im looking for today retracement towards the purple area then a bounce from there to go upside even further.
If the retracement doesn't happen, then i shall wait for a breakout above the grey area before entering a trade upwards.
Thank you!
Cheers and stay safe!

Nicely cute signal for CADJPY buyersI would expect an increase in price for CADJPY, Let's see what will happen.
...Take it into the consideration anything can be possible to happen, if it breaks down the support level this idea would be failed.
You never quite know where the next big wave or gust of wind is coming from, but you know it is out there.


CADJPY, 4hr timeframe, bearish divergence in descending channelHello my friends,
I found something interesing in CADJPY pair just now. It looks like this pair forming a small bear flag inside a descending channel on 4hr timeframe.
Previously i took a buy position on this pair but i closed it on entry as it is going sideways for some time and no power in going up.
Price already broken below the channel with a solid candle in the last 4hr candle close. We could expect price to continue going down from this point as there is another zone which acted as resistance. Noticed there is also 50-EMA at this zone so we could say this is an area of confluences.
Sell CADJPY 80.05
Stop loss 80.45
Take profit 1 @79.55
Take profit 2 @79.05
Risk only 1-2% of your equity
Use proper risk management
Good luck

CADJPY - BEARISH BIAS (1:1 RISK REWARD)CAD - BEARISH
1️⃣ WTI oil prices extended the decline in the morning trade in the US, falling more than 2% to below $42 per barrel amid increasing doubts over a recovery in fuel demand after the Fed painted a gloomy outlook for the US due to the coronavirus crisis.
2️⃣ OPEC said that a second prolonged wave of the coronavirus is a major risk for the recovery in the oil market.
JPY - BULLISH
1️⃣ Investors moved into the safe-haven Yen as minutes from the Federal Open Market Committee revealed concerns about the US economic recovery.
=====
TECHNICAL
=====
- We shorting this pair on breaking of current support level in M30 chart + SMA100 area.
- CADJPY in bearish zone.
=====
RISK TO THIS TRADE
=====
- This trade tends to hit stop loss if current market sentiment switch to risk appettite mode.
=====
MONEY MANAGEMENT
====
- Please use only 1-2% risk per trade from your equity.

CAD/JPY: short TRADEall options gathered, TRADE generated
as the latest price action suggest topping process, the wide stop is to avoid from getting caught in a spike in case happens.
you may consider closing only a portion at the target and let some to run lower than the target of this TRADE
good luck

CADJPY, 4hr timeframe, bullish divergence with flag patternHello my friends,
Today I saw some good setup on CADJPY. This pair currently in bullish trend after it broken through 80.00 psychological resistance and goes to 80.90 level, it finally exhaust and then come down for a breather.
In my opinion, price made a bullish flag pattern during it downwards movement. Price then finally broken above the resistance and currently retesting it as a support.
I think we could see some more upwards movement from this pair as there is also bullish divergence on stochastic.
Buy CADJPY 80.20
Stop loss 79.80
Take profit 1 @80.60
Take profit 2 @81.00
Take profit 3 @81.40
Use proper risk management
Only risk 1-2% of your equity
Disclaimer: I've been buying CADJPY since 80.20
Good Luck


CAD/JPY Technical Analysis
The counter has recovered from the lows with a strong V-shaped rally.
It has now crossed a critical resistance level of 80.162.
The structure resembles a bearish shark pattern and we expect the pair to rally to the completion zone for now.

CADJPY Long Trade PlanHello traders, here is the analysis for CADJPY. NOTE please do your own analysis before taking the trade. Let me know if you guys have any questions in the comment section. If you guys like my analysis please hit like. Thanks.

CADJPY 15 Min Structure ShortJust shorted CADJPY. Price seems to have made a lower high on the 15 min and there was a double top as well. This sell goes well with my 4hr bias for me to wait for it to drop to the 4hr higher low to go long. 1-3RR of course. Move stop to break even when price reaches 1-1RR.

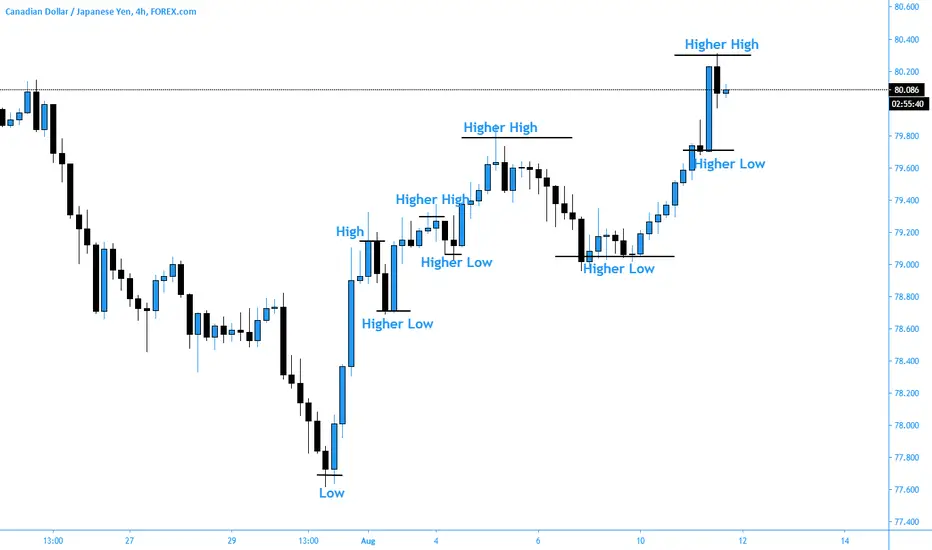
CADJPY Making Bullish StructureCJ is making beautiful bullish market structure. CJ just made a higher high and is now pulling back for a higher low. Going to wait for price to either make a double bottom at the previous higher low or wait for CJ to break the higher high and retest for an entry. Target 1-3 RR minimum of course!
CADJPY, daily timeframe, Bearish Flag trade setupHello my friend,
There is a nice trade setup in CADJPY which could give us a worthy RR.
I notice a bearish flag on the daily timeframe of CADJPY. Price already broken below the support as well. Right now price retrace up to 61.8 fibonacci level and this is actually a nice area to try selling it. I am going to play patiently on this pair and waiting for price to retest until 79.55 area as there are 78.6 fibonacci retracement and 200-EMA on that place as well.
I am setting a pending sell order for this pair.
Sell CADJPY 79.55
Stop loss 80.25
Take profit 1 @78.70
Take profit 2 @77.85
Take profit 3 @77.00
