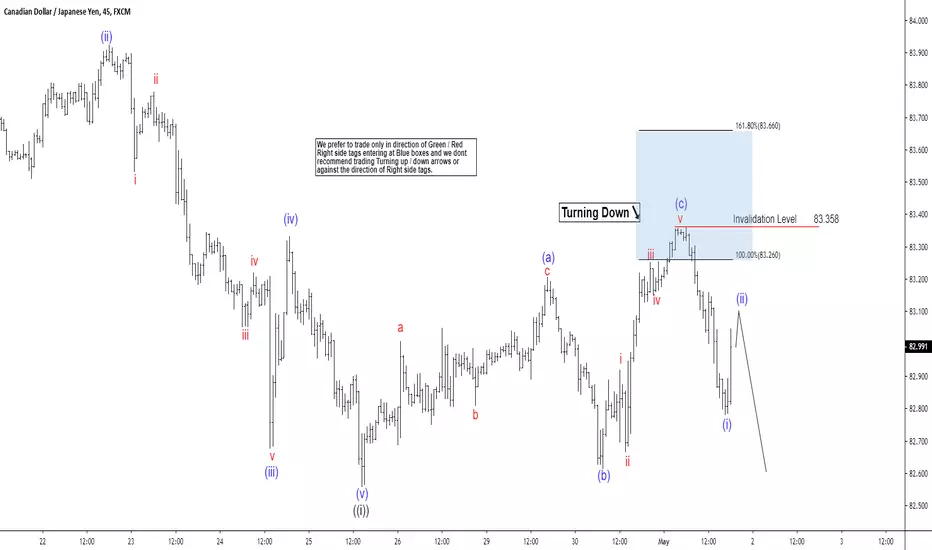
Elliot Wave View: Impulsive Decline in CADJPYShort Term Elliott Wave view in CADJPY calls the bounce to 84.37 on April 17, 2019 as wave 2. The pair is currently in wave 3 lower and the internal subdivides as an impulse Elliott Wave structure. Down from 84.37, wave (i) ended at 83.49, wave (ii) ended at 83.925, wave (iii) ended at 82.66, wave (iv) ended at 83.33, and wave (v) ended at 82.53. This 5 waves decline ended higher degree wave ((i)) of 3. Pair is currently in wave ((ii)) of 3 correction and the internal subdivides as a Flat Elliott Wave structure.
A Flat is an ABC structure with subdivision of 3-3-5. Up from 82.53, we can see wave (a) ended at 83.2 and subdivides in 3 waves. Wave (b) ended at 82.59, and wave (c) ended at 83.35 peak. The blue box of 83.26 – 83.67 shows 100% – 161.8% fibonacci extension of wave (a)-(b) was the area where it was expected to end wave ((ii)). More importantly however, as far as the invalidation level of 83.35 stays intact, expect the bounce to fail and pair to extend lower.
Cadjpytrade
long CADJPYwe had good first impulse to the upside and now we going through correction. As soon as we break the trend line and find good price action we will enter.
please trade with good risk management.


READY TO CATCH SOME PIPS ON CADJPY?Good buy opportunity on this pair.
I have marked the entry, stop loss and take profit.
Capital risked: 1%
Risk to Reward - 1:2
Be alert and pay attention to the simplicity and similarities in the setups. Your mind is a sucker for habit so you can turn your technical analysis into one.
Happy trading all! :)
Malika K


CAD/JPY: Buy After BreakDown !!BUY & SELL Above Given Chart or
You Can Also set Own Risk reward.
Let see what Will be Next Move.
Warning- I m Not a Financial Advisor this idea Only For Educational Purpose Only.
Thank You !!

CAD/JPY: Buy After Breakout !!BUY & SELL Above Given Chart or
You Can Also set Own Risk reward.
Let see what Will be Next Move.
Warning- I m Not a Financial Advisor this idea Only For Educational Purpose Only.
Thank You !!

CadJpy sell trade Long term trend resumeHi there,
Price making LL and LH again , it came to 78.6% fib level. There divergences as well.
Small risk and large gain possible.
161.8 fib extension is the exit.
Good Luck! :-)


CADJPY In Selling ZoneCadjpy Is near to trend line support+ 200 Days EMA and near to important support. Risk Reward Ration is 1:1


CADJPYCAD JPY RESISTING ON FIB LEVEL 71.00% WAITING FOR RE-TRACEMENT THEN WE GO SHORT
RESISTANCE LEVEL: 83.310
TARGET LEVEL: 82.320

CAD/JPY: Buy & Sell Trade setup !!BUY & SELL Above Given Chart or
You Can Also set Own Risk reward.
Let see what Will be Next Move.
Warning- I m Not a Financial Advisor this idea Only For Educational Purpose Only.
Thank You !!

CADJPY tested previous swing low support now its resistance.CADJPY tested previous swing low support now its resistance.

CADJPY bearish speculationExpecting bearish movement FX:CADJPY if we break the bearish flag. lets wait and see !

CADJPY BASELINE CHARTSEEING THE TREND BE HIT AND THE RETEST ALREADY DONE.
LOOKING FOR THE FALL AND THE TEST IN BETWEEN THE ZONES OF 82.961 AND 82.899
LOOKING FOR THIS PUSH DOWN RIGHT IN BETWEEN THE 61.8 AND THE 78.6 AREA.

CADJPY came to resistance zone. CADJPY came resistance zone. It is actually formed tweezer top candlestick pattern. And fibo 50% retracement.

CADJPY - SELL THE BREAK - DONT MISS ITSee previous analysis
PLEASE SUPPORT THE MOVEMENT WITH YOUR LIKES, COMMENTS AND FOLLOW FOR MORE


#CADJPY rise has come to an end?We think that the recent advances in cadjpy have come to an end for several reasons
1. The previous weekly candle is a Doji candle that means it can indicate a reversal of a trend.
2. The price of cadjpy is currently close to resistance called Senkou Span (Ichimoku indicator)
3. In the daily chart, the cadjpy rose until it touched a moving average 200 and failed to break above it and started to fall a sign of weakness
Sell CAD/JPY:
Entry Price: 84.17
Stop Loss: 84.65
take Profit: 83.00
