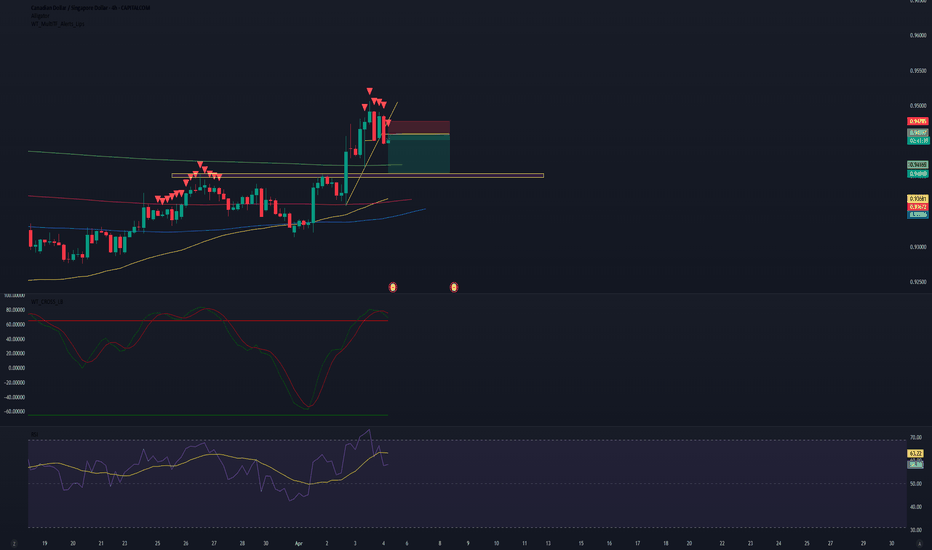
CAD/SGD SHORT Investment Opportunity
Hello everyone, I am Andrea Russo, a Forex Trader, and today I want to share with you a trading strategy that I am currently following on the CAD/SGD currency pair. This analysis is designed to help traders better understand the dynamics of this pair and optimize their trades.
CAD/SGD SHORT Position Analysis
I decided to enter a SHORT position on CAD/SGD at the level of 0.9460, with a profit target (Take Profit) set at 0.9405 and a stop loss at 0.9479. This setup was chosen after careful technical and fundamental analysis.
Strategy Rationale
Technical Analysis: The chart shows significant resistance around the level of 0.9470, which has rejected the price several times in the past. In addition, momentum indicators suggest a possible downside.
Fundamental Analysis: Recent economic news points to weakness in the Canadian dollar against the Singapore dollar, making this SHORT position particularly attractive.
Risk Management
Risk management is key in any trade. With a stop loss of 0.9479, the risk is well defined and limited. The risk/reward ratio is favorable, with the potential for gains greater than losses.
Trader Tips
Monitor the Market: It is important to follow economic news and events that could affect the CAD or SGD.
Adjust Strategy: If the market moves against the position, consider closing the trade or reviewing the stop loss and take profit levels.
Discipline: Always stick to your trading plan and do not let emotions influence your trading.
Conclusion
This SHORT position on CAD/SGD represents an interesting opportunity for traders looking to take advantage of the current market conditions. Always remember to do your own analysis and trade with caution.
Happy trading everyone! Andrea Russo, Forex Trader
CADSGD
CADSGD ____ INCOMING BULLISH MOVEHello Traders,
We have a situation whereby there are multiple confluences for this bullish move.
To start with, on the monthly chart, we can see that price is retracing while forming an 'M' pattern which will complete at the monthly demand orderblock which is a 'W' pattern. This simply means that we should expect bullish price movement.
On the weekly chart, we have an unmitigated demand zone and the price is approaching this level while creating an 'M' pattern. The expectation is that the price will mitigate this zone and rally.
On the daily timeframe, you will notice there is a demand orderblock that is yet to be mitigated. This orderblock is also in alignment with the equilibrium price level of the weekly demand orderblock.
This pair is on my radar and my alert has been set. Waiting for the price to trade into that zone.
Follow for more updates like this.
Cheers,
Jabari
CADSGD, Descending Triangle For A Big DropCAD/SGD - The price dropped below the lower boundary of the descending triangle.
The target is around 1.00
CADSGD Buy SignalPattern: Channel Up on 1D.
Signal: Buy as the price broke above the (former) 1.03170 Resistance as well as the Lower Highs trend-line.
Target: 1.0400 (the next Resistance).
** Please support this idea with your likes and comments, it is the best way to keep it relevant and support me. **
CAD/SGD - A nice LONG direction setup*** DISCLAIMER ***
Any and all commentary, research, analyses, or other information published by me on this website are provided as general market commentary, and do not constitute investment advice nor a solicitation and there are no guarantees associated with them. I am not liable for any loss or damage, including without limitation, any loss of profit, which may arise directly or indirectly from use of or reliance on such information.
****************************
At the moment we are in the lower bound of a 10 months old channel. Now, there is a nice long direction setup with also a nice R:R, so if I will see a bullish pattern as confirmation, I'll go long.
CADSGD: Medium and long term Sell Opportunity.The pair has been trading within a 1D Channel Down since August/ September peak (RSI = 52.914, MACD = 0.000) and is currently testing the 1D MA50. Even though the Lower Highs are clear, the pattern lacks the latest Lower Low and we are taking this opportunity to go on a medium term short towards 1.0300. Long term trades may wait for an even bigger sell opportunity towards 1.01000 (1W Support) if the Channel Down breaks downwards.
** If you like our free content follow our profile (www.tradingview.com) to get more daily ideas. **
Comments and likes are greatly appreciated.


