$Cake to 30 $ USD?Cake has a build-up period of 65 days and a triangle has formed. Assuming bitcoin continues to rally up, the triangle is targeting $ 22, $ 26 and $ 30.
Otherwise, if cake falls below $ 16.90, the price action will take Cake to support the bullish channel at $ 15.
Take your forecasts, I am currently still doing cake staking
Cakebtc

CAKEBTC GREAT BUY OPPORTUNITY ON 1D CHARTCAKE - just burned $104 Million worth of tokens today and website is just upgrading. Just looking how BNB is exploding right now, my next biggest pick for long term buy will be CAKE.
See you at the top!
Thanks.

✴️ CAKE/USDTCAKE has been trading in the yellow zone of the MMR band very severely, but on-chain data analysis shows the downward moves have started to come to an end. I expect CAKE to begin reclaiming its previous prices on the long time frame charts by retesting the resistances at 18.90, 21.00, and 22.60.

CakebtcHi friends. We are in the point that we set long order with min risk. If we don't see high volatility in btc price ( Especially the drop in prices) we see pump in cake price soon. If the btc price drop so high may we see triangle turn to falling wedge. But the important thing is that the price is very reasonable for entry with a growth potential of over 150%. We can set sl order below 18$

CAKE/USDTCAKE is currently performing in the Ascending Triangle if it breaks the Ascending Triangle then CAKE next target is ATH, If the market continues like this then it will complete its target soon...


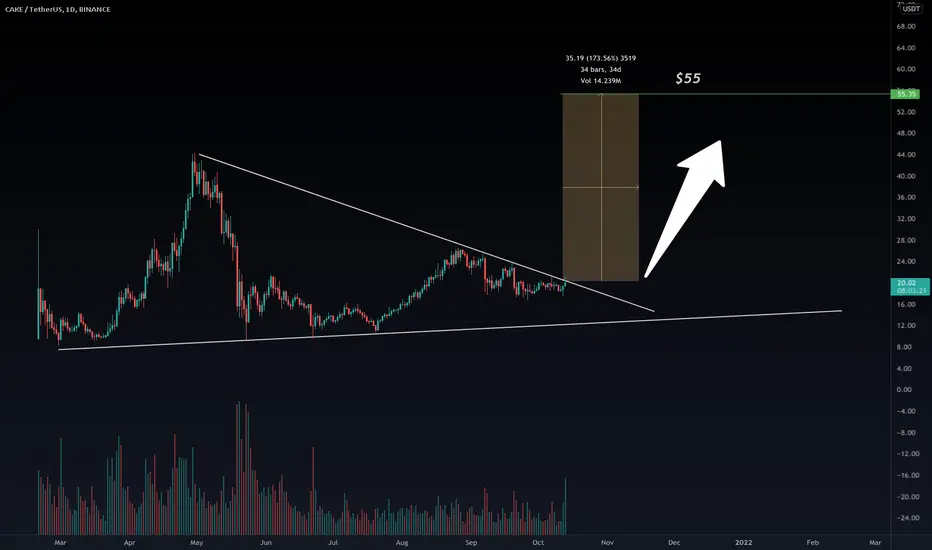
CAKE, Bitcoin, Daily Chart, Trading signal, BTC $Cake daily timeframe set up for a breakout from resistance. Waiting for a confirmation to flip resistance to support. Target 55
CAKE MASSIVE GAINS INCOMING? BUY HERE$CAKE has been in a down trend since April and it is now breaking out with volume. All the indicators are showing bullish signs with every tf flipping into bullish from all smaller timeframes to the htfs till 12 hours are now bullish.
OBV turning green, MACD bullish, RSI holding and breaking downtrend, trendline broken and bullish harmonics.
I am taking entry here at market price $20.7 and will tp it till 22.65 - $34
Also, alot of developments has been going on CAKE with their NFT marketplace launchin I was expecting this breakout to happen soon and looks like we're ready now!
Good Luck.
If you liked this idea give a like and a follow :-)

PancakeSwap (CAKE) - October 12Hello?
Welcome, traders.
By "following", you can always get new information quickly.
Please also click "Like".
Have a nice day.
-------------------------------------
(CAKEUSD 1W Chart) - Mid-Long-Term Perspective
Above the 9.0760290 point: the uptrend expected to continue
15.1757179-16.1961041 or more: Expected to create a new wave.
(1D chart)
First resistance section: 19.0812658-20.0044522
Second resistance section: 29.5050311-32.1525450 (psychological resistance section)
First support section: 15.1757179-16.1961041
Second support section: 9.0760290-10.8786252
It is important to maintain the price above the first resistance section.
Therefore, it is necessary to check if the price can be maintained above the first support level.
If it falls from the first support zone, it may touch the second support zone, so trade cautiously.
-----------------------------------------------------
(CAKEBTC 1W Chart) - Mid- to long-term perspective
1652 Satoshi-2070 Satoshi or more: Expected to continue upward trend
2687 Satoshi-2903 Satoshi or higher: Expected to create a new wave.
(1D chart)
First support section: 2687 Satoshi-2903 Satoshi section
Second support section: near the 1652 Satoshi point
First resistance section: 4174 Satoshi-4837 Satoshi section
Second resistance section: 6578 Satoshi-7068 Satoshi section
------------------------------------------
We recommend that you trade with your average unit price.
This is because, if the price is below your average unit price, whether it is in an uptrend or in a downtrend, there is a high possibility that you will not be able to get a big profit due to the psychological burden.
The center of all trading starts with the average unit price at which you start trading.
If you ignore this, you may be trading in the wrong direction.
Therefore, it is important to find a way to lower the average unit price and adjust the proportion of the investment, ultimately allowing the funds corresponding to the profits to regenerate themselves.
------------------------------------------------------------ -----------------------------------------------------
** All indicators are lagging indicators.
Therefore, it is important to be aware that the indicator moves accordingly with the movement of price and volume.
However, for the sake of convenience, we are talking in reverse for the interpretation of the indicator.
** The MRHAB-O and MRHAB-B indicators used in the chart are indicators of our channel that have not yet been released.
(Because it is not public, you can use this chart without any restrictions by sharing this chart and copying and pasting the indicators.)
** The wRSI_SR indicator is an indicator created by adding settings and options to the existing Stochastic RSI indicator.
Therefore, the interpretation is the same as the traditional Stochastic RSI indicator. (K, D line -> R, S line)
** The OBV indicator was re-created by applying a formula to the DepthHouse Trading indicator, an indicator disclosed by oh92. (Thanks for this.)
** Support or resistance is based on the closing price of the 1D chart.
** All descriptions are for reference only and do not guarantee a profit or loss in investment.
(Short-term Stop Loss can be said to be a point where profit and loss can be preserved or additional entry through split trading. It is a short-term investment perspective.)


CAKEUSDT 1DIn daily timeframe, CAKEUSDT has a dynamic resistance in front of it, which in case of breakout we could see higher prices.
targets : 21, 26, 36 and 45
Support : $ 11, $ 14 and $ 17.5
Invest in the future

CAKEUSDT Technical Analysis
⏳ Spot
💎 CAKEUSDT has formed a symmetrical triangle. After the breakout it has gone for e retest and we see several rejections already. It is expected that it continues to go higher.
🌐 Tradingview
🏁 Short & Medium Term
💵 Invest Only 5% of your Portfolio
🎳 Entry at Market or at 18.50
☕️ TP1 20.90
🍺 TP2 24.00
🍻 TP3 28.00
🍾 TP4 _____
🍷 TP5 _____
🍸 TP6 _____
🍹 TP7 _____
🎁 TP8 _____
🚫 SL 17.00
Good Luck 🎲
Check the Links in Description and If you LIKE this analysis, Please support our page and Ideas by hitting the LIKE 👍 button. ❤️ Your Support is really appreciated! ❤️
Traders, if you have your own opinion about it, please write your own in the comment box. We will be glad for this.
Feel free to request any pair/instrument analysis or ask any questions in the comment section below.
We will have more FREE forecasts in TradingView soon
Have a Profitable Day

NeutralHi guys, we are in a triangle and there are 49 days left until the exit time, but due to the burning of the cake currency token, this may happen sooner, so start buying a step between $ 16 and $ 19 is suitable for buying a step. Goals are listed on the chart

CAKEUSDT Technical Analysis
⏳ Spot
💎 CAKEUSDT Has formed a Flag pattern. the price has got rejected from the support zone. The large green candle shows us that the price has potential to go higher.
🏁 Short & Medium Term
💵 Invest Only 5% of your Portfolio
🎳 Entry at market or 16.15
☕️ TP1 20.45
🍺 TP2 24.25
🍻 TP3 28.30
🍾 TP4 _____
🍷 TP5 _____
🍸 TP6 _____
🍹 TP7 _____
🎁 TP8 _____
🚫 SL 15.30
Good Luck 🎲
Check the Links in Description and If you LIKE this analysis, Please support our page and Ideas by hitting the LIKE 👍 button. ❤️ Your Support is really appreciated! ❤️
Traders, if you have your own opinion about it, please write your own in the comment box. We will be glad for this.
Feel free to request any pair/instrument analysis or ask any questions in the comment section below.
We will have more FREE forecasts in TradingView soon
Have a Profitable Day

CakebtcHi. I think wave count is completed and now we should prepair to jump to +70 % profit. We wait to break up.

CAKE/BTC buy opportunityHi followers,
CAKEBTC formed nice triangle which already broken to the up side,
Then retested the broken area again, with higher lows formed, suggesting more up side potential move.
Don't forget to manage your risk! 👌
Good luck and trade with care 🙏
If you like my content - 👍 Like, 💬 comment, 👆 follow and 👉 share!
❗❗❗
Disclaimer: This information is not a recommendation to BUY or SELL. It is to be used for educational purposes only!

Cake to 36.86 $ USD?In my last analysis we were able to observe a triangle that was invalidated as a result of the market crash, however not everything is negative. This fall managed to show us a bullish channel in #CAKE which is very positive.
Within this new bullish channel we have a new triangle that should break no later than the beginning of October and would have as its main target $ 31 and then $ 36.86.
If the market remains bullish, I have no doubt that Cake will have a big rally, assuming that we are days away from its first anniversary and that every Monday there is a burning of tokens that represents 1% / 3% of the current supply. #Cake #Pancakeswap

CAKE/USD - Correction continues, for now. 😅CAKE did we, very well early this year. However since May CAKE is correcting and I don't see this changing anytime soon or not until we penetrate the resistance. :)
For now this chart is bearish and I don't exclude a re-test of support before any sustained gains can be achieved. For that we also need the overall market to heat up. That will help CAKE.
The indicators also show mixed signals right now, so best to stay away from this right now.
Like and follow if you liked this idea!

CAKE/USDT Ready for another 100% from here..?#CAKE/USDT TA update:-
$CAKE currently trading at $20.5
Bullish as per chart.
Buying above $18.5-$20.5
Targets:- $27/$43/ATH
Stop Loss:- If any daily candle closed below $18
Support:- $18/$11
Resistance:- $27/$43
#DYOR

CAKE On The POC !CAKE is on the support of POC line. MA200 also supports it under this area. We can expect it to move up in the coming days.
⚠ BTC Dominance is on support too. So, LONG trades on alt coins can be high risk now. Don't forget to set stop-loss under the MA200.
📆 Fundamental: NFT Marketplace Launch ( 22 Sep )

PancakeSwap (CAKE) - September 12Hello?
Welcome, traders.
By "following", you can always get new information quickly.
Please also click "Like".
Have a nice day.
-------------------------------------
(CAKEUSD 1W Chart)
It remains to be seen if the price can be maintained above the 15.1757179-16.1961041 segment.
If it declines from the 9.0760290 point, there is a possibility of entering the mid- to long-term investment area, so careful trading is required.
If the price holds above the 20.0044522 point, it is expected to create a new wave.
(1D chart)
If the price holds above the 19.0812658 point, it is expected that the uptrend will continue.
However, the uptrend is expected to accelerate only when it rises above the 22.7629293 point and breaks out of the downtrend line.
If it falls from the 15.1757179-16.1961041 section, you can touch the 9.0760290-10.8786252 section, so you need to trade carefully.
-------------------------------------
(CAKEBTC 1W chart)
It remains to be seen if the price can sustain above the 0.0002687-0.0002903 interval.
If it falls in the range of 0.0001652-0.0002687, it is highly likely to enter the mid- to long-term investment area, so careful trading is required.
(1D chart)
We need to see if we can find support at the 0.0004174-0.0004445 zone and move above the 0.0005074 point to break out of the downtrend line.
If the price holds above the 0.0005074 point, I would expect resistance in the 0.0006578-0.0007068 range.
If it falls in the 0.0003450-0.0003850 section, it can touch the 0.0002903 point or less, so Stop Loss is required to preserve profit and loss.
However, you can touch the 0.0002304-0.0002903 section and rise, so you need to think about how to respond.
------------------------------------------
We recommend that you trade with your average unit price.
This is because, if the price is below your average unit price, whether it is in an uptrend or in a downtrend, there is a high possibility that you will not be able to get a big profit due to the psychological burden.
The center of all trading starts with the average unit price at which you start trading.
If you ignore this, you may be trading in the wrong direction.
Therefore, it is important to find a way to lower the average unit price and adjust the proportion of the investment, ultimately allowing the funds corresponding to the profits to regenerate themselves.
------------------------------------------------------------ -----------------------------------------------------
** All indicators are lagging indicators.
Therefore, it is important to be aware that the indicator moves accordingly with the movement of price and volume.
However, for the sake of convenience, we are talking in reverse for the interpretation of the indicator.
** The wRSI_SR indicator is an indicator created by adding settings and options to the existing Stochastic RSI indicator.
Therefore, the interpretation is the same as the traditional Stochastic RSI indicator. (K, D line -> R, S line)
** The OBV indicator was re-created by applying a formula to the DepthHouse Trading indicator, an indicator disclosed by oh92. (Thanks for this.)
** See support, resistance, and abbreviation points.
** Support or resistance is based on the closing price of the 1D chart.
** All descriptions are for reference only and do not guarantee a profit or loss in investment.
Explanation of abbreviations displayed in the chart
R: A point or section of resistance that requires a response to preserve profits.
S-L: Stop Loss point or section
S: A point or section where you can buy to make a profit as a support point or section.
(Short-term Stop Loss can be said to be a point where profit and loss can be preserved or additional entry can be made through split trading. It is a short-term investment perspective.)
GAP refers to the difference in prices that occurred when the stock market, CME, and BAKKT exchanges were closed because they are not traded 24 hours a day.
G1 : Closing price when closed
G2: Opening price
(Example) Gap (G1-G2)

Cake to 25 $ USD?Cake is in a correction of approximately -70%, it has been in an accumulation phase since the end of May.
We can also see that it is below the 200 EMA and the volume has not increased significantly. So we need to break that 200 EMA at roughly $ 14 to see a bullish scenario.
If we assume that Bitcoin resumes its bullish path I see no doubt that Cake's next target is $ 25-$ 27.

PancakeSwap #CAKE to 31 $ ?After seeing how the target of $ 25 was perfectly met as I mentioned in my old publication, we can see again the formation of a triangle, which should break up at the end of this month, obtaining as a target $ 31 that would represent the 61.80% fibo of the May correction.
However, I believe that if the market remains bullish and we continue with the respective token burn, we will be able to see an even stronger momentum up to $ 36.86 which represents the 78.60% fibo.
Cake is undoubtedly one of my biggest bets in the remainder of the year and I hope to see it reach high prices, which I will share with you later in my next reviews.
