Cake / Usdtright now price trying to hold above important support , a little down to 18s and we are ready to go to next resistance at 27 $
stop will be daily fixed below support
Cakebtc

CAKE/USDT now 91% pure profit and still expecting more TPs#CAKE/USDT Profit Update:-
$CAKE currently trading at $21
And Our entry was $11 filled ✅
Now 91% pure profit within a month.
I am still expecting it will hit more TPs.
but I will suggest now you can free your principal amount and hold only Profit.
Entry was $11 ✅
TP1:- $21.50 ✅
TP2:- Pending
Support:- $18/$12
Resistance:- $27/$44
Please click like button and Appreciate my hard work.
Must follow me for latest crypto real time updates.
Thank you.

$CAKE, Displaying highest buying volume since May..$CAKE
UCTS printed a 1D Buy yesterday as its crossing above ~42k sats level..
Displaying highest buying volume since May..
Willing to see if its able to show continuation (volume/flip) on the following hours/days
#CAKE

PancakeSwap (CAKE) - August 10Hello?
Welcome, traders.
By "following", you can always get new information quickly.
Please also click "Like".
Have a nice day.
-------------------------------------
(CAKEUSD 1W Chart)
If the price is maintained above the 15.1757179-16.1961041 section, it is expected to create a new wave.
(1D chart)
If the price is maintained above the 20.0044522 point, we expect the uptrend to continue.
If it goes down, we should see support and see if we can move up the key zone of 10.8786252-16.1961041.
'How far will it rise...'
'If you know this, you will be able to realize profits...'
So, if you look at my chart, unfortunately, you can't tell.
Setting a target point is a good habit for good trades.
However, it must be a target point that you set yourself.
A goal set by someone else is practically meaningless because it's likely to be unbearable until you reach that goal, and your goal point may change along the way.
If you dare to set the target section on this chart, you can set it as the 38.3519782-40.8453058 section that forms the high point section.
Will you be able to climb all the way up at once to reach the goal section?
Will it be able to overcome the volatility that shakes up and down to the target section set by others?
“Where will the purchase principal be recovered from?”
You need to think about this.
'How to increase the number of tokens remaining by recovering the purchase principal'
-------------------------------------
(CAKEBTC 1W chart)
There is nothing to tell from this chart.
However, if the price is maintained above the 26870 Satoshi-29030 Satoshi section, it is expected that the upward trend will continue.
(1D chart)
If the price holds above the 34500 Satoshi point, it is expected to turn into an uptrend.
------------------------------------------
We recommend that you trade with your average unit price.
This is because, if the price is below your average unit price, whether it is in an uptrend or in a downtrend, there is a high possibility that you will not be able to get a big profit due to the psychological burden.
The center of all trading starts with the average unit price at which you start trading.
If you ignore this, you may be trading in the wrong direction.
Therefore, it is important to find a way to lower the average unit price and adjust the proportion of the investment, ultimately allowing the funds corresponding to the profits to regenerate themselves.
------------------------------------------------------------ -----------------------------------------------------
** All indicators are lagging indicators.
Therefore, it is important to be aware that the indicator moves accordingly with the movement of price and volume.
However, for the sake of convenience, we are talking in reverse for the interpretation of the indicator.
** The wRSI_SR indicator is an indicator created by adding settings and options to the existing Stochastic RSI indicator.
Therefore, the interpretation is the same as the traditional Stochastic RSI indicator. (K, D line -> R, S line)
** The OBV indicator was re-created by applying a formula to the DepthHouse Trading indicator, an indicator disclosed by oh92. (Thanks for this.)
** See support, resistance, and abbreviation points.
** Support or resistance is based on the closing price of the 1D chart.
** All descriptions are for reference only and do not guarantee a profit or loss in investment.
Explanation of abbreviations displayed in the chart
R: A point or section of resistance that requires a response to preserve profits.
S-L: Stop Loss point or section
S: A point or section where you can buy to make a profit as a support point or section.
(Short-term Stop Loss can be said to be a point where profit and loss can be preserved or additional entry can be made through split trading. It is a short-term investment perspective.)
GAP refers to the difference in prices that occurred when the stock market, CME, and BAKKT exchanges were closed because they are not traded 24 hours a day.
G1 : Closing price when closed
G2: Opening price
(Example) Gap (G1-G2)

Shorting Alts for BTC RallyQuite simple - when Bitcoin goes on a bull run like we're seeing now, bearing in mind it broke past the resistance of the MA 200 the alts will take strain until Bitcoin settles in a new range and then the alts will begin to regain momentum.
Sell into BTC, wait for BTC to range, then buy back into alts.
My chart shows the divergence between Bitcoin and CAKE/DEGO.
BINANCE:CAKEBTC
BINANCE:DEGOBTC
BINANCE:BTCUSDT


CAKEUSDT Is Moving in the Bullish Channel
Welcome back Traders, Investors, and Community!
Hi Traders, CAKEUSDT on H4 is moving along the Bullish channel.
⬆️Buy now or Buy at 14.90
⭕️SL @ 11.88
✅TP1 @ 18.48
✅TP1 @ 24.86
We will have more FREE forecasts in TradingView soon
❤️ Your Support is really appreciated!❤️
Have a Profitable Day

PancakeSwap (CAKE) - July 18Hello?
Welcome, traders.
If you "follow", you can always get new information quickly.
Please also click "Like".
Have a good day.
-------------------------------------
(CAKEUSD 1W Chart)
If the price holds above the 9.0760290 point, it is expected to maintain an uptrend.
However, since the support section is weak, it is recommended that the price rise above the 16.1961041 point and maintain the price.
(1D chart)
If the price is maintained in the 9.3962999-17.7234416 range, it is expected to turn into an uptrend.
However, if you touch the 9.3962999-10.8786252 section, you have to watch for a sharp rise.
If it falls from the 9.3962999 point, it is expected to enter the mid- to long-term investment area, so you should also think about it.
In order to continue the uptrend, the price must rise above the 20.4991555 point to sustain the price.
-------------------------------------
(CAKEBTC 1W chart)
If the price is maintained above the 26870 satoshi-34500 satoshi range, it is expected that the upward trend will continue.
(1D chart)
If the price is maintained in the 40530 Satoshi-53580 Satoshi section, it is expected that the upward trend will continue.
If it falls from the 40530 satoshi point, it can touch the 20950 satoshi-27480 satoshi section, so Stop Loss is required to preserve profit and loss.
However, since you can touch the 26870 Satoshi-34500 Satoshi section and rise, you should also think about preparing for it.
------------------------------------------
We recommend that you trade with your average unit price.
This is because, if the price is below your average unit price, whether it is in an uptrend or in a downtrend, there is a high possibility that you will not be able to get a big profit due to the psychological burden.
The center of all trading starts with the average unit price at which you start trading.
If you ignore this, you may be trading in the wrong direction.
Therefore, it is important to find a way to lower the average unit price and adjust the proportion of the investment, ultimately allowing the funds corresponding to the profits to regenerate themselves.
------------------------------------------------------------ -----------------------------------------------------
** All indicators are lagging indicators.
Therefore, it is important to be aware that the indicator moves accordingly as price and volume move.
However, for the sake of convenience, we are talking in reverse for the interpretation of the indicator.
** The wRSI_SR indicator is an indicator created by adding settings and options to the existing Stochastic RSI indicator.
Therefore, the interpretation is the same as the traditional Stochastic RSI indicator. (K, D line -> R, S line)
** The OBV indicator was re-created by applying a formula to the DepthHouse Trading indicator, an indicator disclosed by oh92. (Thanks for this.)
** See support, resistance, and abbreviation points.
** Support or resistance is based on the closing price of the 1D chart.
** All descriptions are for reference only and do not guarantee a profit or loss in investment.
Explanation of abbreviations displayed in the chart
R: A point or section of resistance that requires a response to preserve profits.
S-L : Stop Loss point or section
S: A point or section where you can buy to make a profit as a support point or section
(Short-term Stop Loss can be said to be a point where profit and loss can be preserved or additional entry can be made through split trading. It is a short-term investment perspective.)
GAP refers to the difference in prices that occurred when the stock market, CME, and BAKKT exchanges were closed because they are not traded 24 hours a day.
G1 : Closing price when closed
G2: Opening price
(Example) Gap (G1-G2)

$CAKE/BTC 1D (Binance Spot) Symmetrical triangle breakoutPanCakeSwap broke-out bullish, let's enter on 100EMA / descending Trend-Line retest.
Current Price= 0.0004450
Buy Entry= 0.0004228 - 0.0003888
Take Profit= 0.0005084 | 0.0005709 | 0.0006713
Stop Loss= 0.0003234
Risk/Reward= 1:1.25 | 1:2 | 1:3.22
Expected Profit= +25.28% | +40.69% | +65.43%
Possible Loss= -20.31%
Fib. Retracement= 0.5 | 0.618 | 0.786
Margin Leverage= 1x
Estimated Gain-time= 2 months

$CAKE, Everything is pumping or looking good$CAKE
Everything is pumping or looking good but look for flips as safer entries..
UCTS 1D Buy printed on this one as well
#CAKE


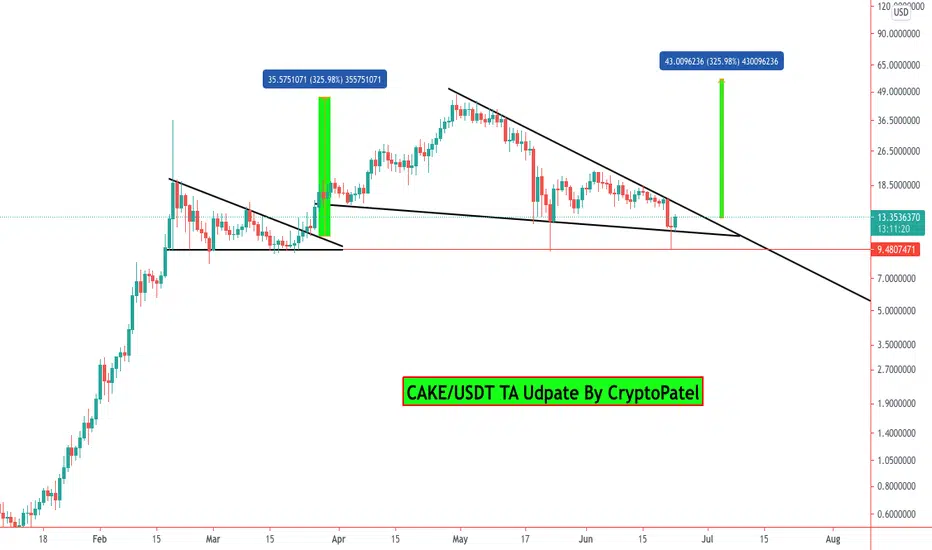
CAKE/USDT Ready for $60 mean 300% from here..?#CAKE/USDT TA Update:
$CAKE looking good at this level.
Yesterday Dumped and Instant recovered.
So I am bullish on $CAKE
Entry:- $11-$13.35
Targets:- $21.50/$27.40/$42/$60
SL:- If candle close below $10.50
Waiting for Breakout.
If break out $16 then Super Bullish.
Support:- $11
Resistance:- $21/$27/$42
Please click like button and Appreciate my hard work.
Must follow me for latest crypto real time updates.
Thank you.
$CAKE, Testing/sitting on ~40k sats support level $CAKE
Testing/sitting on ~40k sats support level on the 35day since latest UCTS 1D Sell signal (~30%)
Current level matching .5/.618 fib levels from latest impulse. If its unable to hodl, then looking for ~32k sats
Not taking any spot positions till next 1D Buy
#CAKE

CAKEBTC How do you like your CAKE?CAKE continues to bounce off the support marked in white.And with NFT auctions few days away... it is a safe bit for me to ride.
If CAKE breaks the support, it is an easy stop loss upon retest.
If CAKE's next leg is up, then the target is set as per the previous leg down.

PancakeSwap (CAKE) - June 14Hello?
Welcome, traders.
By "following", you can always get new information quickly.
Please also click "Like".
Have a good day.
-------------------------------------
(CAKEUSD 1W Chart)
Careful trading is required as the chart has not yet completed a single wave.
Accordingly, it is important to keep the price above the 15.1757179-20.0044522 interval.
(1D chart)
It needs to find support at least at the 17.7234416-20.4991555 range to convert into an uptrend.
If it falls from the 15.1757179 point, you can touch the 9.3962999 point, so you need a Stop Loss to preserve your profit and loss.
This is an important section with several lines passing through the section 15.1757179-20.4991555.
If it climbs in this section, I expect it to touch above the 26.0505834 point.
However, if it does not rise above the 26.0505834 point, it is highly likely that the downtrend will continue, so trade cautiously.
-------------------------------------
(CAKEBTC 1W chart)
Careful trading is required as the chart has not yet completed a single wave.
Accordingly, it is important to keep the price above the 0.0002687-0.0003450 range.
(1D chart)
We'll have to wait and see if we can cross the 0.0004053-0.0005358 section.
In particular, we should see if we can break out of the downtrend line.
If it falls from the 0.0004053 point, a Stop Loss is required to preserve profit and loss.
However, it can touch the 0.0002903 point and move up, so you need to trade cautiously.
------------------------------------------
We recommend that you trade with your average unit price.
This is because, if the price is below your average unit price, whether it is in an uptrend or in a downtrend, there is a high possibility that you will not be able to get a big profit due to psychological burden.
The center of all trading starts with the average unit price at which you start trading.
If you ignore this, you may be trading in the wrong direction.
Therefore, it is important to find a way to lower the average unit price and adjust the proportion of the investment, ultimately allowing the funds corresponding to the profits to regenerate themselves.
------------------------------------------------------------ -----------------------------------------------------
** All indicators are lagging indicators.
Therefore, it is important to be aware that the indicator moves accordingly with the movement of price and volume.
However, for the sake of convenience, we are talking in reverse for the interpretation of the indicator.
** The wRSI_SR indicator is an indicator created by adding settings and options to the existing Stochastic RSI indicator.
Therefore, the interpretation is the same as the traditional Stochastic RSI indicator. (K, D line -> R, S line)
** The OBV indicator was re-created by applying a formula to the DepthHouse Trading indicator, an indicator disclosed by oh92. (Thanks for this.)
** See support, resistance, and abbreviation points.
** Support or resistance is based on the closing price of the 1D chart.
** All descriptions are for reference only and do not guarantee a profit or loss in investment.
Explanation of abbreviations displayed in the chart
R: A point or section of resistance that requires a response to preserve profits.
S-L: Stop Loss point or section
S: A point or section where you can buy to make a profit as a support point or section.
(Short-term Stop Loss can be said to be a point where profit and loss can be preserved or additional entry can be made through split trading. It is a short-term investment perspective.)
GAP refers to the difference in prices that occurred when the stock market, CME, and BAKKT exchanges were closed because they are not traded 24 hours a day.
G1 : Closing price when closed
G2: Opening price
(Example) Gap (G1-G2)

Bidding for CAKEI am working here on my perspective that best Alts to buy in a major dip (or bear market) I see are Alts that provides returns on staking or launchpads. Because eventually the more you HODL the higher the reward. And it becomes more affordable to accumulate them cheap for higher rewards.
Here comes CAKE with 77% rewards and 41% staked already.
Bid is placed at 1D 200EMA support.


$CAKE, breaking above 50k sats seems key from here..$CAKE as reference. (refreshing some charts drawings)
Looking for the next buy signal to hit, breaking above 50k sats seems key from here..


