long CAKE$CAKE bounced off the support level. Bullish movement to the resistance level at 3.48$ is likely to happen.
Cakeusdt

CAKEUSDT DThis is my analyse on CAKEUSDT. DAILY timeframe .
PLEASE Don't forgot risk and money management.
THANK YOU FOR YOUR TIME.
PLEASE BOOST AND FOLLOW..

Pancakeswap (CAKE/USDT) Close to Reclaim Levels Above $4Pancakeswap has been one of the popular crypto asset in the market. CAKE price has displayed acute strength ever since it formed its lows by the mid-June 2022. It was on its path to reclaim the lost levels, but the recent FTX-fiasco flipped the entire market flipped and fell into a deep bearish trap, from which the CAKE price is unable to make a comeback. However, the price is trying hard to set up a bullish outlook and hence is able to sustain above $3 despite extreme bearish pressure.
The price rebounded finely from the 0.236 FIB levels around $3.2 and consolidating finely just above these levels but constantly failing to surpass the levels at $3.5, hence has become a pivotal zone to clear. Once these are cleared the next leg up may uplift the price beyond 0.382 FIB levels close to $3.7, beyond which the possibility of reaching $4 may emerge before the end of the yearly close.
Besides, the volume has dropped miserably which may hinder the progress of the rally by lowering the pace. Therefore, CAKE price could have a bearish close provided bulls remain off-the-shore until the start of the fresh yearly trade.

quick CAKE scalpprice has formed an inverse head and shoulder and is squeezing to the trendline.
expecting a break and growth.

$CAKE, a long term gem.Back to early 2021, Pancake Swap was one of the most participated DEX. Volume, DAU and TVL growing make $CAKE sky-rocketed to $40.
Then, bear market and DeFi winter came (along with lots of exploit on BSC DeFi protocols) and $CAKE price heavily dumped to the bottom of $3.
In the last 2 months, $CAKE managed to bounce to $4, thanks to the market rally and some new Pancake Swap development. But the weekly candles growing weak, into a reversal pattern.
$CAKE will have to back test $3 level before bounce back higher in 2023.
Entry : $3.1-$3.3
Stoploss : $2.8
Target : $4.5 - $6 - $10 (longterm)

PancakeSwap CAKE price is trying to break up from downtrendThe CAKEUSDT price has been in a falling trend channel since April 2021.
In fact, almost immediately after "the hype CAKE" exited into the market, when the price of CAKE rose from $10 to $44 in a month, the search for a fair market price began.
Looking at the chart, we can see aggressive buying of CAKEUSD from $3
After, buyers of PancakeSwap twice time bought back the price from the critical $3.60 level, giving him the status of a "mirror"
Roughly speaking, we can say that a price zone of $3-5 is a zone of fair market price , which satisfies both buyers and sellers for the last six months.
Therefore, in case of positive developments in the cryptocurrency market, we can expect the CAKEUSDT price to exit the falling channel.
The first task of buyers is to break through and consolidate above $5.50.
If this condition is met, in the medium term, you can start dreaming about growth to the region $8.75 - 9
If the wave of negativity again covers the crypto market and the price of CAKE drops below $3.60, then it is not worth buying CAKE again before $2.90-3.
_____________________
Did you like our analysis? Leave a comment, like, and follow to get more

CAKE longCAKE broke trough the descending trendline. Asset broke trough the resistance level. Bullish movement to resistance level at 4.105 is expected to happen.
CAKEUSDT Elliott Waves Analysis Hello friends.
Please support my work by clicking the LIKE button👍(If you liked). Also i will appreciate for ur activity. Thank you!
Everything on the chart.
Entry: market and lower (perfect entry zone 3.5 - 3.2)
Target: 4.5 - 5.4 - 6.2
Main target zone: 6 - 6.5
after first target reached move ur stop to breakeven
Stop: ~2.55 (depending of ur risk). ALWAYS follow ur RM.
Risk/Reward: 1 to 3
risk is justified
Good luck everyone!
Follow me on TRADINGView, if you don't want to miss my next analysis or signals.
It's not financial advice.
Dont Forget, always make your own research before to trade my ideas!
Open to any questions and suggestions.

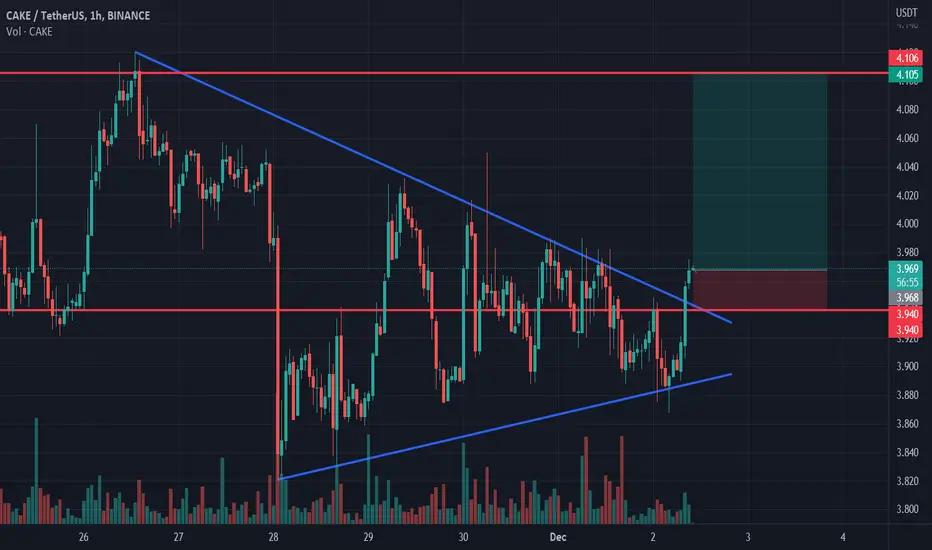
The important resistance area!CAKE had a range trend during the last week. Its price fluctuates between two very important resistance and support levels corresponding to the 4-hour time frame. The support was considered in the range of $3.42 to $3.65, and its resistance was in the range of $4.10 to $4.20. If the resistance and range of Bitcoin are broken, we can expect to see the price continue to grow until the next target range of $5. Note that the current resistance is very serious and important.
Breaking this range requires the stabilization of favorable conditions in the market. Because it can both increase the trend in the 4-hour timeframe and the price can completely exit the long-term downward channel. For the short-term and in the 1-hour time frame, as long as the support of the $3.82-$3.87 range is maintained, there is a potential to break the resistance. You can also consider a symmetrical triangle pattern for the current price in the same time frame. Failure of the pattern from any side can affect the continuation of the price of this currency. According to the type of candles and most likely, the direction of price departure from the pattern will be from above. In this case, we can expect a further price increase from CAKE after breaking the resistance and pulling back to it.

Eliminate sales pressure?!CAKE had a sharp downward trend during the past weeks. After the buyers brought the price to the resistance level of $5, there was a strong reaction in this area, and the saving of profit by the buyers, along with the selling pressure that was applied in the whole market, caused a 30% price dump of this currency. The support level that was considered in the range of $4.10 to $4.23 for this currency has now turned into resistance. But the second support, which was in the range of 3.46 to 3.65 dollars, has been associated with a good positive reaction.
The market made a return to its resistance levels last day, and CAKE currency has hit the resistance of $4 with the good support of its buyers. In the 4 hours, the price trend of this currency can become a range mode if it does not break the resistance of $4 because the power of buyers has risen dramatically above the previous support level. Therefore, we expect a range trend from this currency this week. If the buying support continues and the $4 resistance is broken, the price could break out of the long-term bearish channel, and this could go a long way in removing the selling pressure.

CAKE (Time to grow)Hello traders,
Based on the chart,
I dont know will be one more small decline or not, but i think that in midterm CAKE will show some growth.
Entry: market and lower
Targets: 4.8 - 5.5 - 6
after first target reached move ur stop in breakeven!
SL: ~2.6
Risk/Reward: 1 to 2.5
Good luck!
Please, feel free to share your point of view, write it in the comments below, thanks!

long CAKE$CAKE broke through the resistance level. Bullish movement i expected to continue and reach the resistance at 4,41$

💁♂️ CAKE/USDT _ 3D 💁♂️ HI Everyone,
As you can see, the price is in the range of 3.82. In a 3-day time frame, if the price penetrates below the 3.60 range, the price may be accompanied by a correction to the $3 range. 💹
Support Ranges $3.30/3.10$/2.45$ ⚠️
Maintaining the specified range is important! !️
We may see further correction if we lose the 2.45 support range. ❗️⚠️
❎ (DYOR)...⚠⚜
WHAT DO YOU THINK ABOUT THIS ANALYSIS? I will be glad to know your idea 🙂✌
IF you like my analysis please LIKE and comment 🙏✌

CAKE ON 1.80$ SEEMS GREAT !!!Cake is going to record another bottom on 1.80$ soon. Follow me and stay tuned for updates.

CAKEUSDTHello Crypto Lovers,
Mars Signals team wishes you high profits.
This is a one-day-time frame analysis for CAKEUSDT
Here we have R2 and R1 as the resistance areas which include the disability of the price in order to rise. And S1 at the bottom is a support area. At the moment, we have the fluctuation of price over S1 area and we predict an increase is going to happen after a little fall. So if we receive some confirmation candles to rise, an increase will happen to it toward R1. Also it is possible that the price experiences a fall in case it loses the support at S1. Note that it is suggested to activate your stop-loss point due to unstable situation of market.
Warning: This is just a suggestion and we do not guarantee profits. We advise you to analyze the chart before opening any positions.
Wish you luck

CAKEVery simple ... Very clear
This is my personal opinion. Please do not trade based on my analysis and data.

Possible breakout to the upside ! Cake is trying to breakout the downward channel we have on the hourly chart. Nothing confirmed yet, but if we see a beautiful breakout and retest then that's our trigger for the trade!
Stay sharp! At the same time it could potentially continue the downtrend so beware, trading against the trend, trading reversals are very risky unless you wait for a break of structure, change of character and the more confluences the better!

CAKEUSDT BREAKING OUT AS WE PREDICTED FEW DAYS AGO
expecting some big moves incase of successful breakout
we only needs to wait for daily clode if daily candle closed above resistance then buy and hold some

CAKE GO UP AGAINHello, dear traders. how are you ? Today we have a setup to buy/long the CAKE symbol.
For risk management, please don't forget stop loss and capital management
When we reach the first target, save some profit and then change the stop to entry
Comment if you have any questions
Thank You

#CAKEUSDT Ascending Triangle BreakoutTrade setup: Trading in an Ascending Triangle and price is approaching $5 resistance zone, where it was rejected in August. It also lines up with 200-day moving average. If price is able to break above that, it could revisit $8 thereafter. (set a price alert).
Pattern: Ascending Triangle which is a continuation pattern (it typically breaks out in the direction of existing trend). Most traders wait for a breakout.
Trend: Uptrend across all time horizons (Short- Medium- and Long-Term).
Momentum is Bullish ( MACD Line is above MACD Signal Line and RSI is above 55).
OBV (On Balance Volume): is flat, indicating that volume on Up days is equal to volume on Down days. Hence, demand from buyers and supply from sellers are in equilibrium
Support and Resistance: Nearest Support Zone is $3.50 (previous resistance), then $2.50. The nearest Resistance Zone is $5.00, then $8.00.

Rising Triangle in downtrend - BullishAs all of you know already , if the ascending triangle pattern happen in the downtrend channel then there is more than 60% possibility to reverse the trend and break the triangle up!

Cakeusdt DailyIf the resistance zone is broken, it is suitable for profit.
Target 10
BINANCE:CAKEUSDT

PancakeSwap (CAKE) formed Bullish Gartley | Good buy opportunityHi dear friends, hope you are well and welcome to the new trade setup of PancakeSwap (CAKE) with Bitcoin .
On a 4-hr time frame, CAKE has formed a bullish Gartley pattern.
Note: Above idea is for educational purpose only. It is advised to diversify and strictly follow the stop loss, and don't get stuck with trade
