BNB/USDT Buy and Take Profit Zones. 387 and 450 USDBNB/USDT 1D TimeFrame
BNB is seeking a new higher low on daily, price is forming a nice triangle, trades can be open on the marked zones (green and red)
Regards.
Eng Alexa.
Cakeusdt

CAKEUSDT MAY SEE GAINSBINANCE:CAKEUSDT
PPPDirhams.
Disclaimer: This is just my idea. Am not liable for the end results if adapted by anyone. Trade cautiously as there are chances that you will lose your investment..

The next pump$cake #pancake one to keep an eye on here. Retesting previous resistance and has a lot of upside. Resistance levels marked.

CAKEUST - Mid-term BULLAll information in the charts
Conclusion: Cake has been breaking the triangle, I expected CAKEUSDT will reach $32 in the bull run.
This is a mid-term analysis.


CAKEUSDT | BREAKOUT IS NEARCAKEUSDT is trading in a tringle and is on the verge of breaking out.
Attempt to buy after breakout
Stop loss: 17.50
Target: 26

CAKE USDTThe risk to Reward for a buy transaction in this position is 7. The ABC pattern seems to end to reach the target.

Cake king termThis year cake will grow up a lot
Still good to be bought it can go up to 30$ until beginning of December

Cake price predictions- Bullish up to $100 in short to mid term- hitting long term support levels
- Total value locked seems to be rising- showing signs of reduced supply, currently 80%
- Hopefully expect price to reach ATH soon and maybe testing the $100 level short to mid term. Long term potential to $1000 but seems a bit far fetched considering market cap.
- On BSC Scan can see likely 20% remaining liquidity moslty all in exchanges, when this dries up further hopefully we'll see some nice price action to upside.
- currently great time to buy in around $18 to 20, and stake this on pancakeswap, and provide more upward thrust, NOT staking on the exchanges where they will take commission and reduce price potential as this commision will be added to selling pressure.
- TIP if you buy on the exchange, the exchange may try to block transfers off by saying issues with BSC, but essentially they don't want it going off their exchange, just be patient and remove it off the exchange, or transfer BUSD off exchange and buy directly on pancakeswap where you won't get these issues.

Is CAKE baked?CAKE has looked asleep for nearly a month ranging between $17 and $21.
Price action is getting squeezed within a few different trend lines at the moment. I believe if it can break above $21 it'll have a shot at reaching it's previous ATHs and possibly higher.
If it stays within this channel it can possibly reach as high as $450 or $500. A nearly 3000% move.
This all depends on BTC continuing upwards or at the very least not crashing. Once BTC is done consolidating though, altcoins will start to explode and CAKE may be one of the sleepers waiting to wake up.

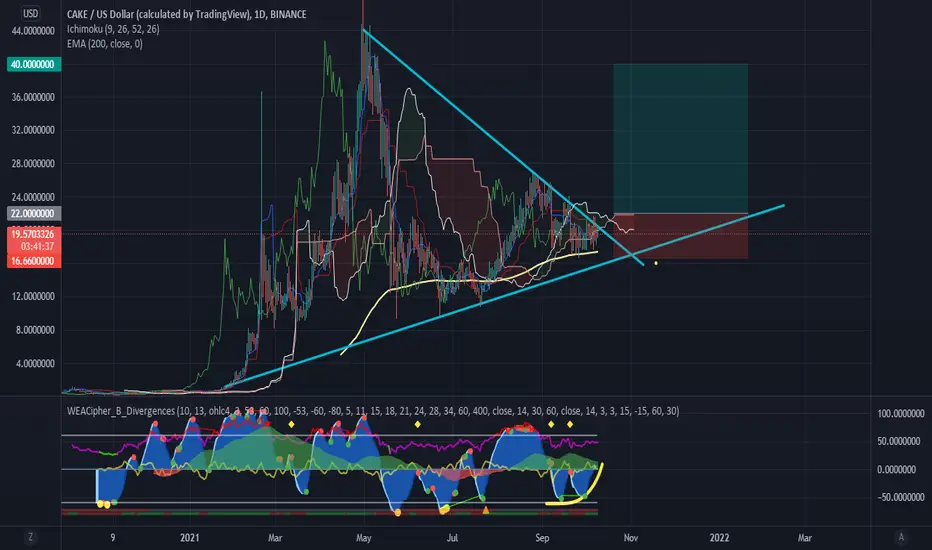
Cake could break up the triangleBuying #CAKE if price >= 22 on 4H because:
-near broking up (or down) a triangle
-on 4h: on MarketDecipher: anchor & trigger wave getting smaller & smaller (see yellow line)
-RSI going up since mid september
-on daily MACD bullish crossover daily since beginning of october
-above 200 EMA D &lower bull trendline acting as support so far.
Still below 200 EMA 4H
Order type:
BUY STOP: 22
TP: 40
Stop loss: 16.66
Risk to reward ratio: 3.37
Capital risk recommended: 1 or 2%
To avoid false break out, make sure price is >=22 on 4H time frame. if it goes up, wait for pull back, dont fomo.
As always, there will me more opportunities than you could ever handle.
If you are more willing to take a agressive trade, agressive you can buy even now.
We will update
Who is in ?
CAKEUSDT (PancakeSwap) - Coin of the WeekPancakeSwap is an automated market maker (AMM) — a decentralized finance (DeFi) application that allows users to exchange tokens, providing liquidity via farming and earning fees in return. It launched in September 2020 and is a decentralized exchange for swapping BEP20 tokens on Binance Smart Chain. PancakeSwap uses an automated market maker model where users trade against a liquidity pool. These pools are filled by users who deposit their funds into the pool and receive liquidity provider (LP) tokens in return.
Technically, PancakeSwap is in a big consolidation on the daily timeframe that started at the end of August this year. When we look at the 4h chart we see that the price is consolidating below the blue trendline marked on the chart. We have 2 working scenarios for this cryptocurrency right now, the first would be a break of the blue trendline and a continuation to the upside and second a retest of the support area and then a reversal to the upside. Although a total downside with a retest of the lows of May is possible, the probability for this scenario is low.
Trade with care.
Best regards,
Financial Flagship
Disclaimer: The analysis provided is purely informative and it should not be used as financial advice. Remember that you need a plan before you start trading; so, take this knowledge and use it as a guidebook that will ultimately help you understand the market and easily predict your next move.

CAKE BULL RUNhi , our general opinion for cake is long in the longterm (when alt season begin),as you know in fib retracement between 0,786 and 0,618 zone is golden packet it means we should test it one day and our weakly strong support is 30$ and also 0,618 retracement is 30$ so our first target for cake is 30$ , second target is 44$ because its ATH . and as you see in the chart , cake make a descending chart pattern ( descending chart pattern in old market is a bearish but in new market like cryptocurrency is a bullish chart pattern) and it broke the pattern and our target based by pattern is 54,92$

CAKE FOR BULLS ! The $CAKE price has formed a bull flag on 1D chart . We expect to see another touch of the support area thanks to Bitcoin volatility & on the Verge of Huge Breakout So Keep your Eyes on it
$CAKE is currently trading near a strong support area , Expect a bounce + Flag's upper trendline breakout.
EMA200 is laying under EMA55 ,Quite bullish sign.
RSI is Printing Massive Bullish Divergence.
MACD also got a bullish divergence
Pancakeswap is the largest DEX on BSC chain. Expecting upcoming burnings + events
TIn Case of Upside Breakout, Target would be $30 .Long term targets are 50-60-70$.
The Train has left Station So Fasten Your Seat Belts 😎

Cake Daily analysisdown trend channel has been broken we have a slight resistance for better entry wait for break of resistance
good luck

$CAKE, UCTS flashing a 1D Buy.$CAKE
UCTS flashing a 1D Buy.
Aiming for a breakout above ~21$ as trigger while volume is slowly gaining traction
If happens, then aiming to ~25$ (~20%)
#CAKE

CAKE/USDT { PANCAKESWAP }- BULLISH SETUPANALYSIS 🔎
- CAKE/USDT brokeout above the double bottom neckline resistance, hit a swing high and retraced.
- Price is retesting the key fibonacci retracement zone (0.618 - 0.702 - 0.786) and the double bottom neckline resistance.
- There's a relatively high concentration of buyers at this zone (high buying pressure).
- The pullback retracement is resisted by the descending trendline resistance.
- Breakout above this descending trendline resistance could be a bullish signal.
BUY ENTRY ⬆️
- Conservative entry: breakout above the descending trendline resistance.
- Aggressive entry: key fibonacci retracement zone (0.618 - 0.702 - 0.786)
TARGETS 🎯
- Horizontal resistance level (@21.19).
- Horizontal resistance level (@23.74).
- Horizontal resistance level (@25.33).
- Horizontal resistance level (@26.60).
- Fibonacci extension level 1.0 (@33.88).
SETUP INVALIDATION ❌
- Breakdown below the previous swing low after the breakout.

CAKE/USDTCAKE is currently performing in the Ascending Triangle if it breaks the Ascending Triangle then CAKE next target is ATH, If the market continues like this then it will complete its target soon...

Cake Breakout!Hi everyone.
Cakeusdt seems too be good training position.
Now price is moving on trading range box and I'm waiting for breakout of trendline and break of range box
So we will have great long position into next resistance which our profit will be 25%-30%.after that I'll risk free my position and wait for historic high.
Remember you can stake cake in cake platform too gain better profit from this position.
The second scenario is we will have break out from down.in this senario price will dump.
So future contracts can make you rich in this senario too.
Thanks for reading.
Not financial advice.

CAKE - TRADE SETUP - LIVE TA$CAKE has been in accumulation zone for so long now and it this video I have discussed why I think CAKE is going to give massive gains in the next few weeks!
The best entry is at the market price till $18 and the targets are mentioned.
I have gone through each and every details and have done all the analyses so you guys can copy the idea and learn it from my strategies as well :-).
If you liked this video guys make sure to give a thumbsup and share :-)

CAKE 4Hcake is moving in symmetrical triangle almost near breakout. if we see successful breakout and retest we could see good bounce in cake. NFA

CAKE /USDT AnalysisCAKE / USDT
Cake still moving inside range of falling wedge
and face resistance zone
📌 What are possible next scenarios ?
1- clear breakout and hold above blue resistance zone = pump
2- reject hard again from trendline mean can drop to support around 16$-17$ before next move
Invalidation of any bullish setups=
Loss of green support area by daily close
Dont trade blindly
Best of wishes 🙏

₿ CAKEUSDT 1D ₿ : 19.Oct.2021This analysis is a check of the chart in a Daily time frame and everything is clear on the chart and does not need additional explanation ... However, if you have any questions, feel free to ask .
⚠️ This Analysis will be updated ...
👤 Arman Shaban : @Ar_M_An_4
📅 19.Oct.2021
⚠️(DYOR)
