$ROKU short term playYesterday showed very strong bullish movement for ROKU after support was found around $130. The bears kept the price down today but we are now resting again on moderate support around $134.
If the bulls make a strong move I think we could see a gap up to the 50 dma around $142.
CALL

PSX Good long stock due to strong reversal patternsReversal of a steady downtrend will occur due to hitting previous resistance and a key resistance line. The RSI is approaching oversold and the stock is very good to be watched and bought at the moment.

Square Options Play (Strangle)Got in this today before the breakdown. 66 calls and 62.50 puts. Seems like a move to 63.50 support is in the cards, if not 63 or more. Will sell PUT when up 100%+, thinking the power move will be in the call on a bounce. This can go $3-4 in a day no problem.

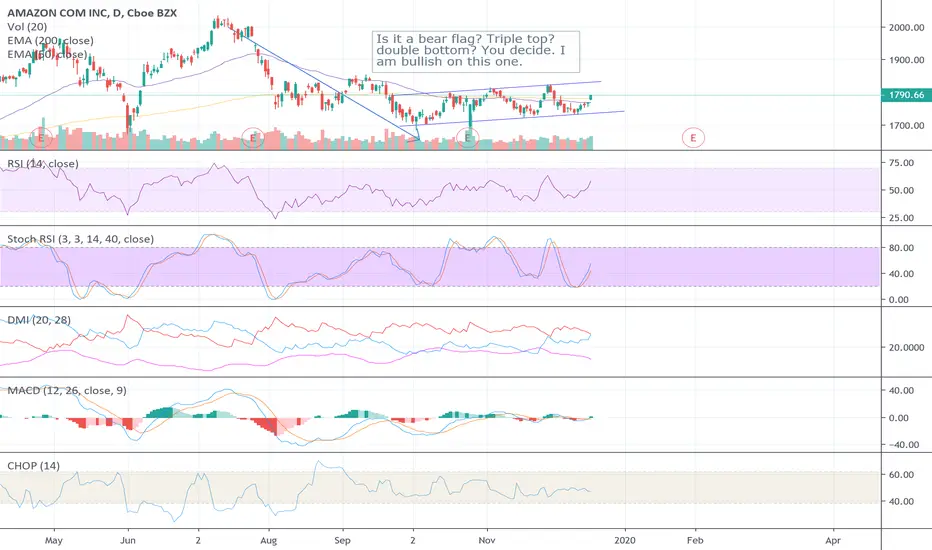
Call Credit Spread CMGCMG Credit was $1.25
Target gain will be $70, max loss is $140.
Exp Dec 13, 790/795 above support line.
It may move lower or move into a range soon.

long call $2 strike on one of my free stock with robinhoodinvite.robinhood.com for free stock
so i sold all my free robinhood stock except for the one stock chk
i took all that money and bought 10 november monthly $2 strike long calls
those are whats called OTMs - Out of The Mony options
I literally paid $30 bucks for the 10 contracts
i immediately put in a sell to close on those same contracts for $100
"if" and thats a big big big "if" then thats a 3/1 trade and ill be a happy camper
If i loose it was a long shot with free money anyway right :)
Yall wish me luck
X-fingers

Uber Short Term BullishEntered a options call on Monday (expires Friday – high risk) since most of my indicators point short term bullish and we have 2 gaps that will probably get filled before tanking again to even lower lows. Anyone agree? As long as price maintains above $28, I will be in profit for my options call.

Good candidate for longThat gap down should go through gap fill, price targets i see are 150(test support here)
then go to 156/162/165/172

$TSLA Catalyst Incoming Earnings call is very soon. Coincidentally lining up very well in the triangle. Check it out here for more info xD
www.youtube.com

SBUX before earnings I am still bullish on SBUX, I have my largest option call in history rooting for this steady climb with a boost from earnings. Stay tuned to see how accurate this prediction is,

DLTR Call SpreadDLTR looks like its breaking out, there will be some pull back but lets see if it can break 115
$2.04 Call Spread, EXP OCT 25
Max gain is $1.48/$3.52 Max loss is $150
Max loss can only be taken on the week of October 14-18 if there is no chance of victory.

TGT Bull flag on weeklyTGT bull flag, may adhere to the pattern however it may sell off first in order to move higher.
Price was 2.18
EXP Oct 25
Spread is 110/116 6 points wide
Target is $191 profit/ $4.09 is option price at exit.
Exit price will be $163 which would be taken week of October 14-18 and cannot be done before then.
Perhaps this trade will flop but we'll see. It looks decent.

Weekly SBUX prediction I see Starbucks followed the market today, I believe the market is settling down and normal fluctuations will occur. Based on previous price action, including candlestick trends I predict SBUX to rise all week and break $90 a share by Friday, 10/4

SBUX to $105 Option Call I am deep into my option contract. 100 contracts for $105 by 11/15, counting on Q4 earnings to blow SBUX out of the water. I believe the remainder of this week will be good for SBUX since volatility has slowed down. Next week technicals are showing strong buys. Looking good all around, this will be a fun ride.

Still a chance for UBER this week Still holding my bet on UBER ( Have no choice ) hopefully it’s in the money or close by Friday. My initial call was 34.50 by Friday. Stay tuned to see if I make or loose money. This prediction right here will be calculated into my average that I keep for myself


SPX Finishing September with a rebound Check out my trend lines, and predicted price movement lines. This is a fun test of my skills. I have been here a week and am still learning. For those of you who have been following me I am a SBUX bull. I have a high stake in an options call for SBUX to hit $105 by 11/15. I am relying on steady growth until earnings and then a killer Q4 earnings. Comment below your opinions on starbucks and your thoughts/predictions on their Q4 report.
So far on trade view I have a 60% accuracy rating for my calls, which is an F. So please don’t make trades based on my predictions until I improve my skills, thank you!

SBUX Update 2 Please refer to my previous trend analysis, I added a new line to show how I got my bottom.

SBUX September Prediction This prediction will be Starbucks stock fluctuation and value by September 30th. A lot of work went into this and I am betting big on an option contract that expires 11/15.
50 contracts for SBUX to be $105
Comment below your bullish or bearish thesis on SBUX

UBER Tuesday Price Movement I am tracking the stock movement of Uber, I am an options trader and have 2 call contracts for UBER to hit 34.50 a share. Based on market trends this strike price should be reached by 9/27. Invest at your own risk as these are simple predictions. I have been correct 75% of the time with my predictions. My accuracy will be updated on Friday as well. Stay tuned!

ABMD Call OptionI bought and sold my AMZN call option on the same day on Monday. I made a profit, although I purchased the option too early and was too impatient, missing out on a bunch of profit. I think I need to adjust some of my indicators and add more indicators to my arsenal to try to avoid mistiming my purchases and giving me a heartattack when I check later in the morning. If there are any indicators that would be helpful or would help me in doing this, please let me know.
But the next call option I am looking at is ABMD, which has had a pretty terrible year it seems. But I it has neared towards the bottom of the Bollinger Band, and the volume seems pretty good. I think that the volume on the last tick I have does not really justify the small increase in the stock, but then again, this stock has had a pretty terrible run this year, so people probably do not want this stock anyways. But it appears that there is some momentum increasing in its favor, so I will place my bets on ABMD increasing tomorrow, and probably selling on the same day, unless I see more potential upside.

Tesla option call $275 by 10/11These trend lines show potential for Tesla to be worth $275 by October 11th. This is a prediction and not guaranteed. I am 0/0 for my trade view option calls.

UBER to 34.50 by 9/27 Call Prediction This is a prediction meant for an option call, I have been correct 75% of the time so let’s see where this goes! Stay tuned
