$AMZN | WEEKLY WATCHLIST 11/29Like Apple, we expected Amazon to pullback while most were super bullish. A bit more uncertainty with this one, as we can call this pullback either a wave 4 (if we hold 50%) or another nested 1-2 (if we hold $3350-3440)
No longs for now.
Calls

$AAPL | WEEKLY WATCHLIST 11/29Short-term, Apple doesn't look too hot. False breakout last week while everyone was super bullish, however we saw this one coming and didn't rush in. I'm looking for a retest of the diagonal breakout which also lines up with the golden pocket. Daily Oscillators need to cool off as well.
If markets prove to be strong through the end of the year, we may get a shallower retrace for wave 2. Target above remains at $180+. Be patient friends.


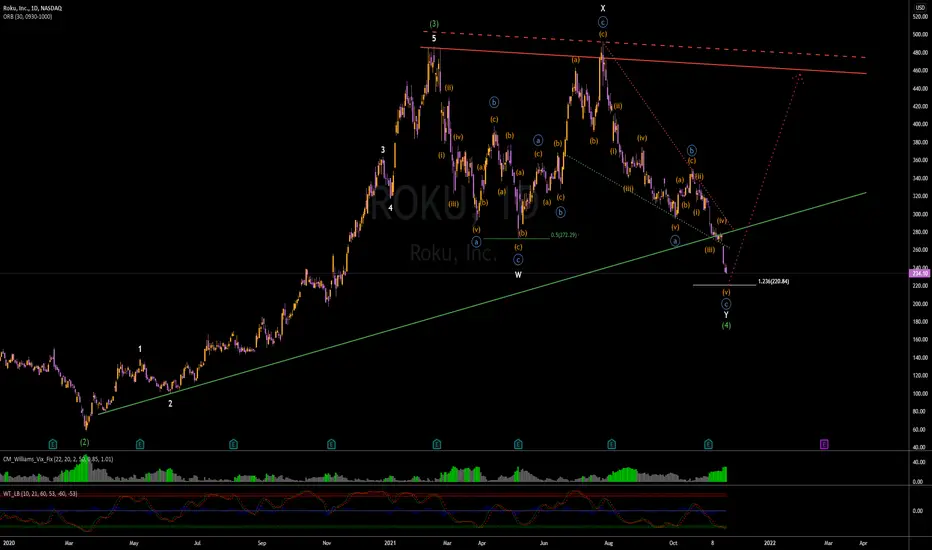
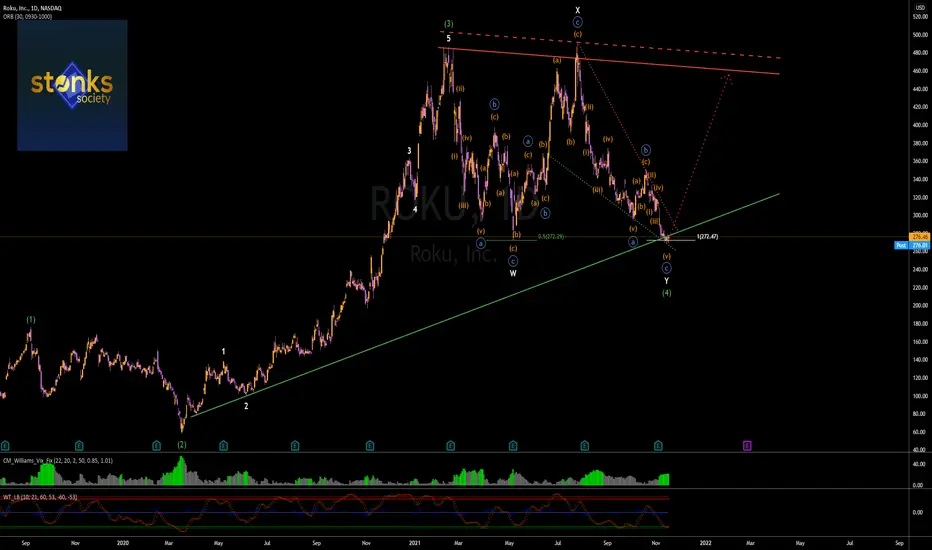
$ROKU | WEEKLY WATCHLIST 11/22Like PayPal, Roku still has some more downside to go before a potential reversal. Not interested in long setups until we tap $220 region. Don't get burned trying to catch this in the meantime.
$PYPL | WEEKLY WATCHLIST 11/22Very ugly move for PayPal last week. I have since taken profits on the initial bounce we got from $201 to $215. I hold no options for the time being. Weakness from last week opens up the possibility to see $169-170 get tested before a major low is potentially put in. Be patient with this one and careful catching a falling knife with weakness present.

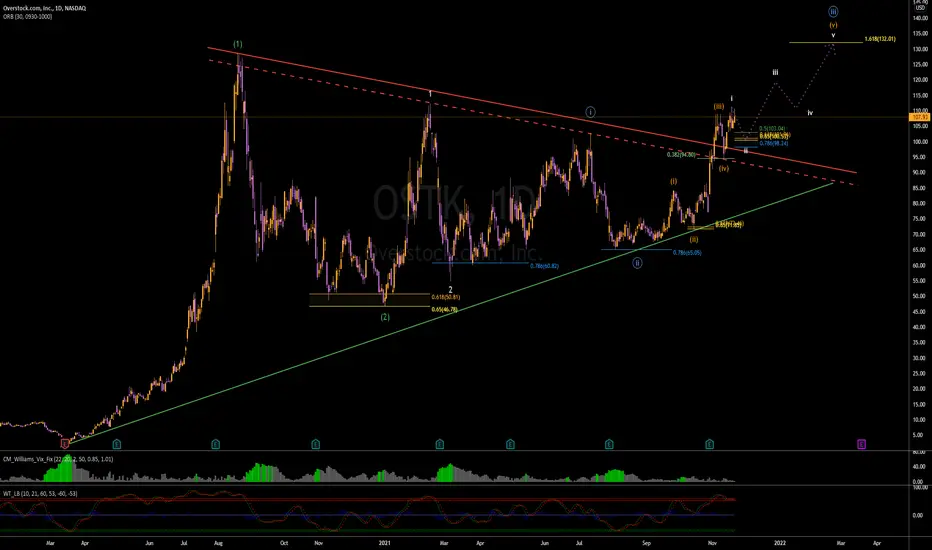
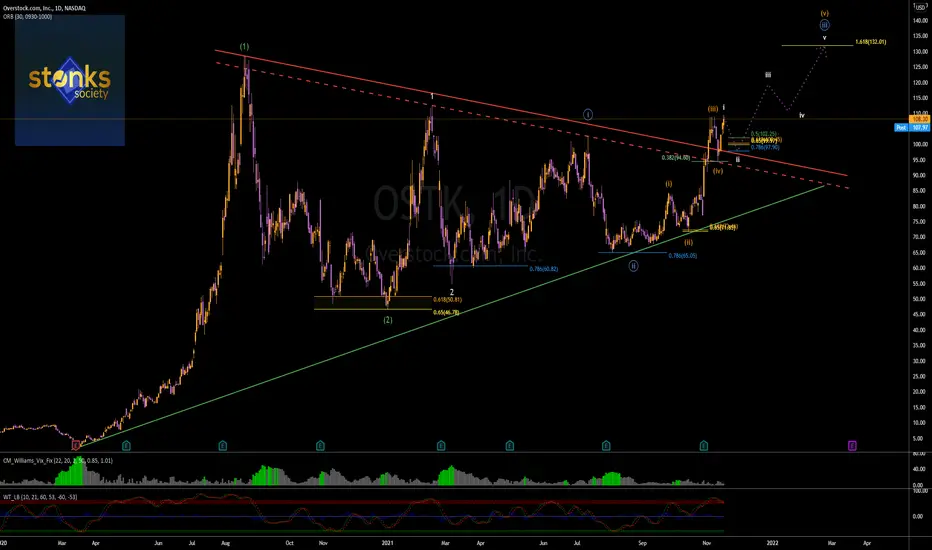
$OSTK | WEEKLY WATCHLIST 11/22Pretty uneventful week for this one last week. Plan stays the same, and looking for wave 2 buys below in the $98-103 region targeting $132 ultimately. Staying patient here.
UPST - has had an incredible runUPST has had quite the year producing those that took a chance on it some outstanding returns due to the fact it not only asses risk but can also manage returns with it's AI software which has led to some incredible earnings report from the GATE which does not make sense when you look at the price action why the price would fall so much, i am very bullish on this play long term as i see Ai being the future of just about everything i also made a video breakdown the company it's software and some of the price targets smart money has for them

$NIO | WEEKLY WATCHLIST 11/22After patiently waiting months for the chart to develop, I finally pulled the trigger to enter last week. It is CRITICAL that we hold this $37 region, otherwise I will have to re-adjust my count. Looking for major targets at $48.56 and $57+ above.

SNAP - opportunity for some nice gainsBack when SNAP reporting earnings and had the miss due to the change in policy by APPLE with limiting how SNAP could market to it's clients i thought it was an extreme over reaction as the price literally fell off a cliff when i went digging into unusual whales i found very large call option bets placed out for end of NOV exp which seemed like they placed those options trades to collect premium only, as it was a multi leg strategy it also had very bullish call options included with some of the premium amount for a total option contracts totaling 1.3 million i tweeted out the chart weeks back stating i felt the price would remain in the colored box until those options expired so they could collect the premium and we would potentially see a jump back in the price action looks like we are closely approaching this coming to fruition, def should be a play to keep in your watch list

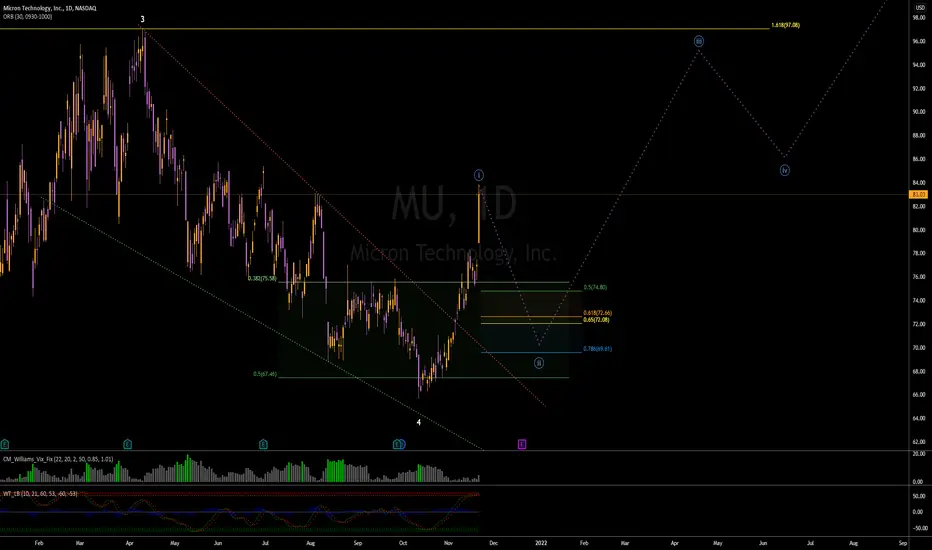
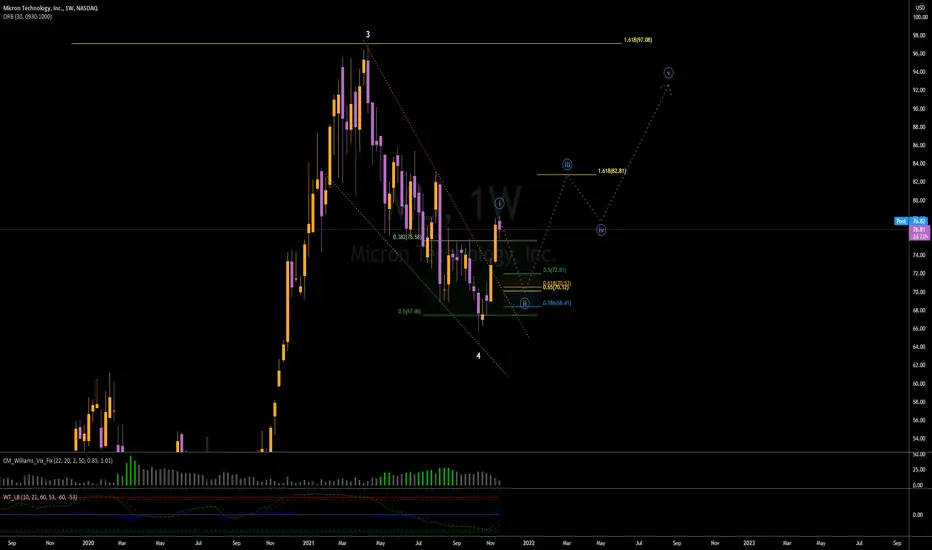
$MU | WEEKLY WATCHLIST 11/22Swing execution plan still remains the same. Micron just decided it wanted $80+ first. Still seeing this initial impulse as a wave 1 and looking for a wave 2 below. Since wave 1 was larger than I expected, I have adjusted my count for waves 2,3,4 and 5 to accommodate this change. (much larger 5 waves up)
$LCID | WEEKLY WATCHLIST 11/22Although we got a strong bounce towards the end of last week, still a bit skeptical going long. We are either still correcting in wave 4 (my preferred count) or starting wave 5 (confirmation is break over $57.75). Still needs time to develop imo.

$FB | WEEKLY WATCHLIST 11/22This setup looks primed to continue running up! Beautiful inverse head & shoulders pattern as well as a bull flag breakout on Friday. Looking for a pullback into the $339.6-344.17 range to buy the dip on Monday/Tuesday. Targeting $370 to the upside.

$ATVI | WEEKLY WATCHLIST 11/22More bad news dropped Activision last week... looks like this stock can't catch a break. However, we are still sitting on major channel support as well as the 78.6% Fib. I'll still buy the fear while 99% of others are mega bearish.

$AMZN | WEEKLY WATCHLIST 11/22Crazy move last week above the previous $3605 pivot. R/R and upside here is limited in my opinion before a wave 4 pullback happens. Looking at the $3500-3650 range to potentially enter a long swing. Be patient with this one.

$AAPL | WEEKLY WATCHLIST 11/22Great move above the diagonal trendline last week! We have since taken profits since R/R is lower than I would ideally like up here. Looking for a wave 2 pullback in the $152-155 region which should be buyable. Targeting $170 to the upside if my thesis holds true.

$TSLA | TRADE IDEATesla with the falling wedge breakout today and showed lots of strength!! Looking for more upside, but still expecting a corrective triangle to play out for wave 4. Upside targets still remain.

$ROKU | TRADE IDEAStill extremely early in the move. Looking for a strong conviction candle to the upside to confirm my thesis...
$PYPL | TRADE IDEAI hope this one excites you as much as me. Called the bounce for 15 points to the upside already... $185 to go.

$OSTK | TRADE IDEAExpecting ONE LAST DIP before full send upside. You don't want to miss this, I expect the move to be very quick.
$MU | TRADE IDEAUpside looks limited from here. Expecting us to pullback into a corrective wave 2 into a very buyable dip around $70. Be patient on this one, it's only getting started.
$LCID | TRADE IDEAUpside is limited from here, looking to complete the daily gap fill. Will eye a re-entry on the wave 4 dip to catch the move to $70+.


$ATVI | TRADE IDEAWill probably get some hate for this one.
Is history going to repeat itself? I have highlighted the previous channel/price action that I'm using as comparison in this analysis.
