Canadian Venture index --- Inverse head & shouldersGold has reached unprecedented heights, approaching the $3000 mark—a prediction we made with precision. Now is the moment to turn our attention to silver and the mining sector.
To start, let's examine the Canadian venture index, which is displaying a promising inverse head and shoulders pattern. I am confident that the logarithmic projection will be achieved without much difficulty.
Canada

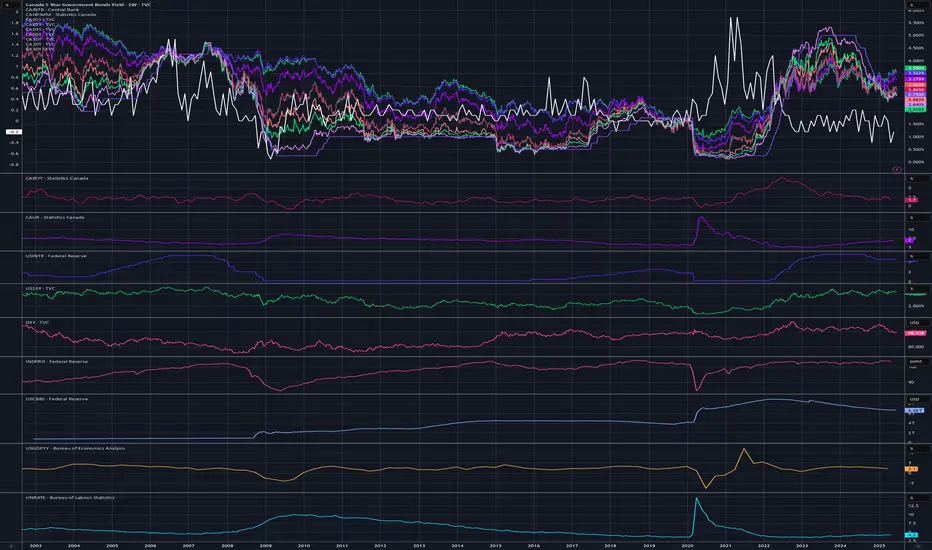
Canada macroeconomicsTreasury bond yields and house price.
Also include unemployment rate and inflation rate YOY
The Canadian Dollar Index CXY on 1WEEK timeframe with cycles. Just a coincidence, I'm sure... But Canada's current Prime Minister just resigned exactly at the end of the 3rd cycle on a 9 year major support level. Is the Canadian dollar about to reverse? Pay attention to Canadian news over the next 6 months to support this idea.

(ETH) ethereum "years - phases"The phase of the Ethereum chart in years using colors to represent each year and to visually show what happened during those years. So far this year is cold and losing. Will Ethereum recover and create a new pattern never before seen or will this entire year be in vain while wishing and hoping and believing that the price will turn itself around? The year of 2025 the year of AI.

Solana Climbs Amid Institutional Investments and ETF Backing Solana (SOL) has climbed to $134.35, marking a 0.89% gain over the last 24 hours and an impressive 20.39% increase over the past week. Its market capitalization now stands at $69.37 billion. Although 24-hour trading volume has declined by 14.73%, settling at $3.71 billion, bullish sentiment continues to build around the asset.
Institutional interest has intensified. Real estate fintech company Janover recently added over $10 million in SOL to its treasury. With more than 163,000 SOL now under management, Janover is following a similar strategy to MicroStrategy’s Bitcoin approach — buying, staking, and holding long-term. This move reinforces growing trust in Solana’s infrastructure and staking rewards.
Support for Solana also extends to regulated investment channels. Canadian institutions have backed Solana-based ETFs, adding another layer of credibility. These developments suggest that SOL is transitioning from a speculative asset to a longer-term investment holding.
Technical Analysis
On the chart, Solana recently broke structure (BOS) to the downside, indicating a growing bearish momentum. However, price found support and bounced off after recording a low of $95. Currently, the price is trading towards a high at $147. If it breaks above the the resistance, the price could extend toward $180, with potential continuation. Alternatively, if the breakout fails, a retest of the $110 zone may follow. The volume remains moderate, signaling cautious participation.
The recent bullish activity aligns with institutional accumulation and ETF exposure. Key levels to watch include $110 as support and $147 high as near-term resistance. A sustained move, break and close above $147 may confirm the next bullish leg for Solana.

BOC decision - trading the uncertaintyMarkets are narrowly leaning toward no rate cut from the Bank of Canada this Wednesday. Markets were pricing a 58% chance of a pause as of Friday last week. With traders nearly evenly split, short-term volatility in USD/CAD is possible.
While the Bank had previously signaled it would "proceed carefully" on future rate cuts, that guidance came before the heightened risks tied to the U.S. “Liberation Day” tariff announcements.
From a technical standpoint, there are early signs the pair may be forming a near-term bottom. If the BOC holds rates steady, USD/CAD could retake its 200-day moving average, opening the door for a move toward resistance near 1.4100.

Canada Approves First Spot Solana ETFs, Launch Set For 16th AprThe Ontario Securities Commission (OSC) has approved the world’s first spot Solana (SOL) exchange-traded funds (ETFs), marking a major step forward for crypto investment products in North America. Beginning April 16, 2025, several asset managers—Purpose Investments, Evolve ETFs, CI Global Asset Management, and 3iQ—will offer direct exposure to SOL on Canadian exchanges.
Unlike derivatives-based products, these ETFs will hold physical SOL tokens, giving both institutional and retail investors a regulated way to invest in the Solana blockchain ecosystem. Each provider will track a separate index, allowing for a range of strategies. In addition, these funds will feature staking options, providing a potential yield advantage over other crypto ETFs.
With this approval, Solana becomes the third cryptocurrency to receive spot ETF approval in Canada, following Bitcoin and Ethereum. The news has sparked increased whale activity and fresh speculation that the United States could follow with its own Solana ETF approvals in the future.
Technical Analysis
Solana’s price has been trading below $150, consolidating within a wider range. The key technical level to watch is $147, which marks an internal structure lower high. A strong break and close above $147 could signal a bullish shift in market structure, potentially triggering upward momentum. On the other hand, if the price fails to close above this level, it may drop below $120, reinforcing bearish pressure.
The ETF launch could become a catalyst for either outcome, depending on how the market reacts to the new inflows. At present, Solana continues to trade just below the critical threshold, awaiting a decisive move as April 16 approaches.

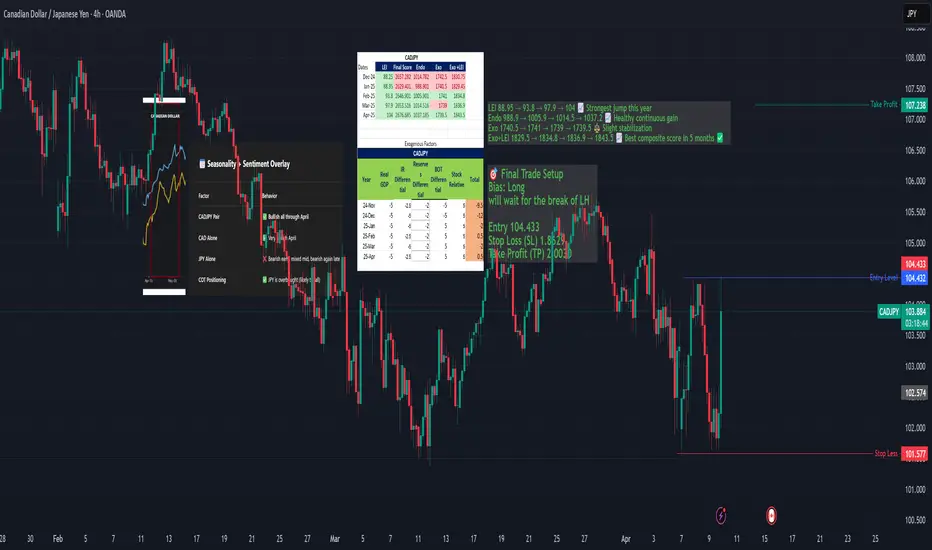
CADJPY: Bullish Setup Building — Fundamental AnalysisCADJPY is approaching a major support zone with a strong macro and seasonal backdrop favoring a bullish reversal.
Macro scores (LEI, endogenous) show consistent strength
Seasonality supports upside from late April into May
JPY is overbought per COT data
🔁 However, price structure remains bearish on 4H and Daily, so we are waiting for a confirmed CHoCH and HL before executing a swing long.
This idea is a "watch & prepare" setup — get ready to strike once structure flips.
WTI / OIL PoV - Break Point 65$ / 62$ / 47$ LONG The price of oil has recently undergone a significant retracement, dropping to its lowest levels in the last three months. This decline has been influenced by several factors, including trade tariff policies and decisions made by OPEC+.
In March 2025, the price of Brent crude fell below $70, touching a low of $69.76, its lowest since September. In New York, West Texas Intermediate (WTI) lost 1.64%, reaching $67.24. New tariffs imposed by the Trump administration on imports from Canada and Mexico have fueled uncertainty about international trade, raising concerns that global economic slowdown might cause oil demand to fall behind supply.
Additionally, OPEC+ decided to increase production by 138,000 barrels per day in April, with the goal of reaching a production level of 2.2 million barrels per day by 2026. This decision contributed to an oversupply that could negatively affect prices, especially if economic growth slows.
Trade tariffs have had a direct impact on the oil market. In February 2025, China imposed a 10% tariff on U.S. crude oil in response to U.S. tariffs, contributing to the drop in oil prices to their lowest levels of the year. Additionally, U.S. crude oil inventories increased beyond expectations, indicating further weakness in demand.
Geopolitical tensions, such as the U.S. proposals to take control of Gaza and the intention to strengthen sanctions on Iran, have added further uncertainty to the market, affecting consumer and investor confidence.
Regarding the price levels you’ve identified for potential purchases, it's important to note that the oil market is influenced by a combination of geopolitical, economic, and supply factors. The support levels at $65, $62, and $57 that you've pointed out may represent significant technical levels, but it’s crucial to monitor geopolitical developments and trade policies that can affect price volatility. It is advisable to consult up-to-date sources and market analysis before making investment decisions.

SHORT ON GBP/CADGBP/CAD has pulled back nicely to a Key supply area.
Its providing nice rejection of bullish pressure showing that its respecting the supply zone.
I will be selling GBP/CAD looking to make over 200-300 pips over the next few days.

CAD/Singapore Dollar ShortSingapore:Asia´s Switzerland getting stronger on China´s boosting industry and strong copper
Canada weaker because of Trump´s tariffs and weaker economy
Rockets: Entries
Yellow zone is not stop zone.It is the zone where I sell more:i COVER MY SELLS in thise zone.
Your stop should be based on your risk management decision taking

NZDCAD NICE SHORT OPPORTUNITY its an amazing opportunity for short nzdcad with a nice R/R
i beleive we will hit the target

USDCAD SHORTLongterm oportunity to short USDCAD. We are in bigger consolidation that we can see on Monthly chart. On weekly we touch upper area of consolidation and now we brake UP trend and currently we are in retracement.
Try to look for enteries for short.
SL: above highest point
TP: above lower band of consolidation (dont be too greedy)

International politics is now a high school dramaSo, Trump was all like, “Let’s slap an extra 25% tariff on Canadian steel and aluminum,” which meant total duties shot up to 50%.
Why? Because Ontario put a 25% tax on electricity exports to the U.S. And Doug Ford? He was not having it—saying he’d “respond appropriately” and “not back down.” But —he totally backed down and scrapped the tax on electricity exports to Michigan, New York, and Minnesota.
And now, Trump just ditched the extra 25% tariff, and boom— USDCAD broke below the recent low of 1.43986

Trump reshaping Canada’s election and Loonie Six weeks ago, a Conservative victory in the next Canadian election seemed inevitable.
Now, that certainty is fading. Conservative leader Pierre Poilievre's support from the American right, including Elon Musk, is becoming a potential liability as Canada faces an unprecedented challenge: the U.S. president openly questioning its viability as a nation, threatening tariffs, and even suggesting annexation.
A recent Nanos poll shows 39.6% of Canadians see new Liberal leader Mark Carney as the most qualified to negotiate with Trump, compared to 26% for Poilievre.
This uncertainty may be weighing on the Canadian dollar. USDCAD broke lower last week, falling below key support (1.4260 - 1.4466), signaling a shift toward sellers. However, the 1-hour chart shows a minor upward trendline defining the current pullback.

LONG ON CAD/JPY- Falling Channel at major support/demand are with a breakout (Bullish reversal pattern)
- Price Failing to break lows creating triple bottom/support area. (bullish)
- Jpy index has a head and shoulder pattern and is falling. (bullish for xxx/jpy pairs)
I will be buying CAD/JPY expecting price to rise for the rest of the week.

The Tariff War: America, Mexico, Canada, and China
Dear readers, my name is Andrea Russo, and I am a trader. Today, I want to talk to you about a significant shift that is shaking global markets: the United States has decided to freeze tariffs on Mexico and Canada, while China has introduced counter-tariffs. This strategic move is likely to have significant repercussions on international trade and global economic dynamics, with direct effects on currencies and the Forex market.
Freezing Tariffs on Mexico and Canada: A Change in Strategy?
Under the Biden administration, the United States has decided to freeze tariffs on Mexico and Canada, two vital trading partners. This move may seem like a de-escalation in the trade war, but it is actually an attempt to strengthen ties with neighboring countries, thus facilitating trade flow and stimulating the internal economy. With rising commodity prices and the ongoing energy crisis, Washington aims to avoid escalating tariffs that could further aggravate an already fragile economic situation.
A Strategic Choice in an Unstable World
Despite the good intentions, the global context remains uncertain. The decision to suspend tariffs is partly motivated by the need to slow down inflation and mitigate the negative effects on global supply chains, especially in North America. However, this could also be a signal that the United States is focusing on internal challenges before shifting its focus to a larger battle — the one with China.
China’s Response: Counter-Tariffs and Retaliation
On the other side, China has not delayed in responding by imposing new tariffs on U.S. goods, particularly in key sectors such as technology, agriculture, and automotive. These tariffs are expected to have a direct impact on U.S. companies that export to China but may also influence global trade dynamics. China has clearly made a strategic move, one that goes beyond economic revenge: it's a signal that Beijing is not willing to make concessions on an issue that is critical for its geopolitical standing.
Impact on Financial Markets and Forex
Now that we've outlined the key strategic moves, let's take a look at how these developments will affect financial markets, especially the Forex market. The combination of the potential tariff freeze on Mexico and Canada and the tightening tariffs on China will undoubtedly affect currency dynamics, creating both opportunities and risks for traders.
1. Impact on the U.S. Dollar (USD)
The dollar may be influenced in contrasting ways by these developments. On the one hand, the tariff freeze on Mexico and Canada could be positive for the dollar, as it may favor a stronger North American economy, stimulating trade flows and reducing uncertainty. In particular, sectors such as automotive, energy, and agriculture may benefit from lower costs.
On the other hand, tensions with China could continue to create geopolitical uncertainties, which historically have led to greater volatility in the dollar. In the event of escalation, the effect could be an increase in demand for safe-haven assets like gold and the Japanese yen, leading to a temporary weakness in the dollar.
Forex Trading Strategy:
If the tariff freeze leads to economic stabilization in North America, the dollar could appreciate against riskier currencies such as the Mexican peso (MXN) and the Canadian dollar (CAD). However, traders should monitor China's reactions, as an escalation could lead to a more significant dollar rally.
2. Impact on the Mexican Peso (MXN) and Canadian Dollar (CAD)
The tariff freeze on Mexico and Canada will likely have a positive impact on both currencies. These countries will benefit from reduced costs on goods exported to the United States, which could stimulate economic growth and improve the trade balance.
However, the situation remains delicate. If China continues with new tariffs, Mexico and Canada could be indirectly affected, as overall global uncertainty could reduce trade and slow down growth. Nevertheless, both countries could continue to see appreciation in their currencies against emerging market or riskier currencies.
Forex Trading Strategy:
If the Mexican peso and Canadian dollar appreciate, traders might consider going long on these currencies against others like the Brazilian real (BRL) or South African rand (ZAR), which tend to be more volatile and vulnerable to global crises.
3. Impact on the Chinese Yuan (CNY) and Emerging Market Currencies
The escalation of the trade war between the U.S. and China will have a direct impact on the Chinese yuan. If more counter-tariffs are imposed, the yuan could weaken further, particularly against the dollar. This weakening could also increase volatility in emerging market currencies as capital might seek safety in assets like the dollar or Japanese yen.
Another potential effect will be the increase in commodity demand, particularly for metals and energy, which could benefit currencies linked to the export of raw materials, such as the Australian dollar (AUD) and the New Zealand dollar (NZD).
Forex Trading Strategy:
Traders expecting a weakening of the yuan could consider short positions on the CNY against the dollar or other major currencies. Additionally, monitoring commodity price trends will be crucial, as they could provide leading indicators for currencies tied to their export.
Conclusion: A New Chapter in the Tariff War with Forex Impacts
In summary, the tariff war between the United States, Mexico, Canada, and China is entering a new phase that will have long-lasting effects on financial markets, especially on Forex. Currency fluctuations will be influenced by a combination of trade policies, geopolitical uncertainties, and global economic dynamics. Investors and traders need to prepare for a period of high volatility, closely monitoring the moves of key players and their repercussions on the currency markets.
In this environment, adopting a flexible and diversified strategy is crucial, ready to adapt to rapid and unpredictable developments. Forex, as always, offers great opportunities but also significant risks. The key will be to read between the lines of global economic policies and act with timing.

TradeCityPro | DOGEUSDT End of the Downtrend👋 Welcome to TradeCityPro Channel!
Let's go together into a turbulent day in the market, which was accompanied by the opening of global markets, Trump’s side events, and economic sanctions on Canada and Mexico. Let’s take a look at the chart together.
📣 How did this happen?
The event that occurred last night with the market opening in the Tokyo session was that Trump suddenly increased import tariffs from China, Canada, and Mexico to 25%, causing economic conflicts among these countries.
Along with this, we saw an increase in USDCAD, the dollar index, gold, and cryptocurrency, leading to market fluctuations. However, today it was announced that these changes will take effect next month.
🌐 Overview Bitcoin
Before starting the Bitcoin analysis, let’s first examine Bitcoin on the one-hour timeframe as usual. We had already opened our short position after breaking 101,654 in previous analyses, and this morning, due to sell-off candles around the 92,000-dollar range and excessive overselling, we secured a lot of profit and completely exited the position. This drop caused a severe shock to most people, leading to the liquidation of $2 billion in long futures positions.
This price drop was accompanied by an increase in Bitcoin dominance, reaching my psychological ceiling, and a very long shadow up to 64.30% was recorded. In my opinion, this is the Bitcoin dominance peak, but we will wait for confirmation. The reason I say this is the peak is that a large volume of other coins is staked and locked outside the cycle. This makes it unlikely that we will go above these numbers, and we will likely experience corrections and declines gradually.
However, Bitcoin itself has completely recovered its drop, which is a very good sign for upward movement and momentum because a momentum shift has practically occurred. The reason for this shift was the announcement that these economic events will be implemented next month, not now, which brought calm to the markets. But Bitcoin still has good momentum, and you shouldn’t feel left out. Feeling left out is for those who lack risk management and enter positions recklessly, not us.
📊 Weekly Timeframe
On the weekly timeframe, Dogecoin, Elon Musk’s favorite coin that has practically established itself as an entity in the U.S. and made him the second most influential person in the country, has had an outstanding performance recently. It has both recorded a higher low compared to 2023 and has not undergone significant price corrections—just a rejection from its ATH, which is entirely logical.
I am not buying for now and prefer to miss a move, or if I do buy, it will be very low-risk. But if you want to buy a coin, be very careful about how it performed during this correction and what its Bitcoin pair looks like. Most coins that experienced more decline, like NOT, had a bearish Bitcoin pair, while some coins that held up well were either ranging or bullish.
With this weekly candle, you can take a risk and make your purchase, but you must consider that it has merely bounced off support and made a pullback. Therefore, it may range for a few weeks before continuing its momentum, as the high volatility at the beginning of the month means the market may need some rest—unless we enter a bull run. For selling, hold on for now and do nothing.
📈 Daily Timeframe
On the daily timeframe, however, DOGE is one of the coins that has reacted well to recent events and is behaving almost like Bitcoin. It has rebounded from this range and is closing a strong candle with high volume, preventing the daily RSI from entering oversold territory.
On the other hand, DOGE is among those coins that are positioned at higher levels compared to the daily range that most altcoins have formed, showing its relative strength against Bitcoin. If you check Ethereum on the daily timeframe, you will understand what I mean.
After breaking the important 0.31019 support and the 0.236 Fibonacci support, we saw a sharp candle that rebounded between the 0.382 and 0.5 range, which is not a bad reaction at all. Most likely, some purchases will be made upon the closing of this candle.
If this aligns with your strategy, it is not a bad entry point, but I personally prefer to wait a little longer and enter with a better trigger and a smaller stop-loss. Or, I might wait for the 0.466 resistance break and take the trade with more certainty or higher risk.
First, when the market becomes range-bound and boring, that is exactly when the highest probability of movement occurs.
Second, take risk and capital management very seriously. I know 90% of our community follows this, but I need to repeat it repeatedly to make it universal and prevent people from being liquidated unnecessarily by opening reckless positions based on mere hope.
📝 Final Thoughts
Stay calm, trade wisely, and let's capture the market's best opportunities!
This analysis reflects our opinions and is not financial advice.
Share your thoughts in the comments, and don’t forget to share this analysis with your friends! ❤️

USDCAD - 4H TradingRangeDespite various market news over the past few days, USDCAD remains within its trading range, as previously discussed. The pair has yet to make a valid breakout, meaning range trading remains a viable strategy.
📉 Price has rejected the top of the range after recent news, aligning with expectations.
📌 Opportunities arise at key support & resistance zones within this range.
We continue to monitor for potential breakouts or further confirmations. Follow for updates!

USDCAD TO SHORT THEN LONGI also have USDCAD on my radar, expecting a buy overall, but for that to happen, I am expecting a third touch to the trendline above or an arc at the ray line above to short for a third touch on the daily trendline and place buys from there.

USDCAD - 4H Bearish signsThe FX:USDCAD pair fell sharply after news of Canada responding to potential US tariff changes under Donald Trump. It has now reached the bottom of the trading range on the 4H timeframe.
💡 Key Strategy:
Wait for breakout confirmations or enter on a pullback.
Avoid rushing in; price action confirmations are essential for entries!
Patience and strategy always win. Let's trade smart! 📉

USDCAD looks like continuing to ATHEven though many sentiment indicators (i.e. COT reports) talk about a very crowded CAD tarde, the Daily and Weekly chart still support the uptrend up until ATH.

USDCAD_4H_BuyAnalysis of the Canadian dollar 4-hour and medium-term time frame Elliott wave analysis style The market is in five rising Elliott waves, which is currently expected to be corrected in wave 4, and only by maintaining the number 1.42800, it can move up to the target of 1.45800 and 1.46500 for wave 5.
