CA10Y: Next target is 0.8, can it rally?First off, please don't take anything I say seriously or as financial advice. As always, this is on an opinion based basis. That being said, the bonds market for Canada, especially for its government been quite bullish recently. The last close was at +7.07%. Although, some resistance seems to be on its way, I think the next target in price to look for milestone-wise would be at $0.8. Afterwards, one could then look at it carefully and see if it worth a long hold, risk mitigation, or reinvesting. Again, just my opinion.
Canada

USDCAD Supply&DemandPrice was retracing on daily but reached a nested daily/weekly supply zone and came to a stop. Anticipating a continuation of the HTF trend, targeting the weekly demand. SL above the weekly supply.


Dream Office REIT - opportunities for 20% gains aheadDream Office REIT is tracing the early stages of wave ( C), a move that should complete primary wave 2 counter-trend rally. The most probable target is at 24.80. If price crosses down 20.20 this analysis should be reviewed. FOLLOW SKYLINEPRO TO GET UPDATES.


USDCAD - watch for correction up, probable target 1.407 - 1.426As predicted in our April 22 post, the pair changed direction and corrected to the current levels. USDCAD is tracing wave C of a triangle that initiated in 2016. This wave is also subdivided in 3 waves (ABC). It now seems to have finished wave A down and it is starting wave B up. The most probable range for the correction is between 1.407 and 1.426. If price crosses dow 1.333 this analysis should be reviewed. FOLLOW SKYLINEPRO TO GETUPDATES.

AIR TRANSAT situationAir Transat current situation, short flip.
Put in your stop loss if support breaks
thank you

$USD/CAD Possible SHORT but is there still more to go?The UDS/CAD has the Canadian Dollar getting stronger, Oil is slowly going where it needs to and the COVID is weak in the Country
With the BoC making a statement on Wed it looks like negative interest could be on the books!
So which way LOON??

$TLRY can rise in the next daysContextual immersion trading strategy idea.
Tilray, Inc. engages in the research, cultivation, processing, and distribution of medical cannabis.
The demand for shares of the company looks higher than the supply.
These and other conditions can cause a rise in the share price in the next days.
So I opened a long position from $10,29;
stop-loss — $8,90.
Information about take-profits will be later.
Do not view this idea as a recommendation for trading or investing. It is published only to introduce my own vision.
Always do your own analysis before making deals. When you use any materials, do not rely on blind trust.
You should remember that isolated deals do not give systematic profit, so trade/invest using a developed strategy.
If you like my content, you can subscribe to the news and receive my fresh ideas.
Thanks for being with me!


CAD POLOZ SPEECH TODAY MAY 25TH - NZDCAD POSSIBLE BULLISH MOVEFX:NZDCAD
AS WE ENTER THE LAST WEEK OF THE MONTH
WE'VE SEEN BULLISH ACTION ACROSS NZD AND AUD BASED PAIRS
POSSIBLE CONTINUATION WHILE WE ALSO COULD SEE FUTHER DOWNSIDE
PRESSURE IN OIL OR CAD ITSELF DUE TO THE STATE OF THE ECONOMY
AND PRINTING OF $$$$. HOLD ONTO YOUR HORSES, IT'S ONLY MONDAY TRADERS!
CHEERS
JOIN US IN THE TELEGRAM ANALYSIS GROUP WHILE ITS FREE!
*RECEIVE UPDATES ON MAJOR GLOBAL EVENTS
*DAILY FX CHART ANALYSIS*
*EDUCATION*
*ACCESS TO TRADE CAPITAL*
t.me
#POLOZ
#CAD
#FOREX
#MAY24
#VICTORIADAY
#FOREX


CADJPY - SHORT IDEAHello all - another idea here. I am predicting this pair to sell on this area. Let me know your thoughts.

TSX - Canada - short-term gains on the wayTSX is tracing minor wave 3 of intermediate wave C of primary wave 2. This last leg up should elevate prices between 14,200 and 15,000 before the long-term trend continues down in primary wave 3. FOLLOW SKYLINEPRO TO GET UPDATES.

Dream Office REIT Canada - opportunities for up to 30% gainsD.UN finished intermediate wave (B) down and it's preparing a great positive move in wave (C ), most probably to the same size of previous wave (A) move, you should wait an increase of volume as prices move upward before entering the position. We will post updates here. FOLLOW SKYLINEPRO TO RECEIVE UPDATES.

Allied Properties - CAN - potential for up to 20% in profitsAP.UN is tracing a intermediate wave (2) and it seems to have finished minor wave B. The next move should be the final leg of this ABC pattern and should push prices to the same increase of the previous minor A wave. You should keep alert for a rising volume accompanying the price move in order to enter the trade. FOLLOW SKYLINEPRO TO GET UPDATES.

XAUUSD- 2 SCENARIOSOANDA:XAUUSD
Hello guys !
For a month the gold market has been in range! From this point of view the price aims, the resistance of the range.
It is also important to underline the formation of a symmetrical triangle which of which the break can be a strong upward movement.
However if the movement is not strong enough to break the range up we will see a downward movement to seek support for the range!
INDICATIONS: The key zone is 1737.018, If there is a breakout we will go back to buy but if there is a rebound we will sell
DON'T FORGET TO LIKE ME IF MY IDEA HAS BEEN USEFUL!
DON'T HESITATE TO SUBSCRIBE TO MY PROFILE!
THANKS AND GOOD LUCK!

USD/CAD triangleHello everyone,
I spotted a descending triangle on the daily chart of this pair, which is usually followed by a move down after the breakout.
As you can see, the neckline of this triangle is around 1.385-6.
A breakout of this level might take us to a projected 500 pip move down as per the measurement strategy, to levels near 1.335-1.345 which happen to be the daily gap back in March, and usually gaps tend to get filled.
This move might be supported by crude oil prices which are now stuck in a rectangle formation (gonna post about that later on) and looks light a breakout to the upside is about to occur.
I don't advice any trade at the current level because prices are still mid levels in the triangle.
Good luck


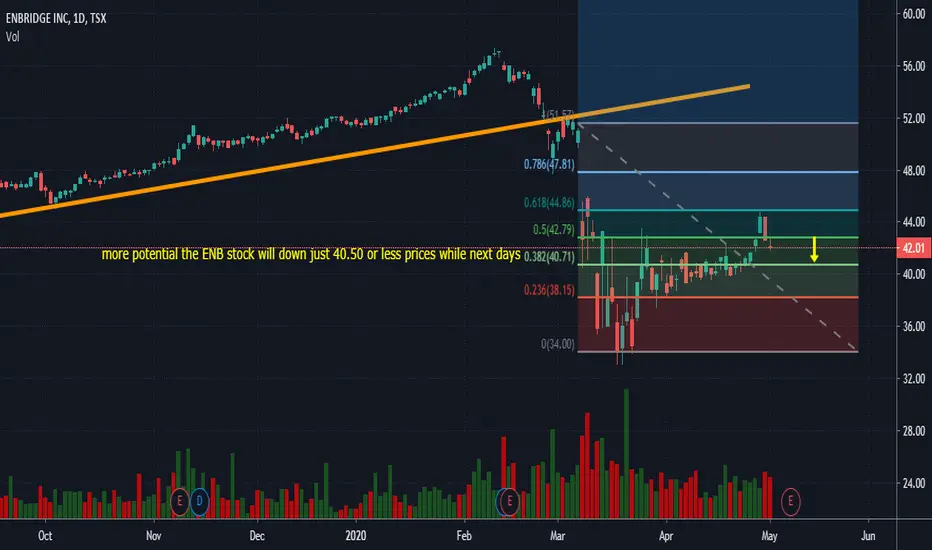
more potential the ENB stock will down more potential the ENB stock will down just 40.50 or less prices while next days