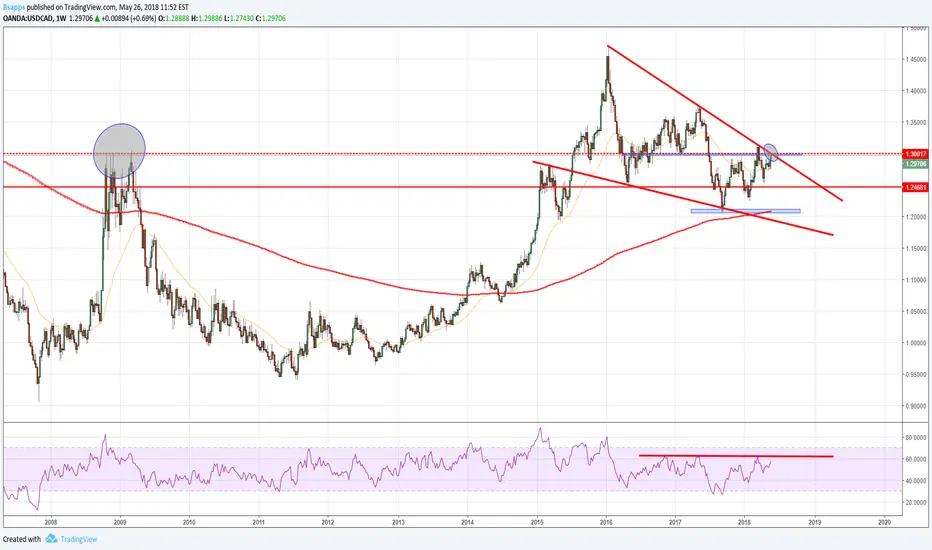
I am not convinced on UCAD....USD CAD looks great on every timeframe except the weekly...Looks like we could be inside of a falling wedge. 1.30 has proven to be strong resistance many times in the past, the weekly close candle looks like a hanging man. Crude oil dropped big on Friday, if we get a bounce in oil, this may drive UCAD down...
Canada
SHORT VRX.T - Over extended, multiple gap fills, and bad press.MOVING AVERAGES: 30SMA miles away on the daily and its been previous resistance (for example Feb 27 2018 and March 16 2018) after breaking through on April 12th VRX blasted to the upside.. I am expecting the daily the close in on the 30sma line i've highlighted.
CANDLE STICK: Dumpling top on the daily broke bearish. Also broke the daily higher low today.
RSI: over extended on the daily, and 4 hour at levels that are known to pull back.
GAP FILL: Gapped up on May 8th 2018 $24.46 to $26.14
PRESS: Ex-Valeant, Philidor executives convicted of kickback scheme finance.yahoo.com
I dont think the news really matters that much but just ads the over extended stock that has multiple reasons the come down. I think the price will hit the $24 area. I'm short since yesterday at $28.32 TSX:VRX

Time for action on Aurora!The Bollinger bands are very tight on ACB right now and we have been building a slope for some time now. ACB already tried to break out once but faced high selling volume. I really do believe this will be an easy trade though. I marked out the following Fib levels as targets. Depending on speed, I think we can see 11 USD again soon. The red line is for refill. Below that is absolute stop.

Corus_Entertainment_(TSX:CJR.B)_May_17_2018Corus is a Canadian Media company with interests in the radio, publishing, and television sectors. It was a part of Shaw Communication till 1999 when it was spinned off as a separate company.
Since 2014, CJR.B has been in a state of decline owing to the rise of Netflix and other internet based media networks which has impacted advertising revenue. However, even though Television viewership is shrinking, it will not completely die out. There will always be customers for speciality television shows such as those that Corus Entertainment owns and operates. Radio was long presumed to be dead but has found a niche market; I believe television will find its own market.
Currently, my analysis indicates that a symmetric triangle is developing. Volume is contracting as the price moves towards the peak of the triangle. Depending upon which way CJR.B breaks outs, we may want to buy or short the stock. However, at these prices CJR.B is yielding over 15% dividend. I think there is sufficient support for the stock around $6.00 as evident by the strong volume at that price level. Earnings are also above analyst estimates (the last earnings was).
Based on the probabilities, I would take a gamble at the stock around $6 and hold it till the sector goes strong again. Even though the price may never reach the peak levels of 2014, a 15% dividend is not bad these days. Ofcourse the dividend can be reduced; which any sensible management would do. But in this case, the management seems extremely shareholder friendly with almost firm reassurance that the dividend will not be impacted.


Hydro_One_(TSX:H)_May_09_2018Hydro One is an electricity transmission and distribution utility serving the Canadian province of Ontario. Currently, Hydro One is trading at historic lows since its IPO. The underlying trend is bearish, while the chart pattern is Broadening Bottom. At this point the price can go either way. Currently, the support is being tested at the trendline (Dividend is around 4.4%). If price drops further (below CAD $20, then the probability that the price may go down further increases. However, if price does not drop further within the next few days, this is an excellent entry point as the probability of a price rise after an broadening bottom with an underlying bearish trend is over 50%.
The elections in Ontario (to be held in June) will be a critical factor in determining the mid to long term outlook for the stock. Currently, all parties (political) do not want the price of electricity to go up (the government is a large shareholder of the utility). However, after the elections these poll pledges might disappear as energy prices across all sectors tend to rise (especially during the summer months).

PAT Short-Term Reversal1. Multiple bullish hammers indicating that bulls are winning at the end of the day. Today, bulls really took over with a big move up.
2. The bullish candles are at PAT's lower bollinger band as well.
3. A slow stochastic is turning up from its oversold zone and there is also a MACD crossover
Trade aiming for 1.75 in the next few days.

KSHB is doing too well. Makes picky entry difficultGrab any under $5's. Any under $5.10's is okay too.


GGI Pullback- Buy now!GGI experienced a pullback in an up-trending market (Usually 3-4 days of pullback before its next move up).
Try to buy in around 2.90. I am expecting GGI to reach a level of 3.40-3.55.
Stop loss at 2.7 or approximately its trend line.

CADJPY - Expecting another 3-wave lowerShort term, I'm expecting another 3-wave down towards 83.57 level.
However, the overall bias for the longer term is still to the upside.
Disclaimer - this is not a trade call. Make sure you have a proper trading and risk management plan before executing any trades in the market.

Final pushA final upward push in price into the PRZ of the completed bearish Gartley on the Weekly chart could signal the end of the corrective sequence. Confluence with the AB:CD pattern on the daily TF, and the 1.8500 quarter point help make the case for a reversal.
If BoE decide to leave interest rates unchanged this May, it could trigger the reversal. I'm sitting on my hands on this pair until the intra day charts signal a clear reversal pattern.


Green Gold Rush, let's see what's happening..Bullish. This is one of the top producers.
Good exposure for this sector

Mean Reversion in FIRE?!FIRE has dropped down to the $1.60-1.70 range a few time in the couple months only to bounce back. This is probably a support level for FIRE.
Every time it hits its support level, a bullish candle is formed and it pushed towards $2+ in the next few days.
Basically, FIRE is shown movement that has been bullish historically.
The slow stochastic supports this oversold idea.
Short Term Trade, stop loss at 1.68.

Nice cup and handle pattern with breakoutBombard has long been a TSX laggard but, much like blackberry, its looking at big gains in 2018 following the release of C-series that was heavily delayed on many fronts (which was not good for them) In the last weeks it has broken through resistance that was holding it back for almost 3 years at the $2.80 region and has broken out from a cup and handle formation on exceptional volume.
I'd defenetly be looking to enter long around $2.95-3.00 region as this stock has become a beauty to hold again for 2018 from a technical and fundamental standpoint.

NZDCADThis symbol represents the New Zealand Dollar - Canadian Dollar cross pair. These two currencies are both categorized as commodity currencies. Canada is primarily associated with oil and lumber, conducting significant trade with the United States. New Zealand is more associated with agricultural commodities and exports dairy and meat products to Australia and China.


SHORT AUDCAD PLAYSTOP LOSS : 1.02547
TAKE PROFIT : 0.96055
Risk-reward : 2x
Longer term trend: Sideways
Current trend: Bullish
General comments:
Price spent most of its time in between the 1.012 and 0.9605 since 2016. Last week's candle pierced through the resistance and closed within the range. The wick is 2.77x of the main body with none at the bottom of the bearish pin - this translates into an excellent bearish pin, with a recommended entry point of just below the pin.
What I like:
1) Excellent candlestick formation, a textbook example.
2) Price can move lower and retest the resistance on the daily chart, creating another opportunity to seize the potential bearish move.
What I dislike:
1) Since this idea is based on the weekly chart, the stop loss is relatively far. This means volume of trade, permissible within risk limits, is low.
Other things to note:
I expect the trade to take around 100-200 days to hit the price target of ~0.96055.
* Do support by liking and following! All suggestions/feedback welcome!
x,
iskfx

EURCADThe Euro / Canadian Dollar denotes how many Canadian Dollars are needed to purchase one Euro. Crude oil is one of Canada's largest exports and as such, tends to be sensitive to fluctuations in crude oil prices and global growth expectations. The Eurozone is the largest monetary union in the world and one of the most popularly traded currencies in FX. Throughout history there have been numerous times the euro has been used as a funding currency during times of global economic uncertainty. The EUR/CAD typically has a slightly higher average true range than the majors, offering more opportunities to intra-day traders & swing traders alike.

Buy FCC now!A simple analysis of the uptrend shows the end of a pullback in the FCC uptrend.
FCC bounces back at 1.06-1.07. I see the next move up being up to 1.28-1.30.


Short term reversal in TSXV:EMC?The bullish hammers of the last few days indicate a trend reversal in TSXV:EMC.
Stochastic has been slowly climbing out of the oversold zone and it may just be the right time to buy in.
I am hoping to buy in around 1.44-1.45, and I will place a stop one ATR below at 1.31-1.32 which is below their 52week low (hopefully it holds).
