NZDCAD increase till end of 2016Year and a half old support line
'Curve' structure from June 2013 never been violated yet
Daily close above 0.7 Fib Level (start from June 2013)
RSI and MACD bullish
New Zealand economy healthy as main macro indicators show!
Canadian dollar might struggle given uncertainty around OIL prices (OIL broke important support last week)
Canada

USOIL Short - broke trendline range on CAD/CHF pair
- us oil broke trendline
- good r/r ratio
- been on a downward trend
- OPEC deal still confirmed / decided on
- will not go down forever (semi-short) term trade

GBPCAD | Fibonacci & EMA Analysis - Potential SELL SideGBPCAD
1. Inverted H&S
2. Rejection from EMA 100
3. Price stop right by Fibo 0.618
4. Weekly Currency Cross (CSS) Bearish
#GBPCAD
1. Inverted H&S
2. Rejection from EMA 100
3. Price stop right by Fibo 0.618
4. Weekly CSS Cross: Bearish
Estimations:
- As long as we dont experience bullish breakout on the new week open day, we will look for bearish breakouts for our entries.
Daily Free Analysis with Education:
telegram.me
Daily Free Signals with entries and exits:
telegram.me

AUDCAD Technical Analysis: Expecting correction to be overTalking Point:
Technical Strategy : Turning Bearish
Elliottwave View: Expecting completion of wave (C) of c.
Analysis
AUDCAD was trading sideway from Aug-2013. We were seen May-2015 a declined again but unable to takeout Aug-2013 low in impulse manner. We experienced a bounce from 9170 area in May-2015. However, upside was corrective and can be counted as flat correction in elliott-wave. With that in mind, we are expecting correction should be over sooner and can be seen impulsive declined from 1.022 to 1.023 area.
Action
We are waiting for decline and it's confirmation before entering into market. Until then we are sideline and looking into future development.

EURCAD - Bouncing off support! Regardless of Canadian CPI announced today. EC managed to hold out the support level of 1.438, we see it likely that this will be followed with another leg UP.
-Trend line held since 2015!
-Fib level
-All smaller time frames RSI, Stock and MACD oversold
-Daily RSI picking up from oversold territory hinting to another leg up
-Double Bottom (-ish)
Safe and successful trading!

BUY Signal - Repeated in the PastThere are several identical BUY signals in the past, however this time we are in a bit of a down trend so I will not expect the price to break past the SuperTrend v1.0 at 1.3254 .
I am wanting to close out in profit just before it hits that level and then see a pull back.


USDCAD - Potential for Long!USDCAD, With it going down into small slump my prediction is that it will rise back to it average level.

USD/CAD RISE FOR THE WEEKBased on my naked analysis, I started on the monthly and noticed that my blue EMA was still above my red MA. To me that indicates that the trend for this market is still bullish. Last week this pair ended off in a bearish trend on my lower time frame chart (1hr) which you can see on the chart after 4 levels of drop.
The pair now looks like it is forming an inverted head and shoulders. According to price action this pair has gone up almost 30 pips since the open of the market today. I expect this to hit the 1.29358 support after a short rise and then rally off for about 3-4 levels of rise.

GBP/CAD: Almost 1:5 Risk to Reward RatioLooking at GBP/CAD on the daily time frame price have made its first bearish leg, pullback is now for selling as I am looking to trade the second leg down. On the 4 hour chart MIDAS R1 (launched from 2016-08-03 12:00) have successfully captured the pullback together with a TD-Price Flip on the 1 hour chart. This potential trade setup have a great Risk to Reward Ratio of almost 1:5 giving this the top spot on the watch list for next week.
MIDAS Trading Tools for MT4 is available to download @ MQL5.com

Trade opportunities on USDCADTrade opportunities opening up on the triangle on USDCAD.
If your ballsy then buy now.

TWO SCENARIOS FOR CADJPYFor shorts: Clear break and few candle closes below 79.609 will push it even lower to target 76.741
For longs: Rejection at 79.609 and 78.932 would signal a good entry for longs. ABCD completes at 85.230


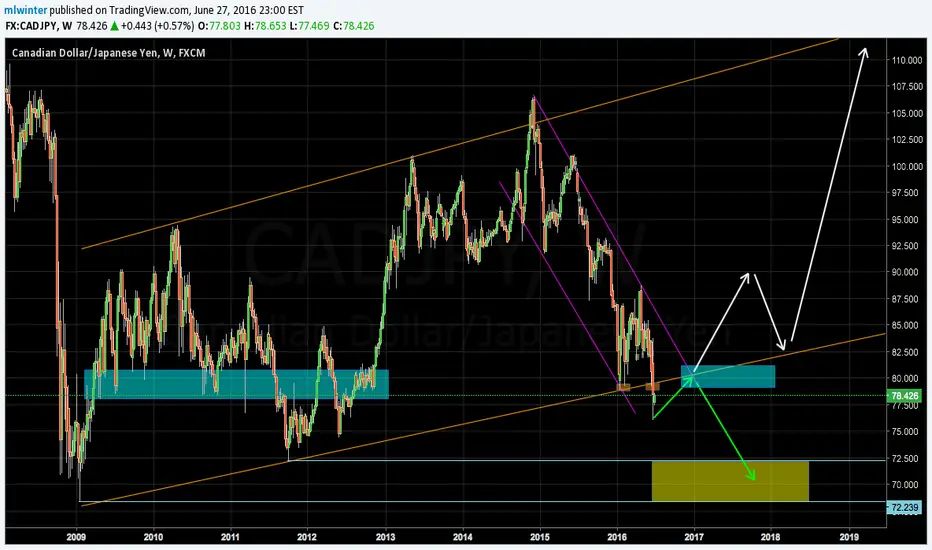
TWO SCENARIOS FOR CADJPYFor long: Looking for breakout candles in blue box and then retest. Then long for mega upside move.
For short: Looking for bearish rejection in blue box. Targeting yellow box
CADJPY Short term sell setupJust broke a very strong support (3 yellow boxes). Short when price pulls back to 82.250 area to target 79.270. Possible a bounce in orange box due to bottom of monthly channel.

What's next for the TSX Composite Index? According to investing.com, the average of 27 analysts polled in April shows year end target forecast of 13550. Weekly RSI is approaching 60, with the upper weekly bollinger band starting to level off. Technically the chart appears to indicate the price trend is now towards the upper side of the trading range and offering a less attractive 'risk-reward' ratio after achieving over 18% return from lows earlier this year. Trading at a PE of 17x forward earnings estimates the index certainly isn't undervalued. However, in comparison to the decreasing global yields in our contemporary world of NIRP, the TSX index remains attractive to the 'buy and hold' investor for it's dividend yield of nearly 3%. Yield hungry investors may continue to bid up the price of the TSX, as it offers a substantial 'risk premium' spread over 10 year government bond yields.
The TSX generally shows a very high correlation to the price of oil (at about 90% on the 20 day average). The index will likely continue to closely track the price movements of WTI going forward.
The latest price drop in WTI shows weakness in a resistance level of near $50. Note latest weakness against upper bollinger band. Also weekly RSI of 64 is the highest in 8 months. The 'round figure' of $50 also likely serves as a kind of 'psychological' level in the mind of traders.
The B.H. rig count has not only stopped falling and flattened out, but actually seems to be rising. A year ago when the rig count stopped falling, WTI dropped sharply to reach new lows.
Canadian investors can own the TSX composite index using the iShares E.T.F. trading under the symbol XIC. American investors can buy the iShares MSCI Canada E.T.F which trades under the symbol EWC, offering access to 85% of the Canadian stock market and a lower yield of 2%.
I'm interested to hear from any interested TSX traders and investors. Let's get a dialog going! Please do share your thoughts and insights!
