Brent Near-Term OutlookBrent crude has been able to rally on little volume during the U.S. banking holiday and rumors surrounding a potential unified OPEC production cut, issued by the UAE energy minister just as WTI was carving out a 12 year low (and in the middle of the night, local time, no less.)
Four days later, there has been no new reports of said production cut proposal, but something interesting has been reported by Charles Kennedy at Oilprice.com - " UAE Offers India Free Oil To Ease Storage Woes ."
There is still no reason why OPEC would cut production now given the distress its tactics are already causing in the U.S. shale space. To cave in now, OPEC's squeeze on U.S. shale would be a failure and U.S. shale would be a beneficiary.
The same UAE that sparked the latest crude short-squeeze has so much oil, it's bribing India with free oil in order to access a underground Indian storage facility to park abundant reserves. Go figure.
Despite OPEC's true unwillingness to cut production, the technical outlook for Brent could prove positive unless risk sentiment is turned off.
Currently testing price resistance at $33.81, Brent crude has found support at two key weekly support levels: $27.83 and $31.59. The ADX is showing a lack of momentum in the current move, but +/- DMI could, potentially, have a bullish convergence.
The growing tensions between Saudi, Turkey and Syria could reignite risk premium, but many analysts have suggest that any substantial premium is unlikely due to the current supply glut. Even so, resistance at the 50-day EMA coincides with a minor downtrend.
However, a break north could test $38.46 to $40.34. If price breaks down, Brent could easily retest $27.83, while more talk of not cutting production would send the international benchmark to $22.98.
Please feel free to comment and share charts! And follow me @Lemieux_26
Check my posts out at:
bullion.directory
www.investing.com
www.teachingcurrencytrading.com
oilpro.com
Canada

Implications of Risk (CAD, WTI and Bonus Chart)CADJPY has been setting up to become a great selling opportunity on a macro-standpoint for the following reasons:
I was looking for a drop well-before today's action:
twitter.com
twitter.com
twitter.com
twitter.com
Fundamentals in a nutshell:
CAD is highly correlated with WTI crudeoil, both on a fundamental and technical level. There still is no tangible catalysts to cause a significant rally in oil prices. Perceived catalysts have yet to amount to anything substantial. Still, there is no producer willing to cut production as of yet. Furthermore, the macro outlook for Canada is continuing to look like a poor one.
JPY is a proxy for risk, which is signalling further turmoil in risk assets, and the correlation of such assets do not bode well for oil prices. Despite BoJ's meandering into NIRP territory, it has been dubbed a policy error almost as quickly as the Fed's single rate hike in seven years. Japan's Finance of Ministry may call of 10Y auction of bonds for the first time ever on fears of negative rates.
Still forecasting the US business cycle ending, with a recession in 2016. As with my previous Russell 2000 posts (correct but early!), small caps are supporting the "FIFO" what it comes to domestic economic weakness. Still see a bear market in US equities.
Technicals in a nutshell:
Price action rallied hard from an oversold position on two fronts: the rumor of a Saudi-Russian deal to cut production (which was refuted by Saudi twice), and the BoJ's decision to cut rates (which occurred as crude stalled). Clearly, if the production cut rumors amounted to something more than talk, clearly that is bullish. However, we must look at it as what is happening and what may happen (from highest probability) and not what we want.
The price action on the daily stalled within a long-term demand zone as both positive price action (+DMI) and ADX continued to slope downward. RSI is well out of oversold territory, which gives traders room to continue selling post-squeeze.
The stochastic indicator is giving a great sell-signal on the daily chart.
Note: indicators on tradingview do not mirror those on my MT4 but are close. I use a 9,3,3 on stochs.
BONUS CHART:
USDJPY, essentially risk appetite, is trending lower on the monthly chart (this particular chart I made last month but decided to show my awesome readers!).
If global fundamentals and aversion to risk occur as I believe, we could see 110 this year. I expect their will be more yen strength even as the dollar remains supported.
As I noted when I was on Dukascopy TV in 2014, the Bank of Japan is running out of "tool," as was unlikely to further increase QE. Moreover, traders would loose their faith in central banks and their ability to prop up markets. We're seeing that now.
Please feel free to comment and share charts! And follow me @Lemieux_26
Check my posts out at:
bullion.directory
www.investing.com
www.teachingcurrencytrading.com
oilpro.com

AUDCAD: Potentially very interesting setupIn the current enviroment, it's nice to add a 'long Canada/short Asia' trade, and this is what this setup is.
Currently the trend is up in the weekly but there seems to be a chance for a sharp decline in the daily chart.
Risk to reward makes for a great trade if it works, so it's worth it to risk at least 1/2 position on it.
Props to @Synapse here for mentioning this pair to me today, I've been waiting to long Canada again, and this seems like a good vehicle for such trade.
Good luck if taking it!
Cheers,
Ivan Labrie.

Cineplex Stock PricesThis chart illustrates Cineplex Inc.'s stock price progression from November 2014 to present day.

Cineplex's Stock PricesThis chart illustrates Cineplex Inc.'s stock price progression from November 2014 to present day.

Cineplex's Stock Prices This chart illustrates Cineplex Inc.'s stock progression from November 2014 until the present day.


Canopy Growth Corp. Stock PricesThis shows the stock prices of Canada's largest medical marijuana company.

Air Canada Stock PricesThis chart follows the decline of Air Canada stock through 2015 and into 2016.

GBPCAD is about to head southWith the Canadian Dollar reaching to an extreme against the USD we are trying to find the bottom for the CAD on all pairs and it is more clear now that we will reach a primary bottom for the CAD very soon.
When we look at the GBPCAD long term trend it is clearly a downtrend and the uptrend started around 2013Q1 is a corrective 5-3-5 trend.
In wave C, the fifth wave is the extended wave (instead of 3) and out projection for wave 5 is to be 1.618 multiplied by the travelled distance of waves (1) and (3).
The red box represent the area we are expecting to see a reversal around.
Happy trading :)

TradetoStart Week 8: USD/CAD longWe will wait for a little pullback to the 1.40 level and buy from there.
This pair is ALL BULLS.


Time to go long Canadian Dollars/Short USDCADI think this is the time to short. Fairly low risk trade. Too much pressure at 1.40 - think it will definitely hold. If I get stopped out I will update as I will probably make an attempt to get back into the trade. I am bullish on cad dollars at the moment.
USDCAD Testing 12 year high of $1.40So the disappointing Core Consumer Price Index (MoM) print earlier has sent the USDCAD hurtling towards the psychological price of $1.40 which hasn’t been broken since August 2003! In addition to this, it’s no secret that the tumbling oil price has been a contributory factor to CAD weakness. Due to the strength of the resistance, I would expect a pull back to $1.283 before any further gains.
The latest Canadian Consumer Price Index print print can be viewed her, if any of you are looking for something riveting to read...
bit.ly

GBPCAD LongPrice broke the desc. TL
Made a 3rd bounce from the asc. TL
Bounced off of Major resistance
(Which is also the bottom of the weekly consolidation range price is now in)
2 Targets. 1 at top of range and one at next key res.

USDCAD: Price is trading on decision point.It's on decision point. Either break or make. It also having nice long opportunity present with today's low for targeting 1.35.
We are still expecting another leg is due before having any reversal. More specific, we are expecting leg can be extended for 1.36. Daily close below trendline will give signal of reversal.

Bombardier's Government "Bailout" Hurting Shareholders
Preface
It comes to no surprise that once again the Canadian "too big to fail" manufacturing giant, Bombardier, is suffering against competition due to a low inventory turnover ratio and a CSeries line of Jets that just isn't selling. In their last quarterly report Bombardier made no recognition in the notes to the financial statements of the fact that they were behind on production. A quick inventory turnover ratio analysis suggests otherwise but the highlight this week is the failing CSeries Jets and the Quebec government's so called "Bailout" strategy for the program.
Breakdown
- The Quebec government invested US$1 billion (CA$1.3) for 49.5% of Bombardier's CSeries and 200m warrants for BBD.B.
- The government is not in for the money, but to solve a confidence crisis. The CSeries is not expected to deliver free cash flow until 2020.
- Bombardier's CSeries is in a Catch-22. The CSeries program can't survive without orders, and there's won’t be orders unless the CSeries program survives.
The Bailout
Bombardier Inc. is primarily traded on the Toronto Stock Exchange under the tickers BBD.B and BBD.A. Class A has ten votes per share, and Class B has one vote per share. The Beaudoin-Bombardier family has 54.35% of all the voting rights. BBD.B is the most commonly traded ticker.Investissement Québec, the government's investment arm, announced a partnership with Bombardier that would regroup the asset liabilities of the CSeries project. For US$1 billion (CA$1.3b) and warrants to purchase 200 million shares of BBD.B for $2.21 each, Investissement Québec will own 49.5% of the partnership. The exercise price of the warrants is 58% higher than the current stock price of $1.40, and if exercised, it would make the government the largest owner of Class B shares. In exchange, BBD promised to keep its headquarters in Quebec for the next twenty years and CSeries-related activities. BBD will get US$500m on April 1, 2016 and another US$500m on June 30, 2016. By the way, it's noteworthy to mention that this is not the company's first instance of governmental aid. Different levels of government have backed Bombardier time and again over the decades.
How Does This Hurt Shareholders
Governmental aid has proven in the past to ruin the overall trust and reputation of share prices persuading investors to think of Bombardier as a unstructured company using taxpayer funds to operate. Shareholders equity margins have decreased substantially over the past couple of months highlighting that Bombardier's return on equity as under performing. By simply reading the Management Discussion section in their annual report investors greatly shy away causing bearish runs and short lived positive divergences. Lastly the 200M warrants held by the Government discourage future investors from going "Long" on the Class B shares (BBD-B.TO) with fear of the warrants being exercised beore expiry and possibly hurting the share price.

Talk about rejection! Oil destined for $42.00Talk about rejection! Today we saw some crazy dollar strength. As of 3pm, the dollar had made a 100% retracement or 214 bps round-trip from this morning's ECI drop. The market gave a clear signal that it believes - or rather, more likely, wants , a Fed rate hike. That's all that matters, folks. Oil is heading lower.
What's more, the technicals strongly support the move. This week we saw a two day counter-trend rally move oil up 6%. With today's price action, we have a firm rejection of the counter-trend rally, which means the downtrend is still intact and the move lower can proceed. Today, we also saw the futures break below the lows set prior to the counter-trend rally, a level that also corresponded with the 76.4% fib retracement of March's rally to 2015 highs.
100% is the next fib retracement level at 42.00, which falls within range of a fib extension zone b/w 41.55 and 43.25. The pace of the current downtrend from late June predicts 42.00 within 13 days.
Keeping in mind the absolute and relative low levels of oil volatility (versus other asset classes) could cause that move to come much faster. A long vol, bearish options strategy might be a useful way to play the move. Next week I plan to take some profits in my 45 puts and roll into shorting the futures directly.
Also, keep the Mexican Peso on your watch list. My macro thoughts are OIL --> CAD --> MXN.

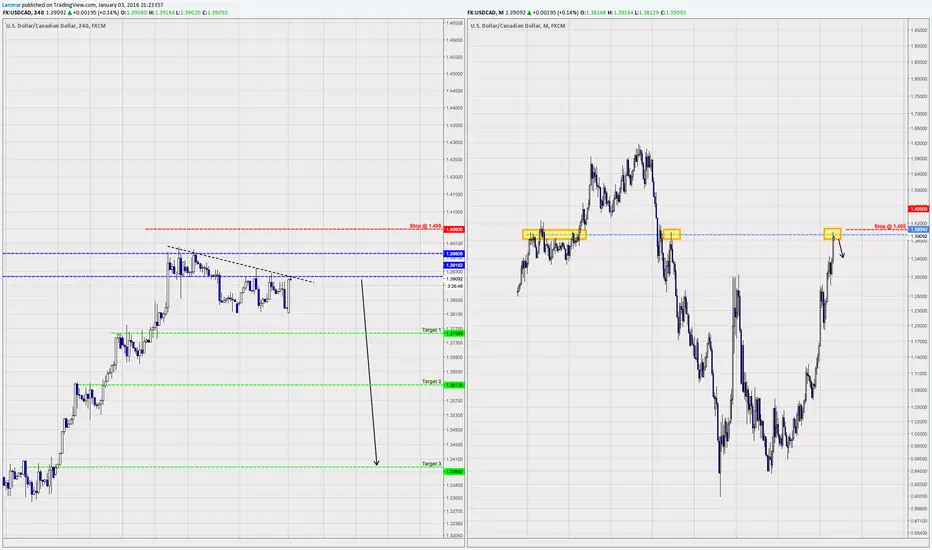
USDCAD: Daily Gartley PatternUSDCAD VIDEO (www.youtube.com) Obviously I'll be playing the sidelines today due to the Non-Farm release, but for you longer term traders, we've broken past our B leg which means it's time to pay attention to the bearish Gartley.
This particular pattern comes in at a very nice level of structure (looking left) where price consolidated in the past before a markdown. This doesn't mean that the level will hold again, we never know in trading, but it does show that the market has respected this level in the past, and as a pattern trader all you should be looking for is a brief pull back.
Good luck for anyone getting involved in this one.
Akil Stokes
Chief Currency Analyst at www.TradeEmpowered.com
Akil@Tradeempowered.com /@AkilStokesRTM /
Forex Weekend Review Videos (Every Thursday):
www.youtube.com

Canadian Pacific Railway Likely Future MovementLong term trend resistance and Fib Resistance channel lead me to believe that CP Rail is about to take a dive.
A healthy retracement is required for long term growth to continue.
Comment your thoughts!
Happy trading

GBPCAD 4 HOUR LONGPRICE AT AN IMPORTANT KEY LEVEL AND JUST BOUNCED OFF THE RESISTANCE TURNED SUPPORT FORMING A DOUBLE BOTTOM. ALSO THIS KEY LEVEL IS IN CONFLUENCE WITH THE 0.5 FIB LEVEL. GBP AVERAGE HOURLY EARNINGS IS EXPECTED TO COME OUT BETTER AT 2.2% AND THE REASON WHY THIS IS IMPORTANT IS BECAUSE THE BOE (BANK OF ENGLAND) SAID THEY'LL BE MONITORING HOURLY EARNINGS DATA. IF THIS DATA DOES COME OUT GOOD WE SHOULD SEE SOME DECENT STRENGTH IN THE POUND. A BREAK OF THE COUNTER TRENDLINE WE COULD EASILY REACH TO THE SWING HIGHS AS I BELIEVE THE UPTREND IS STILL VERY MUCH IN TACT.

Potential Bullish Flag Breakout Into A Bearish BatA lot of news coming out this week for both CAD and AUD but on the technical side of things what I see is a bullish flag pattern forming within the C to D leg of a potential bearish bat pattern. I don't trade flags the same way i trade advanced patterns but I do like when they come back into previous structure as in this case so it's something I will certainly be keeping my eyes on to see if I will get a chance to be involved.
If so you can look to ride price action up to the potential bearish bat and then stop and reverse putting yourself short the advanced pattern. Not that this means much as I don't have that much of a bearish bias, but the Bat completion would also give us a valid C leg of a much bigger Gartley pattern located on the daily.
If you want to get a better idea of how I trade please check out my YouTube page where I have over 100 FREE trading videos posted. www.youtube.com
Also for day to day insights of what I did in the markets and what lessons were learned from it check out my blog at ratiotradingmentor.com

Bullish trade on GBPCAD for 2015The GBPCAD cross looks like it's been consolidating with a flag-like movement since the start of 2014, and this may lead to an eventual bullish leg to fresh multi-annual highs in 2015. Fundamentally, I like being short the Loonie dollar as crude oil's plunge this year should lead to disinflationary pressures in Canada with a possibility of seeing the Bank of Canada revise it's inflation forecasts downward for the next year or so. Meanwhile, while the BoE maintains a cautious approach with regards to a rate hike, that lead to the bullish GBPCAD breakout in 2013, I believe that the British Pound will remain stable next year. This will likely lead to further gains for the GBPCAD cross, and I will be looking for a monthly break above 1.84 to start anticipating an acceleration to fresh highs above 1.8670 (Feb. 2014 highs). If this happens, I think we could see 1.92/93 CAD hit within a couple of months following a break above 1.8670.
