JPY BASKET SELLING OPPORTUNITYJPY BASKET For basket selling opportunity is high probability due to yearly analysis , sellers are more strong as we have seen 12M candle of 2022 we manage to create all time LOWS and that is where we are heading because sellers are maintaining their selling pressure / opening price are defended
Canada

CAN60 Index short ideaCAN 60 is eeking towards a high value area. If we get a rejection and lower timeframe continuation pattern, this will signal a valid trade.

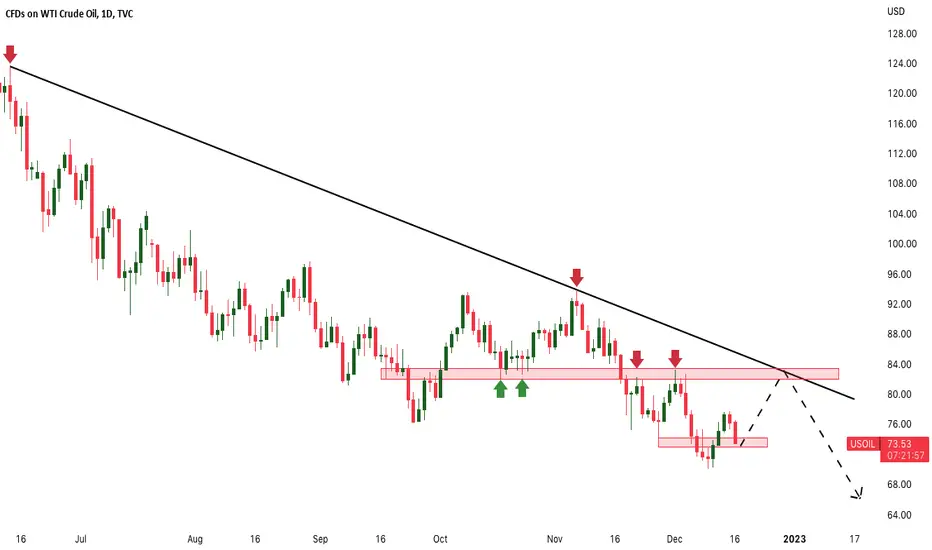
USOIL Potential downsidesHey traders, in today's trading session we are monitoring USOIL for a selling opportunity around 82 zone, once we will receive any bearish confirmation the trade will be executed.
Trade safe, Joe.
CAD/JPYWith Canada beginning to ease off on interest rate hikes, we may start to see the Canadian dollar begin to add strength, with us approaching the 5-month lows for the CAD/JPY at 99.49
this may be the last chance to jump on the bearish bandwagon before we see a potential rebound.
We do however still have a way to go if we were to possibly re-test the 98.00 level which has not been seen since May this year.
The current descending triangle we find ourselves in, provides the opportunity for a short position, where we look to enter at the top of our resistance channel.
Depending on how the market structures itself within the entry zone will determine when and how we enter this trade.

cadjpy, longAs you can see in the chart, due to the weakness in the decline and the reaction to the support level, I expect an upward correction first, and then I will update the analysis if there is a reaction to the resistance level.
Stay with me to get more analysis after following me by sharing with friends and leaving a comment.
According to my risk and capital management system, the risk of each trade is one percent per position.
What do you think about this analysis and other analyses?
What symbol would you like me to analyze for you?

Walking Inflation (Canada)heres a 6-7 years period of walking inflation - the government talks about 2% but its been four decades since they last had 2% inflation so walking inflation-----more up to date likely in this time of age--- like flagged comment follow do as you choose - take care

CAD JPY H4 / SELLHELLO !
ENTRY : 108.900
TP : 107.802
SL : 110.407
EXPIRE : 1 NOV 2022
------------------------------
The reason for entering:
1.reducing the skewness
2.coefficient of the canal roof in 4 hours

Euro / Dollar returns above parityEUR/USD 🔼
GBP/USD 🔼
AUD/USD 🔼
USD/CAD 🔽
USD/JPY 🔽
XAU 🔼
WTI 🔼
Underperforming earnings from tech giants Alphabet (GOOGL) and Microsoft (MSFT) have sent major stock indices reeling. As Alphabet and Microsoft’s stock prices have dropped 9.14% and 7.72% respectively, signs of a slowed economy are likely to make the Federal Reserve slow down on the rate hikes in December.
Meanwhile, the news has also weakened the greenback, allowing EUR/USD to surge above parity and stabilized at 1.0077. Later this afternoon, Mitrade was informed that the European Central Bank is expected to raise rates by 75 basis points to 2.00 %. AUD/USD closed higher at 0.6497 with notable gains.
Although the British Parliament is still heavily divided as the new Prime Minister is in office, GBP/USD led its peers by adding over 150 pips to 1.1627. The Bank of Canada only increases its interest rate by 50 basis points - lower than the estimate of 75, USD/CAD fell to a low of 135.13 and recovered to 1.3551. USD/JPY declined further to 146.35.
With investors looking forward to a less hawkish Federal Reserve, gold prices rose steadily to $1,664.76 an ounce. Despite an increase in crude oil inventories by 2.59 million barrels, WTI oil futures have increased to $87.91 a barrel.

USDCAD Analysis - 26 OctoberHello Guys, Today's Analysis is on the USDCAD Symbol in a 1H Time frame, I Hope it Will be Useful for You, Don't Forget to Like, Follow, Comment

InvestMate|EUR/CAD Time to fall. Long-term in-depth analysis.💶EUR/CAD Time to fall. Long-term in-depth analysis.
💶The Euro situation does not look very interesting.
💶The market consensus is that economic growth in the euro area will slow down.
💶The situation is saved by the low unemployment rate of 6.6%.
I would add that this is the lowest unemployment rate ever recorded.
💶Unfortunately, the situation in the labour market is not helped by rising inflation, the next year-on-year reading of which is due on 31 October, and which could return to 10% or even beat it.
💶The euro is still a cheap currency. This is compounded by relatively low interest rates compared with the USA, Canada, Australia and the UK, where they are sometimes many times higher.
💶The interest rate in the EU is only 1.25%. On 27 October we will find out what the next decision will be, with the market expecting a sharp increase of 75 basis points to 2%.
💶The war in Ukraine and the tense global situation have thrown in their two cents, resulting in the EU having its lowest trade balance in history at €-50.9B this month. Europe is definitely importing more than it is exporting, which is not healthy for the economy.
💶The PMI for industry has also only been falling and falling since January. It has fallen from 58 points to 48.10 currently.
tradingeconomics.com
💶Finally, I would also like to draw attention to consumer sentiment, which stands at -27.6. These are once again the lowest levels in the history of the European Union. We will find out how they are for October on 28 October.
💶As we can see, the situation in the European Union does not look colourful, much of this data has already been discounted, but I believe that the market has not discounted the economic impact that such a persistent situation could have on the future of the European Union.
Moving across the ocean to Canada.
🍁There, too, economic growth is forecast to be slightly lower than previous readings but we do not see as much divergence as with the euro. tradingeconomics.com
🍁Unemployment remaining low at 5.2%.
🍁Inflation slowly slowing The latest reading on 19 October indicated 6.9% which, compared to the peak of 8.1% recorded in June, offers a breath of optimism.
🍁Interest rates definitely higher than in the EU. At 3.25%. With the next rate hike due on 10 October, the market assumes it will be a 75 basis point hike to 4%.
🍁Trade balance at a high of C$1.52B in August. On 3 November we will find out how much it amounted to in September. Canada is now seeing very strong trade volumes. The highest in a decade.
🍁Manufacturing PMI low of 49.80 points.
tradingeconomics.com
🍁The Consumer Confidence Index is falling but neither all-time highs nor a "crisis" state is just low at 48.51 points.
tradingeconomics.com
🍁As we can see, Canada's economic situation looks decidedly better than that of the euro area.
🍁Will we see this reflected in the chart of these currencies?
🗠Looking at the chart we see that EUR/CAD has been in a downtrend for almost 2 years now. The trend definitely took a turn for the worse after the outbreak of war in Ukraine.
🗠Since 22 August, an upward correction of 5.53% began on the downtrend.
🗠But over the last month we do not see the strength for a further upward breakout. On 18 October we made a double top formation and immediately recorded a decline. Is this a sufficient signal for a decline?
🗠Looking at the euro compared to other currencies where it is definitely stronger and the rebound was definitely more blunt. Only on the dollar did we not see such a big increase because the dollar has also been on the rise for the last few weeks.
🗠Coming back to EUR/CAD, we are currently at the resistance levels set in April and July this year, these are the 1.34-1.35 levels. We can see that the price is struggling to break through them.
🗠As for taking positions. This seems to be a good time to take positions, either to wait for a retest of the 1.34 levels after the declines and attempt to rebound from below.
🗠Or setting a stop above the recent highs above the 1.36 level, with a target somewhere at the new lows. I am a fan of not setting targets but observing the situation as it unfolds, but in this case the level of 1.25 seems to be the most reasonable in case the falls continue.
🗠I don't want to bore you with indicators, but looking at any of them we can clearly see a downward divergence.
🗠Also the direction is known. Trend is set, stop and target known, I invite you to follow this pair. I am very curious to see what the coming week will bring.
🚀If you appreciate my work and effort put into this post I encourage you to leave a like and give a follow on my profile.🚀

ETHUSD SELL TODAYEthereum analysis today is a simple but effective analysis. I wish you a happy trading day and a happy holiday

Inflation Canada well I am continuing these charts till we hit my stop loss and go down---
if you look at my indicators you will see inflation is at 2% in canada right now and will continue being 2 percent for a while---I dont think it will do a uturn for a while I think we are stabilized at this point for a while.
thanks for reading - if your policitians get this to the right people please inflation isnt real-- it takes a 5 or 10 million trade to make 160 trillion on here lol----

Recession Probability Outcome heres my chart im going be posting and looking at over the next year
something that will be on everybodys mind come election and new year--
how to tackle inflation and recession--- probabilities.
I am neutral for which I dont have many indicators that will work with this i dont believe
so I will have to do some searching on google- for some examples of indicators and write my own with this--- on the second chart I post for this exchange.
Recession probabilities.
The base or starting line--for this project--will be adjusted and watched with due diligence.
We will adjust and continue working with this project as months progress into the future.

Buy and hold priceAnything under this price looks like a good entry to buy and hold. Sysco is the main supplier and distributor to restraunts in Canada and is looking to keep expanding.

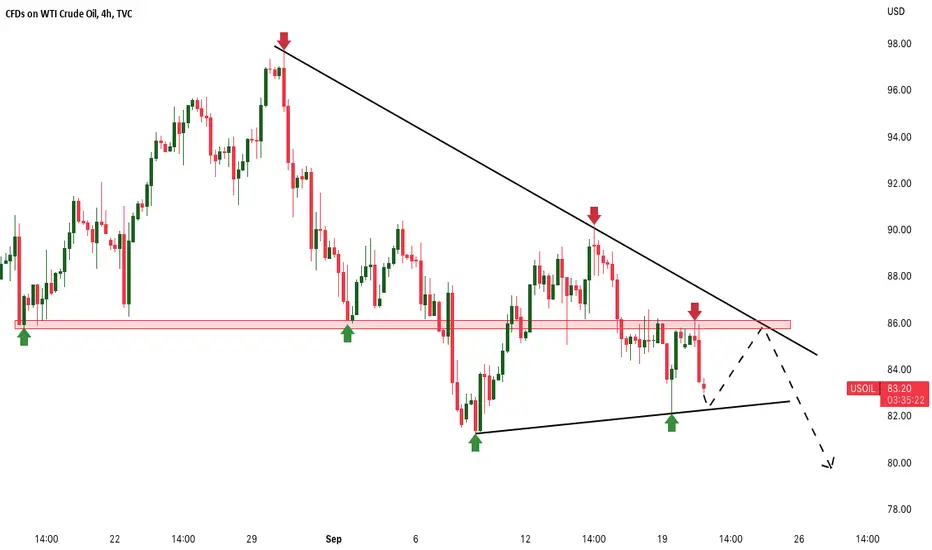
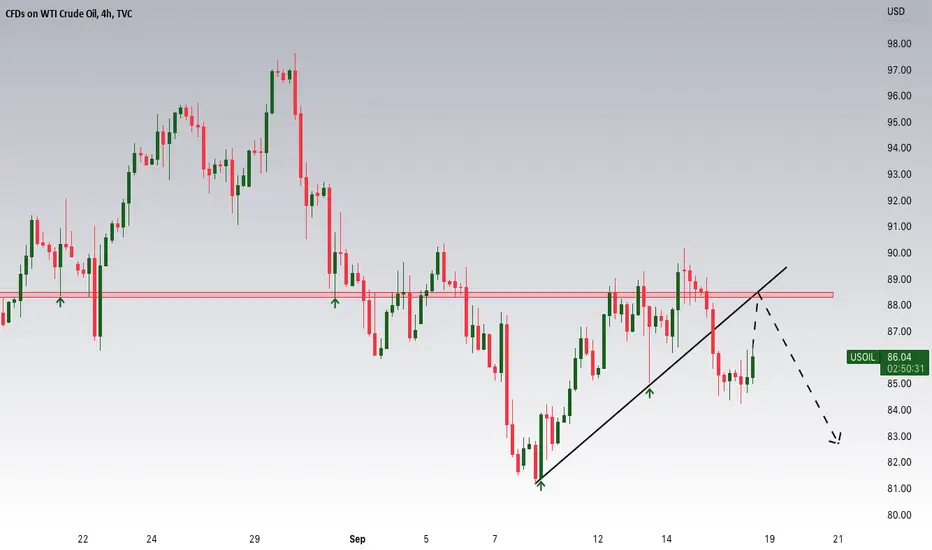
Only if you don't have a car you will disagreeHey traders, in today's trading session we are monitoring USOIL for a selling opportunity around 86 zone, once we will receive any bearish confirmation the trade will be executed.
Trade safe, Joe.
Only Traders that don't have cars will disagree about this idea!Hey traders, in today's trading session we are monitoring USOIL for a selling opportunity around 86 zone, once we will receive any bearish confirmation the trade will be executed.
Trade safe, Joe.
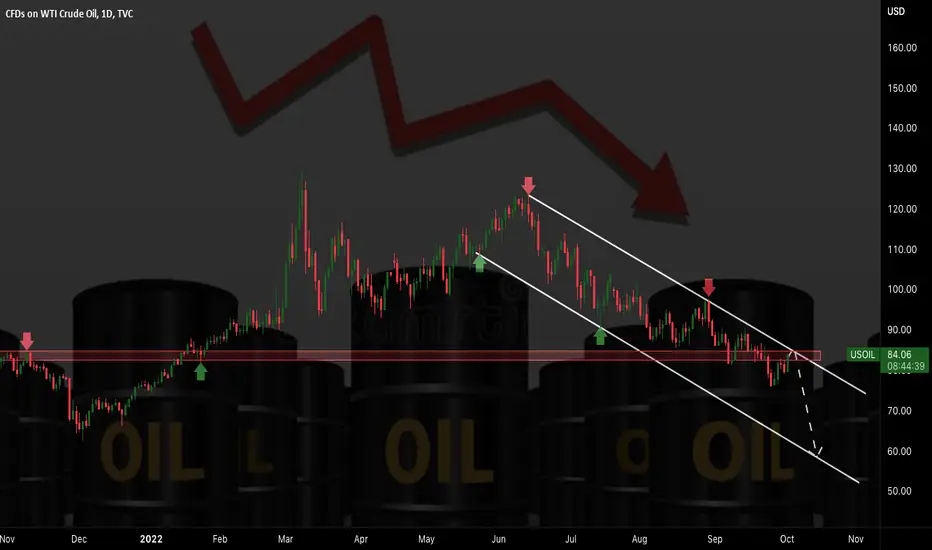
USOIL: Will the commodities continue collapsing?Hey traders, in today's trading session we are monitoring USOIL for a selling opportunity around 88 zone, once we will receive any bearish confirmation the trade will be executed.
Trade safe, Joe.
USDCAD Potential for Bearish Momentum | 12th September 2022On the H4, with the price breaking the ascending channel , below the ichimoku cloud , and there’s a possible “double top” pattern, we have a bearish bias that the price may drop to the sell entry at 1.29910, which is in line with the current swing low. If the sell entry is broken, the take profit could be at 1.28938, where the overlap support and 61.8% fibonacci retracement are. Alternatively, the price may rise to the stop loss at 1.30958, where the “neckline” of the “double top” pattern and 50% fibonacci retracement are.
Any opinions, news, research, analyses, prices, other information, or links to third-party sites contained on this website are provided on an "as-is" basis, as general market commentary, and do not constitute investment advice. The market commentary has not been prepared in accordance with legal requirements designed to promote the independence of investment research, and it is therefore not subject to any prohibition on dealing ahead of dissemination. Although this commentary is not produced by an independent source, FXCM takes all sufficient steps to eliminate or prevent any conflicts of interest arising out of the production and dissemination of this communication. The employees of FXCM commit to acting in the clients' best interests and represent their views without misleading, deceiving, or otherwise impairing the clients' ability to make informed investment decisions. For more information about the FXCM's internal organizational and administrative arrangements for the prevention of conflicts, please refer to the Firms' Managing Conflicts Policy. Please ensure that you read and understand our Full Disclaimer and Liability provision concerning the foregoing Information, which can be accessed on the website.

Bank of Canada raised its interest rate by 75 bpsEUR/USD 🔼
GBP/USD 🔼
AUD/USD 🔼
USD/CAD 🔽
USD/JPY 🔼
XAU 🔼
WTI 🔽
Coinciding with the greenback’s softening, the Bank of Canada raised its interest rate by 75 basis points to 3.25%. USD/CAD rose to 1.3125, and USD/JPY reached a high at 144.99, then retreated to 143.7.
EUR/USD briefly surfaced above the parity before closing at 0.9999, as the market expects a 75 basis points rate hike from the European Central Bank tonight.
The Pound/Dollar pair closed higher with minor gains at 1.1525, after sliding to a low of 1.1413, not seen since 1985. Although the Australian trade balance only recorded an $8.733 billion reading, considerably lower than the original estimate of $14.500 billion. The GDP results were not far from the mark, a 3.6% quarterly increase enabled the Aussie to climb to 0.6769 against the US dollar.
Gold futures recovered and stabilized at $1,727.8 an ounce as the greenback eased. Slowing global demands saw WTI crude futures returning to pre-Russian invasion levels at $81.94 a barrel.
More information on Mitrade website.

Short idea on USDCADEnergy prices are rising and it helps Canada to be valued higher
On the other hand, there is a risk that many sellers are waiting to hear the news of the nuclear agreement with Iran
Short position in higher value of USDCAD it can be a good idea
sellers are waiting on supply area for this pair is 1.32941 to 1.3399 area

GBPCAD Short opportunityThis currency pair has more room for decline.
The general trend of this currency pair is downward. Britain is suffering from a family spending crisis that is weakening consumer power. Political uncertainty also has a negative impact on the pound. On the other hand, the Canadian dollar still enjoys the flexibility of the US economy and usually follows it.

USD/CADHello every one i think this pair is a swing trade, with sell position starting now. Last time we hit this level was mid July and that time it just crashed. Now we are on the same level and a very patient trade would be nice and very profitable. Guaranteed if you open a short possition on this pair. On Thursdays I like to trade in the afternoon in my time zone which is pacific timezone until about lunch time of Friday. This particular trade I definitely will be holding for a while. I loaded up alot of funds for this trade and my strategy is to constantly add in new shorts possitions through out the couple weeks I plan to leave this trade open. I literally just opened an 18 lot total trade for this pair and I am up about 1700 USD(15 MINUTES). I just have a very good feeling about this trade. I know forsure I will come out with big profits on this. More bad news is gonna just keep happening in US market. Recession will be in full effect. The announcement of interest rate hikes will most likely make things worst and this coming up next announcement it is expected to go up by 1%. Which means USD is gonna be less valuable. Canada is not there yet. Canadian economy is pretty good right now so yeah trust me guys.
My entries were :
1) Shorts 1.31522 - 2.5 Lot
2) Shorts 1.31521 - 2.2 Lot
3) Shorts 1.31466 - 5 Lot
4) Shorts 1.31461 - 5 Lot
5) Shorts 1.3440 - 3.3 Lot
Total of 18 Lots so far. Will add more as more profits are won.

Short to Mid Term Swing Trade Opportunity in OBE Obsidian Energy is showing strong quater over quater growth in revenue and net income
energy sector is strong. Chart pattern trading opportunity following the channel.
Long to the upper channel resistance line AMEX:OBE
