Forex Bank Job: CAD/JPY Profit Extraction Strategy🏦 "Operation Loonie Lift-Off" – CAD/JPY Forex Heist Blueprint! 💰💣
🌟Hi! Hola! Ola! Bonjour! Hallo! Marhaba!🌟
To all fellow Market Bandits & Profit Seekers, 🕶️💸💼
We’ve scoped out our next target – the CAD/JPY vault – and the blueprint is ready. This isn’t just a trade... it's a full-blown Forex infiltration mission based on undercover technical and fundamental recon 🔎📊.
🎯 The Mission Plan:
📍Entry Point – The Vault's Backdoor
💥 Strike at Pullback Zones 1 & 2
→ Use 15–30 min timeframe to ambush at recent lows or swings.
The best loot lies in waiting – buy limits only!
🛡️Stop Loss – Escape Routes
Set SL like a pro thief:
Pullback 1 ➤ 104.800
Pullback 2 ➤ 105.600
Base it on your crew’s bankroll and lot size. Always prep a clean getaway.
🏁Target – Secure the Goods
Primary loot zone: 106.000
(Or vanish before heat arrives 🚓💨)
⚔️ Scalpers’ Special Ops:
Only operate long side. Big wallets = quick hits. Small stacks? Join the swing squad and trail your SL like a shadow 🕶️🔐.
🔥Why This Hit?
CAD/JPY is in bullish mood driven by:
COT shifts 📈
Sentiment setups 🧠
Macro flow + cross-asset whispers 🔄
🚨 But remember: market conditions flip like fake IDs. Stay alert.
🧠 Final Tips from HQ:
🔕 Avoid new ops during major news drops
💣 Use trailing SLs to lock profits before the sirens go off
💖 Smash that 💥BOOST💥 to fund the next big mission
💼 From the Black Market Desks of the Thief Trading Syndicate™
This ain't your grandpa's trade plan — it's a strategic smash-and-grab with style and smarts. 📡🔐
💬 Drop a comment, hit the like, and recruit more to the crew.
📍See you in the next chart heist. Keep it stealthy, sharp, and profitable. 🤑🚀👊
Canadiandollar

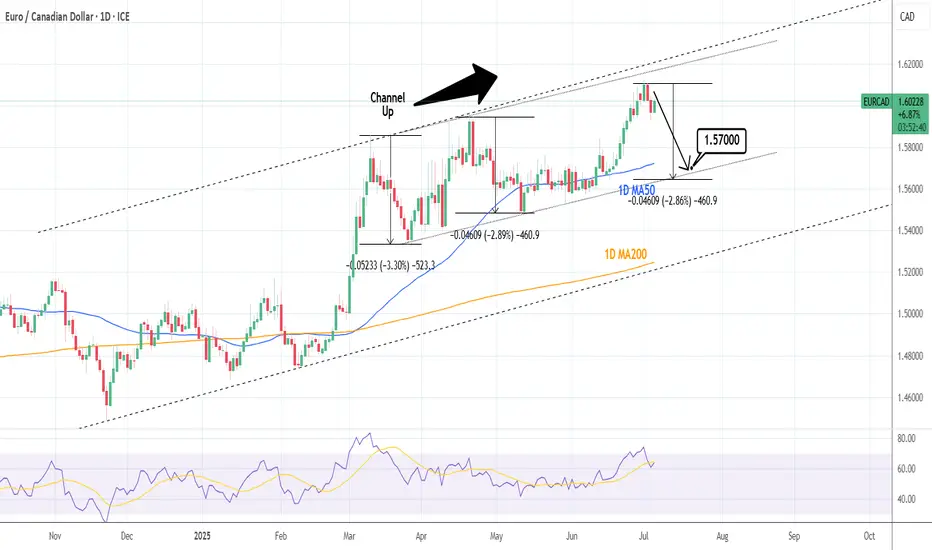
EURCAD: Sell signal on Double Channel Up Top.EURCAD is bullish on its 1D technical outlook (RSI = 63.955, MACD = 0.010, ADX = 41.562) having peaked on two Channel Up patterns at the same time. Technically it should now start the new bearish wave to test the bottom a little below the 1D MA50. Short, TP = 1.57000.
See how our prior idea has worked out:
## If you like our free content follow our profile to get more daily ideas. ##
## Comments and likes are greatly appreciated. ##
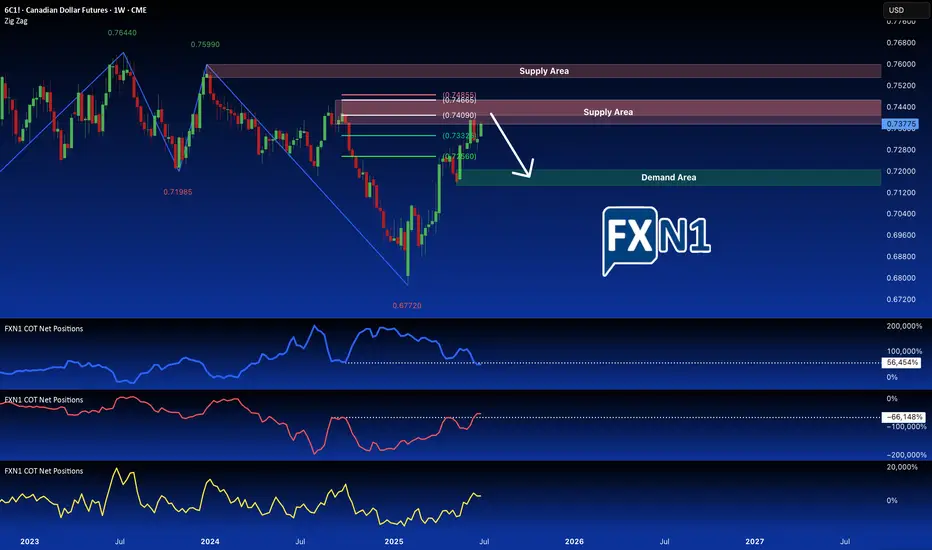
Canadian Dollar Futures (6C1!) Nears Key Monthly SupplyThe Canadian Dollar Futures (6C1!) remain in a downtrend, now testing a critical monthly supply zone after an initial rejection. With Commercials heavily short, Smart Money flat, and Retail traders still bullish, this setup favors another potential downside move. Traders should watch for a retest or breakout spike for optimal short entries.
COT Report: Who’s Betting on the Loonie?
Commercials (Big Players): Increasing short positions, signaling expectations of further downside.
Non-Commercials (Smart Money): Flat, showing hesitation—no strong conviction in either direction.
Retail Traders: Still net long, often a contrarian indicator at key turning points.
This alignment suggests that while momentum may see short-term bounces, the broader trend remains bearish.
✅ Please share your thoughts about 6C1! in the comments section below and HIT LIKE if you appreciate my analysis. Don't forget to FOLLOW ME; you will help us a lot with this small contribution.
USDCAD Strongest long-term Sell in the market right now.At the beginning of the year (January 15, see chart below), we made an unpopular bearish call at the time, hinting that the USDCAD pair was approaching its Resistance Zone, hence a multi-year Top was in order:
As you can see, the moment the price hit that Resistance Zone, it got instantly rejected and a new Bearish Leg started, which has extended up to this day. This time we view this on the 1M time-frame where the Support levels are more clearly illustrated.
More particularly, the 1M MA50 (blue trend-line) poses as the first one, in fact it has been holding since September 2022. Our Target is still located at 1.26000, which is marginally above the 0236 Fibonacci level, which has been the 1st Target during both previous Bearish Legs. Also it is where the 1M MA200 (orange trend-line) is headed to, and there are high chances of a long-term bounce there.
-------------------------------------------------------------------------------
** Please LIKE 👍, FOLLOW ✅, SHARE 🙌 and COMMENT ✍ if you enjoy this idea! Also share your ideas and charts in the comments section below! This is best way to keep it relevant, support us, keep the content here free and allow the idea to reach as many people as possible. **
-------------------------------------------------------------------------------
Disclosure: I am part of Trade Nation's Influencer program and receive a monthly fee for using their TradingView charts in my analysis.
💸💸💸💸💸💸
👇 👇 👇 👇 👇 👇

CAD Option Flow Positive Sentiment. It's worth taking a closer Based on the analysis of yesterday's trading on CME, we have captured an excellent portfolio in the lens.
The trader methodically formed this position in a 5-minute period of time, which is a good sign.
Сonfirmation - the market is already moving in his direction
But, reasonable entry level - above 0.7339.
Don't rush it. The risk/profit ratio is still at acceptable levels, but it's worth waiting for the resistance to be overcome.

NZDCAD - a few technical things togetherFib's retracement level of 50.00% will probably give the trend some strong upward impulse,
After that, this "Bull Flag" will come into play, and the price will go up a little bit higher,
The next step is to enter the price into the current "Most meaningful" channel...
Our take profit is: 0.82550. (Near +24 pips from current price).

NZDCAD - TECH.Hello dear Traders,
Hello TradingView!
Today, in this chart, we will have some technical views about NZDCAD.
ABCD pattern triangle for this time looks like it has lost its weight, and soon the price will start coming down...
The price is still testing the bottom level of the ABCD triangle pattern.
My recommendation on this pair is to wait for a good sell opportunity...
TP1: 0.81669
TP2: 0.81360
Wishing you good luck and a profitable day!

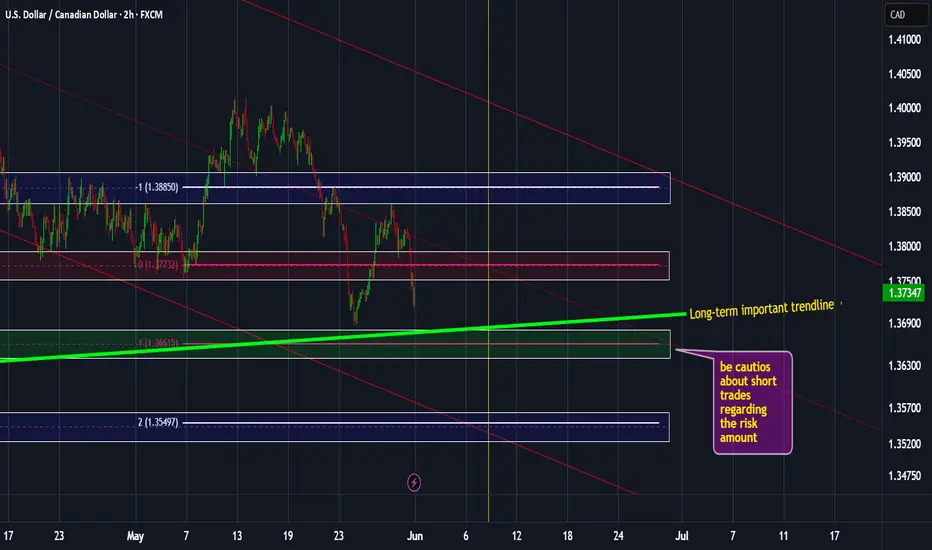
USDCAD weekly analysis: Jun 1, 2025 – Jun 7, 2025Most important news and situations are for this pair.
1st, BOC rate decision week!
2nd, Iran-US negotiations that could make a real difference to oil markets.
3rd, The relatively strong long-term bullish trendline.
*******************************************************************
The indicated levels are determined based on the most reaction points and the assumption of approximately equal distance between the zones.
Some of these points can also be confirmed by the mathematical intervals of Murray.
You can enter with/without confirmation. IF you want to take confirmation you can use LTF analysis, Spike move confirmation, Trend Strength confirmation and ETC.
SL could be placed below the zone or regarding the LTF swings.
TP is the next zone or the nearest moving S&R, which are median and borders of the drawn channels.
*******************************************************************
Role of different zones:
GREEN: Just long trades allowed on them.
RED: Just Short trades allowed on them.
BLUE: both long and short trades allowed on them.
WHITE: No trades allowed on them! just use them as TP points
CADJPY - NEW BREAKOUT !Hello Traders !
The CADJPY price formed a descending channel.
Currently, The resistance line is broken !
So, I expect a bullish move🚀
_______________
TARGET: 105.390🎯

USD/CAD Bulls Could Just be Getting Warmed UpWe finally saw the reversal higher on USD/CAD last week, with a notable bullish engulfing candle strongly suggesting an important swing low. I take a quick look at last week's signal, update the analysis then wrap up on Canadian dollar futures positioning.
Matt Simpson, Market Analyst at City Index and Forex.com

USD/CAD could decrease to C$1.35The US dollar has weakened recently against other major currencies including the euro, pound and yen. While it may not have grabbed the headlines, there’s another currency we can add to that list: the Canadian dollar.
The Canadian dollar – which was trading at around C$1.45 per US dollar at the end of January – may continue to strengthen against its southerly neighbour in the near term, potentially reaching C$1.35 per US dollar. Let’s examine why.
The area between C$1.38 and C$1.39 has previously served as a resistance zone for USD/CAD, marking significant tops in 2022, 2023 and 2024. Each time, this area ended the dollar’s gains and led to a renewed period of Canadian dollar strength. The pattern changed in October 2024, when – after multiple failed attempts to break through resistance – USD/CAD finally pushed to a new high of C$1.45. Now, as USD/CAD declines from that peak, the old resistance area of C$1.38 to C$1.39 is providing support.
If USD/CAD falls below support at C$1.38, it could decline towards C$1.347, partly because there are no meaningful levels of support to slow such a move. A falling bear flag pattern also seems to be forming, suggesting that a breakdown may be imminent, potentially supporting a drop to around C$1.35. Meanwhile, the completion of the diamond reversal top that formed from December 2024 to March 2025 could imply a return to the pattern’s origin near C$1.35.
The USD/CAD chart pattern also shows a high degree of symmetry between the left and right sides. In other words, the decline on the right side is occurring at a similar pace to the earlier rise on the left. Completing this symmetrical pattern might suggest a return to the starting point around C$1.35.
Of course, if support at C$1.38 holds and the Canadian dollar does not strengthen further, a swift rise for the US dollar back towards C$1.41 cannot be ruled out.
Written by Michael J. Kramer, founder of Mott Capital Management
Disclaimer: CMC Markets is an execution-only service provider. The material (whether or not it states any opinions) is for general information purposes only and does not take into account your personal circumstances or objectives. Nothing in this material is (or should be considered to be) financial, investment or other advice on which reliance should be placed.
No opinion given in the material constitutes a recommendation by CMC Markets or the author that any particular investment, security, transaction, or investment strategy is suitable for any specific person. The material has not been prepared in accordance with legal requirements designed to promote the independence of investment research. Although we are not specifically prevented from dealing before providing this material, we do not seek to take advantage of the material prior to its dissemination.

The Canadian Dollar Index CXY on 1WEEK timeframe with cycles. Just a coincidence, I'm sure... But Canada's current Prime Minister just resigned exactly at the end of the 3rd cycle on a 9 year major support level. Is the Canadian dollar about to reverse? Pay attention to Canadian news over the next 6 months to support this idea.

NZDCAD - Bearish Triple TOPHello Traders !
On Monday 21 April, The NZDCAD reached the resistance level (0.83146 - 0.82973).
The price formed a triple top pattern.
Currently, The neckline is broken !
So, I expect a bearish move📉
______________
TARGET: 0.80610🎯

GBPCAD - BULLISH MOVEHello Traders !
The GBPCAD broke the resistance level (1.83706 - 1.84150).
This key level becomes new support!
So, I expect a bullish move🚀
Let's wait for a retest...
____________
TARGET: 1.85720🎯

CADJPY is perhaps the best sell signal long-term.The CADJPY pair has broken marginally below its 1W MA200 (orange trend-line) in recent weeks and turned sideways. This took place on the latest 1W MA50 (blue trend-line) rejection on January 13 2025. As long as the market remains below it, the long-term trend-line will be bearish.
The current 1W MA200 consolidation is in fact similar to what followed after the last major long-term rejection in December 2014. As you can see on the chart, we are on similar trading patterns as August - September 2015. Even the 1W RSI sequences among the two fractals are identical, starting off strong Bearish Divergencies that basically were an early signal for the 2015 - 2016 sell-off and possibly now the 2025 - 2026 sell-off.
As a result, we are bearish on this pair, expecting a 85.000 Target on high probabilities and a 2nd at 75.000 on lower, which is the 14-year Support Zone.
-------------------------------------------------------------------------------
** Please LIKE 👍, FOLLOW ✅, SHARE 🙌 and COMMENT ✍ if you enjoy this idea! Also share your ideas and charts in the comments section below! This is best way to keep it relevant, support us, keep the content here free and allow the idea to reach as many people as possible. **
-------------------------------------------------------------------------------
Disclosure: I am part of Trade Nation's Influencer program and receive a monthly fee for using their TradingView charts in my analysis.
💸💸💸💸💸💸
👇 👇 👇 👇 👇 👇

USDCAD Selling not over yet.Last time we looked at the USDCAD pair (March 21, see chart below), we got the most optimal sell entry that easily hit our 1.4000 Target:
As the price broke below its 1D MA200 (orange trend-line) having made a significant correction since the February 03 High, we believe there is more selling to be made at least on the short-term.
That is because the Higher Lows Zone that started on the May 2021 market bottom, hasn't yet been tested and since December 2023, the market always broke inside it before rebounding.
As a result, we expect a new rejection on the 1D MA200, delivering a 1.38200 Target.
-------------------------------------------------------------------------------
** Please LIKE 👍, FOLLOW ✅, SHARE 🙌 and COMMENT ✍ if you enjoy this idea! Also share your ideas and charts in the comments section below! This is best way to keep it relevant, support us, keep the content here free and allow the idea to reach as many people as possible. **
-------------------------------------------------------------------------------
Disclosure: I am part of Trade Nation's Influencer program and receive a monthly fee for using their TradingView charts in my analysis.
💸💸💸💸💸💸
👇 👇 👇 👇 👇 👇

After a huge move, USD/CAD may be due to reboundUSD/CAD has strengthened significantly over the past few days as markets have been shaken by President Trump’s new trade war with Canada and the rest of the world. That said, USD/CAD may be due for a pause in its recent rally and could consolidate somewhat, having reached some key technical indicators and support levels.
The loonie’s relative strength index fell to 29, while USD/CAD dropped below the lower Bollinger Band at CA$1.387. This magnitude of movement suggests that USD/CAD is currently oversold and may be due for either a short-term rebound or a period of sideways consolidation. The pair could also bounce back towards resistance at CA$1.416 or the 20-day moving average at CA$1.421.
However, if USD/CAD breaks support at CA$1.3870, it could signal that further strengthening lies ahead, with the potential to drop towards CA$1.359, which served as an important area of support and resistance between December 2023 and October 2024.
USD/CAD could continue strengthening against the dollar; the greenback has weakened versus multiple currencies, and any pause in the dollar’s current downtrend may be short-lived, due to possible massive deleveraging out of the US and capital flow back to their nations of origin. Still, after such a significant move, USD/CAD seems potentially due for at least a short-term period of consolidation before the uptrend resumes.
Written by Michael J Kramer, founder of Mott Capital Management
Disclaimer: CMC Markets is an execution-only service provider. The material (whether or not it states any opinions) is for general information purposes only and does not take into account your personal circumstances or objectives. Nothing in this material is (or should considered to be) financial, investment or other advice on which reliance should be placed.
No opinion given in the material constitutes a recommendation by CMC Markets or the author that any particular investment, security, transaction, or investment strategy is suitable for any specific person. The material has not been prepared in accordance with legal requirements designed to promote the independence of investment research. Although we are not specifically prevented from dealing before providing this material, we do not seek to take advantage of the material prior to its dissemination.

AUDCAD Excellent Channel Down bottom opportunity.The AUDCAD pair has been trading within a long-term Channel Down since the January 26 2023 High and the recent Trade War fueled sell-off took the price almost on its bottom (Lower Lows trend-line).
The 1D RSI got vastly oversold at 14.00 and a bottom is to be expected within the next 2 weeks. Still, this level is low enough to be considered a solid long-term buy opportunity already. The previous bottom rebound targeted initially the 0.5 Fibonacci retracement level, so our target is 0.88850 on the medium-term.
-------------------------------------------------------------------------------
** Please LIKE 👍, FOLLOW ✅, SHARE 🙌 and COMMENT ✍ if you enjoy this idea! Also share your ideas and charts in the comments section below! This is best way to keep it relevant, support us, keep the content here free and allow the idea to reach as many people as possible. **
-------------------------------------------------------------------------------
Disclosure: I am part of Trade Nation's Influencer program and receive a monthly fee for using their TradingView charts in my analysis.
💸💸💸💸💸💸
👇 👇 👇 👇 👇 👇

EURCAD Buy signal on 2023 fractal.It's been too long since we last looked on the EURCAD pair (November 29 2024, see chart below) but it delivered nonetheless our 1.500 Target:
Thit time the price is consolidating after a strong February rally and posts a similar pattern to October 2022 - January 2023. The 1D RSI sequences between those fractals are identical and it is not technically unreasonable to expect again the bullish trend to be resumed and target the 1.382 Fibonacci extension at 1.62500.
-------------------------------------------------------------------------------
** Please LIKE 👍, FOLLOW ✅, SHARE 🙌 and COMMENT ✍ if you enjoy this idea! Also share your ideas and charts in the comments section below! This is best way to keep it relevant, support us, keep the content here free and allow the idea to reach as many people as possible. **
-------------------------------------------------------------------------------
💸💸💸💸💸💸
👇 👇 👇 👇 👇 👇

Market Analysis: USD/CAD DipsMarket Analysis: USD/CAD Dips
USD/CAD declined and now consolidates below the 1.4350 level.
Important Takeaways for USD/CAD Analysis Today
- USD/CAD started a fresh decline after it failed to clear the 1.4415 resistance.
- There was a break below a major bullish trend line
USD/CAD Technical Analysis
On the hourly chart of USD/CAD at FXOpen, the pair climbed toward the 1.4420 resistance zone before the bears appeared. The US Dollar formed a swing high near 1.4415 and recently declined below the 1.4350 support against the Canadian Dollar.
There was also a close below the 50-hour simple moving average and 1.4310. There was a break below a major bullish trend line with support at 1.4310.
The bulls are now active near the 1.4300 level. The pair is now consolidating losses below the 23.6% Fib retracement level of the downward move from the 1.4415 swing high to the 1.4288 low. If there is a fresh increase, the pair could face resistance near the 1.4330 level.
The next key resistance on the USD/CAD chart is near the 1.4350 level and the 50% Fib retracement level of the downward move from the 1.4415 swing high to the 1.4288 low.
If there is an upside break above 1.4350, the pair could rise toward the 1.4400 resistance. The next major resistance is near the 1.4415 zone, above which it could rise steadily toward the 1.4450 resistance zone.
Immediate support is near the 1.4290 level. The first major support is near 1.4260. A close below the 1.4260 level might trigger a strong decline. In the stated case, USD/CAD might test 1.4240. Any more losses may possibly open the doors for a drop toward the 1.4400 support.
This article represents the opinion of the Companies operating under the FXOpen brand only. It is not to be construed as an offer, solicitation, or recommendation with respect to products and services provided by the Companies operating under the FXOpen brand, nor is it to be considered financial advice.

USDCAD Channel Down aiming for the 1D MA200.The USDCAD pair has been trading within a Channel Down and is currently around the 1D MA50 (blue trend-line) following its latest Lower High formation.
If the current Bearish Leg is as strong as the previous one, we can expect the price to hit at least the 1D MA200 (orange trend-line) at 1.4000.
-------------------------------------------------------------------------------
** Please LIKE 👍, FOLLOW ✅, SHARE 🙌 and COMMENT ✍ if you enjoy this idea! Also share your ideas and charts in the comments section below! This is best way to keep it relevant, support us, keep the content here free and allow the idea to reach as many people as possible. **
-------------------------------------------------------------------------------
💸💸💸💸💸💸
👇 👇 👇 👇 👇 👇

USDCAD SHORTLongterm oportunity to short USDCAD. We are in bigger consolidation that we can see on Monthly chart. On weekly we touch upper area of consolidation and now we brake UP trend and currently we are in retracement.
Try to look for enteries for short.
SL: above highest point
TP: above lower band of consolidation (dont be too greedy)

GBPCAD - NEW BREAKOUT !Hello Traders !
On the weekly time frame, The GBPCAD price broke the resistance (1.84164 - 1.82638).
This key level becomes new support !
So, I predict a bullish move🚀
_____________
TARGET: 1.89450🎯
