Anyone get some WTI longs?TVC:USOIL
Nice looking longs for the oil traders here.....
Does that mean my gas going up for my car?
Canadiandollar

CADJPY: The 1D MA50 is crucialCSDJPY is on the rising Channel of its medium term Channel Up, rebounding on the 1D MA50. The 1D technicals are neutral (RSI = 53.031, MACD = 0.270, ADX = 28.072) and that always favors technically the dominant trend. So as long as the price is inside the rising Channel, our target will be the 1D MA200 (TP = 101.350). If a candle closes under the rising Channel and ideally the 1D MA50 as well, we will sell targeting the bottom of the Channel Up (TP = 96.000).
The 1D RSI is on a HL trendline. Technically a low risk buy will be on that line.
## If you like our free content follow our profile to get more daily ideas. ##
## Comments and likes are greatly appreciated. ##

AUDCAD: Sell at the top of the Channel Down.The AUDCAD pair is on the 1D MA50 for the third successive day, which is also the top of the Channel Down pattern. The 1D technicals have turned neutral (RSI = 52.833, MACD = -0.001, ADX = 23.757), indicating that this is technically a firm sell entry.
We will use this opportunity to short and target the S3 (TP = 0.88650) as all the Higher Lows of the uptrend have been filled by this Channel Down. On the contrary, if the price crosses over the R1, we will go long and target the R2 (TP = 0.92400).
Prior idea:
## If you like our free content follow our profile to get more daily ideas. ##
## Comments and likes are greatly appreciated. ##

AUDCAD is growing again with the Double Bottom Pattern🚀By forming the Double Bottom pattern , we can confirm the end of wave C.
I expect AUDCAD to grow to at least the resistance line after breaking the neckline of the Double Bottom pattern. (I have specified AUDCAD growth 🎯 targets 🎯 in the chart for you).
💡Also, I shared with you the position with RR= 2.68 , but be sure to follow your strategy and not forget capital management.💡
🔅Australian Dollar/Canadian Dollar Analyze ( AUDCAD ), Daily time frame ⏰.
Do not forget to put Stop loss for your positions (For every position you want to open).
Please follow your strategy, this is just my idea, and I will gladly see your ideas in this post.
Please do not forget the ✅' like '✅ button 🙏😊 & Share it with your friends; thanks, and Trade safe.

EURCAD: Last buy round then sell to the 4H MA200.EURCAD is on a very consistent bullish pattern since February giving low risk buy signals on the HL trendline and sell signals on the HH trendline. This is well illustrated by the bullish technicals on the 1D time-frame (RSI = 63.779, MACD = 0.009, ADX = 34.173). The price is currently on the final bullish wave to the HH trendline, and we will stay long with TP = 1.51550. That is the 1.618 Fibonacci extension, which marked the previous Higher High (HH). Then we will sell targeting the 4H MA200 (TP = 1.4900).
Prior idea:
## If you like our free content follow our profile to get more daily ideas. ##
## Comments and likes are greatly appreciated. ##

WTI = watch your Canadian marketsTVC:USOIL
Interesting, tanking on the prices.
Canadian pairs on a little holding pattern for the Feds

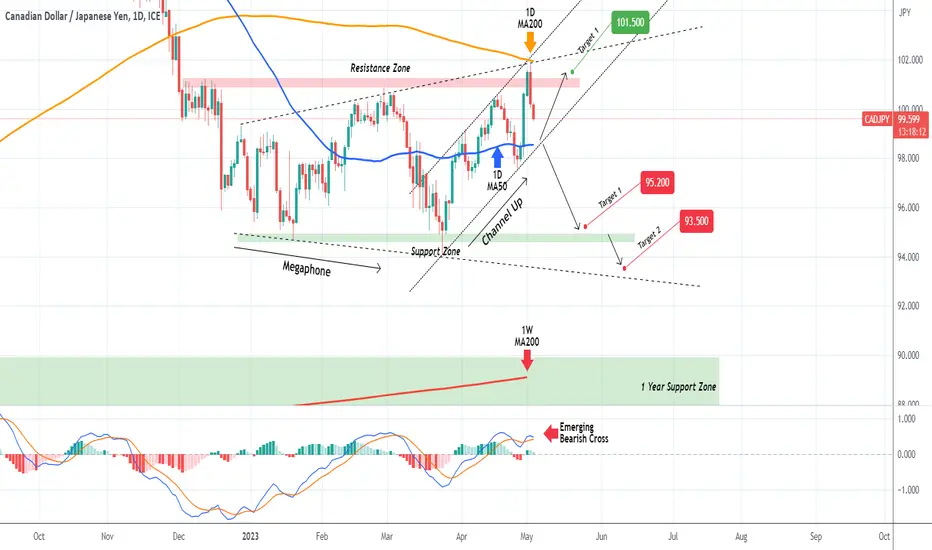
CADJPY Rejected on the 1D MA200. Is this a trend change?The CADJPY pair got a rejected yesterday near the 1D MA200 (orange trend-line), which hasn't been touched since November 30 2022. Since the March 24 Low the price has been trading within a Channel Up but the long term pattern is a Megaphone and yesterday's rejection took place on its top (Higher Highs trend-line).
With the 1D MACD about to make a Bearish Cross, this is a Triple Sell signal on the long-term. As long however as the 1D MA50 (blue trend-line) and the Channel Up hold, we can buy and target short-term the 1D MA200 at 101.500. If however we close a 1D candle below the Channel Down, the Sell Signal will be confirmed and we will target 95.200 (above the Support Zone) and 93.500 (Megaphone's bottom) in succession.
P.S. It's been almost 4 months since we called for a bullish divergence on CADJPY:
-------------------------------------------------------------------------------
** Please LIKE 👍, FOLLOW ✅, SHARE 🙌 and COMMENT ✍ if you enjoy this idea! Also share your ideas and charts in the comments section below! **
-------------------------------------------------------------------------------
💸💸💸💸💸💸
👇 👇 👇 👇 👇 👇
CADCHF - BEARISH RISING WEDGE 📉Hey Traders👋🏻
The CADCHF Price Reached a Strong Resistance Line ✔
Currently, CADCHF formed a Rising Wedge ✔
The Price Failed To Create New Higher High 📈
The Support Line of the wedge is Broken 🔥
If Price Stays Under The Key Zone, CADCHF Can Continue The Bearish Move 📉
-----
TARGET: 0.65354🎯
___________
if you agreed with this IDEA, please leave a LIKE, SUBSCRIBE or COMMENT!

USD/CAD -3/5/2023-• Renewed US Dollar strength coupled with falling Oil prices due to fear of recession, are the main fundamentals behind the rally of USD/CAD
• Technical picture remains bullish as long as above the slightly ascending trend line and horizontal support at 1.3530
• Long term symmetrical triangle is shrinking which means the breakout is coming soon and the projected target is a huge move ( height of the triangle is almost 2000 pips )
• Short term trading recommendation:
Risk/reward favors a long position at current 1.36 level with stop at 1.35 and target 1.38 (descending trend line resistance)
• No fresh trades are recommended before closely watching the outcome of the FED meeting on Wednesday
Traders, if you like this idea please comment and like ✅
Here to answer all your questions,
Good luck

USDCAD Sell this Fibonacci testUSDCAD is trading inside a Triangle with the price rising after it last hit the pattern's bottom (Rising Support).
It has failed to close over Fibonacci 0.618 on six straight days.
This failure is a technical sign of trend weakness, very much alike the struggle on Fibonacci 0.618 last December.
Sell and target the Rising Support again at 1.33550.
Previous chart:
Follow us, like the idea and leave a comment below!!

USDCAD - RESISTANCE BECOMES SUPPORT 📈Hello Traders 💖
On The Daily Time Frame The USDCAD Price Reached A Resistance Level 1.35123-1.35538 !
Currently, The Price Broke The Key Level (Resistance Level Becomes New Support Level)
If Price Stays Above The Key Zone, USDCAD Can Continue The Bullish Move 📈
-----------
TARGET 1: 1.36767🎯
TARGET 2: 1.38000🎯
___________
if you agreed with this IDEA, please leave a LIKE, SUBSCRIBE or COMMENT!

AUDCAD Testing the top of the Channel Down. Sell.The AUDCAD pair hit today the 1D MA50 (blue trend-line) for the first time in more than two months (since February 22). By doing so, it has approached both the Channel's top (Lower Highs trend-line) and Resistance 1 (0.912750) of the April 03 High.
With the 1W RSI still far from its Support/ Buy Zone, we treat today's rise as a sell opportunity and short towards the Channel's bottom (Lower Lows trend-line), targeting 0.8870 (November 21 2022 Low).
-------------------------------------------------------------------------------
** Please LIKE 👍, FOLLOW ✅, SHARE 🙌 and COMMENT ✍ if you enjoy this idea! Also share your ideas and charts in the comments section below! **
-------------------------------------------------------------------------------
💸💸💸💸💸💸
👇 👇 👇 👇 👇 👇

EURCAD Halfway to its long-term buy zone.The EURCAD pair hit the first target we set on our late-March analysis:
The pattern that emerges is a Channel Up and the next high probability buy entry is located exactly at its bottom on the 1D MA50 (blue trend-line). If the price breaks below the Channel Up, we may see a prolonged accumulation on the 0.618 Fibonacci level. As you see the Fibonacci levels have been targeted since the rise started last August and filled the gaps on all Lower Highs during the Bear market. The next gap to be filled is none other than the December 22 2021 High. Our long-term target in both scenarios is 1.57000.
-------------------------------------------------------------------------------
** Please LIKE 👍, FOLLOW ✅, SHARE 🙌 and COMMENT ✍ if you enjoy this idea! Also share your ideas and charts in the comments section below! **
-------------------------------------------------------------------------------
💸💸💸💸💸💸
👇 👇 👇 👇 👇 👇

AUDCAD - New Bearish Move 📉Hello Traders 💖
On The Daily Time Frame The AUDCAD Price Reached A Resistance Level 0.91064-0.90806 !
Currently, The Price Failed to Create new Higher High 📈
If Price Stays Under The Key Zone, AUDCAD Can Continue The Bearish Move 📉
-----------
TARGET: 0.89800🎯
___________
if you agreed with this IDEA, please leave a LIKE, SUBSCRIBE or COMMENT!

USDCAD: Time to Go Lower 🇺🇸🇨🇦
As I predicted, USDCAD dropped yesterday.
It turned out that the price managed to form a bearish engulfing candle on a daily time frame,
a support line of a rising parallel channel was broken on a 4h time frame then.
I believe that the pair may go lower.
Goals: 1.357 / 1.3533
❤️Please, support my work with like, thank you!❤️

USDCAD Next MovePair : USDCAD ( U.S Dollar / Canadian Dollar )
Description :
Bullish Channel in Long Time Frame as an Corrective Pattern and Rejection from the Lower Trend Line
Divergence
Break of Structure
Completed " 12345 " Impulsive Wave and " A " Corrective Wave
Rejecting from Fibonacci Level - 61.80%

GBPCAD - NEW BREAKOUT 📈Hello Traders 💖
On The Daily Time Frame The GBPCAD Broke The Major Key Level (Support Becomes Resistance Level)
and he Broke The Resistance Line ✔
Currently, The Price is testing 1.68195-1.68603 Support Level for Creating a new Higher Low 📈
If Price Stays Above The Key Zone, GBPCAD Can Continue The Bullish Move 📈
-----------
TARGET 1: 1.69930🎯
TARGET 2: 1.71650🎯
___________
if you agreed with this IDEA, please leave a LIKE, SUBSCRIBE or COMMENT!

GBPCAD: Cup & Handle Pattern 🇬🇧🇨🇦
Analyzing a price action on GBPCAD on a daily time frame,
I spotted a perfect example of a Cup & Handle pattern.
The price has already broken and closed above a neckline, confirming the strength of bulls.
I expect a bullish continuation to 1.707 / 1.724
For entries, consider the occasional retest of a broken neckline.
❤️Please, support my work with like, thank you!❤️

Different Look, same story, just eating chipsOANDA:USDCAD
Holding pattern ahead of earnings week.
Nothing today during London/NY sessions.
Just eating chips and getting fat while sitting on hands with this pair.

USDCAD: Your Trading Plan 🇺🇸🇨🇦
USDCAD is trading in a bearish trend on a daily.
The price is currently testing a key horizontal resistance.
Approaching that, the price formed a head & shoulders pattern on 1H time frame.
1.3522 - 1.353 is its neckline. To short with a confirmation, wait for its bearish breakout (1H candle close below that).
Sell aggressively or on a retest then.
Goals will be 1.3493 / 1.3456
❤️Please, support my work with like, thank you!❤️

EURCADAccording to the reaction to the very important range of the beginning of the downward correction, it is possible to enter a sell position with the ceiling loss limit and the specified target.
Stay with me to get more analysis after following me by sharing with friends and leaving a comment.
According to my risk and capital management system, the risk of each trade is one percent per position.
What do you think about this analysis and other analyses?
What symbol would you like me to analyze for you?

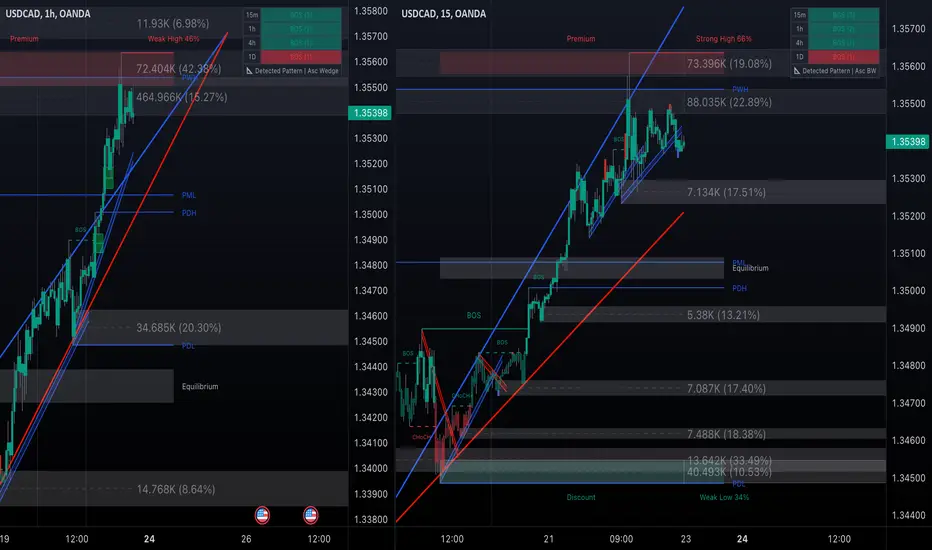
USD/CAD - On the READYOANDA:USDCAD
1H price action hitting resistance order blocks above, and top range (premium) of the most recent swing structure.
Price unable to break above, and looking for possible short scalps on the 15m when structure breaks to the downside.
USDCAD: Your Trading Plan For Next Week 🇺🇸🇨🇦
USDCAD is approaching a key daily structure resistance.
Taking into consideration the fact, that the pair is trading in a bearish trend,
we may say a bearish reaction from the underlined area.
To confirm that, watch a rising trend line on 1H time frame.
If the price breaks and closes below that, it will confirm the strength of the underlined structure.
A bearish continuation will be expected then at least to 1.3519.
Alternatively, a bullish breakout of the underlined structure will push the price higher.
❤️Please, support my work with like, thank you!❤️
