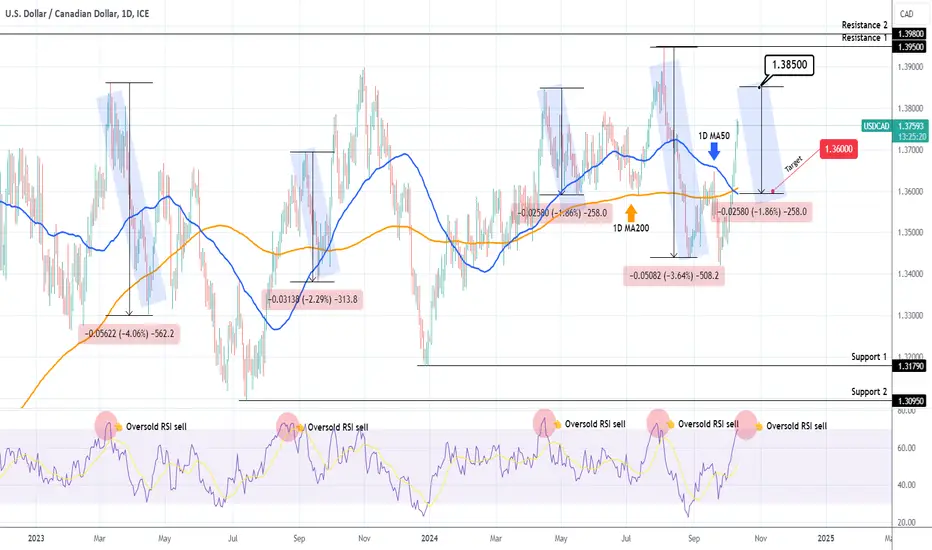
USDCAD Approaching our sell entry.The USDCAD pair has been rising since the September 25 Low, all inside a 2-year Rectangle pattern of a wide range. The 1D RSI is about to enter the 70.00 overbought zone and every time it has done so within this pattern, a little later it got rejected to at least the 1D MA50 (blue trend-line).
As a result, we will wait until 1.38500 and sell, targeting 1.36000 (which would be a -1.86% decline from the top, the minimum from the group of similar declines) or take the profit if the price hits the 1D MA50 before 1.36000.
-------------------------------------------------------------------------------
** Please LIKE 👍, FOLLOW ✅, SHARE 🙌 and COMMENT ✍ if you enjoy this idea! Also share your ideas and charts in the comments section below! This is best way to keep it relevant, support us, keep the content here free and allow the idea to reach as many people as possible. **
-------------------------------------------------------------------------------
💸💸💸💸💸💸
👇 👇 👇 👇 👇 👇
Canadiandollar
USDCAD Extends Rally as Strong US Labor Data Lifts the GreenbackThe USD/CAD pair continues its upward momentum, extending its rally to around 1.3645 during Tuesday's early London session. The recent surge in the US Dollar (USD) has been driven by stronger-than-expected labor market data released last Friday, which caused traders to reassess their expectations of aggressive Federal Reserve (Fed) interest rate cuts.
The Nonfarm Payrolls (NFP) report showed a robust increase in employment figures, along with a decline in the Unemployment Rate, which has reduced the likelihood of more substantial rate cuts by the Fed. Investors now anticipate a more modest 25 basis points (bps) cut in the upcoming November meeting, rather than the previously expected 50 bps. This sentiment shift has provided a solid foundation for the USD to gain traction against its counterparts, including the Canadian Dollar (CAD).
In our previous USD/CAD forecast, shared here:
USD/CAD Rebounds from Demand Zone
Bullish Continuation in Sight, we highlighted a key demand zone where the pair found strong support. As anticipated, the price rebounded exactly from our identified area, and we are now approaching our take profit target.
Looking Ahead: Impact of Upcoming US Economic Data
Tomorrow and the day after, significant US economic data releases are scheduled, including reports on inflation and unemployment claims, which could further impact the direction of the USD. A continuation of strong economic performance may push the USD/CAD pair higher, while any signs of economic weakness could lead to a brief retracement.
Conclusion: Holding the Position for Further Gains
Given the favorable technical setup and the strong support from recent labor data, we are holding our long position in USD/CAD. The upcoming economic releases will provide additional clarity, but for now, the momentum remains on the side of the US Dollar. A potential continuation of the bullish trend is in sight, with some volatility expected as traders react to fresh economic news.
✅ Please share your thoughts about USD/CAD in the comments section below and HIT LIKE if you appreciate my analysis. Don't forget to FOLLOW ME; you will help us a lot with this small contribution.

USDCAD: Sell signalUSDCAD is almost neutral on its 1D technical outlook (RSI = 44.464, MACD = -0.002, ADX = 19.851) as it rebounded on August's low. This is a similar price action to the April-May 2023 sequence and as long as the 1D MA50 contains the price under it, we will be bearish. Our Target is just over the S1 Zone (TP = 1.32500).
## If you like our free content follow our profile to get more daily ideas. ##
## Comments and likes are greatly appreciated. ##

USDCAD Prepare for red October - November.The USDCAD pair hit both of our Targets on the July 25 (see chart below) sell signal:
The initial rebound stopped on the 1D MA50 (blue trend-line) where the price was rejected with the 1D RSI forming a pattern similar to May 2023. As a result, it is possible to see another short-term rebound but on the medium-term, we expect October and November to be another sell sequence.
The March - July 2023 fractal had two similar Bearish Legs of -4.10% each. So since the current first Leg was -3.64%, we expect the one that will follow now to be of around the same strength.
As a result we can target 1.32000 on low risk, just above the Support 1 level.
-------------------------------------------------------------------------------
** Please LIKE 👍, FOLLOW ✅, SHARE 🙌 and COMMENT ✍ if you enjoy this idea! Also share your ideas and charts in the comments section below! This is best way to keep it relevant, support us, keep the content here free and allow the idea to reach as many people as possible. **
-------------------------------------------------------------------------------
💸💸💸💸💸💸
👇 👇 👇 👇 👇 👇

CADJPY Strong buy at the bottom of the 2-year Channel UpLast time we gave a signal on the CADJPY pair (July 09, see chart below), we got the sell we wanted, as a brutal collapse started straight after:
This time we get a strong buy signal as the price is rebounding after a Double Bottom on the Higher Lows trend-line of the 2-year Channel Up. This is similar to the January - March Double Bottom, which until now, has been the strongest long-term buy signal on the pair.
Once the price breaks above the 1D MA50 (blue trend-line), we will have the buy confirmation we need to target the 0.9 Fibonacci level (like June 23 2023) at 117.100.
-------------------------------------------------------------------------------
** Please LIKE 👍, FOLLOW ✅, SHARE 🙌 and COMMENT ✍ if you enjoy this idea! Also share your ideas and charts in the comments section below! This is best way to keep it relevant, support us, keep the content here free and allow the idea to reach as many people as possible. **
-------------------------------------------------------------------------------
💸💸💸💸💸💸
👇 👇 👇 👇 👇 👇

AUDCAD Excellent buy signal on the 1D MA200The AUDCAD pair gave us an excellent sell signal last time (July 08 2024, see chart below) and easily hit the 0.9000 Target:
This time, we have an established Channel Up with two Higher Highs and three Higher Lows priced in already. We are currently on the new Bullish Leg following the rebound on the 1W MA200 (orange trend-line).
As long as this holds, we will treat every touch on the 0.786 as a buy opportunity, similar to the Triple Bottom of March - April. That Bullish Leg marginally surpassed the -0.5 Fibonacci extension to print its Higher High, so our Target will be just below it at 0.94000.
-------------------------------------------------------------------------------
** Please LIKE 👍, FOLLOW ✅, SHARE 🙌 and COMMENT ✍ if you enjoy this idea! Also share your ideas and charts in the comments section below! This is best way to keep it relevant, support us, keep the content here free and allow the idea to reach as many people as possible. **
-------------------------------------------------------------------------------
💸💸💸💸💸💸
👇 👇 👇 👇 👇 👇

SELL CADJPYAs you can notice on the chart we have our BB which the market respected as usual, and now it's heading towards our target.
You still can sell and set your TP as shown on he chart.
Follow for more!

EURCAD Sell continuation signalThe EURCAD pair is trading on the 1D MA50 (blue trend-line) within the 10-month Channel Up. The previous time we had a peak rejection like this, the pair declined by at least -3.88%. The similarities even between the 1D RSI fractals are obvious. Our Target is 1.46550.
-------------------------------------------------------------------------------
** Please LIKE 👍, FOLLOW ✅, SHARE 🙌 and COMMENT ✍ if you enjoy this idea! Also share your ideas and charts in the comments section below! This is best way to keep it relevant, support us, keep the content here free and allow the idea to reach as many people as possible. **
-------------------------------------------------------------------------------
💸💸💸💸💸💸
👇 👇 👇 👇 👇 👇

AUDCAD - NEW BREAKOUT !On Monday 19 August, The AUDCAD reached the resistance level (0.91896 - 0.91737).
The price broke a strong support level (0.91145 - 0.91290).
This key level becomes a new resistance level !
So, I expect a bearish move📉
_____________
TARGET: 0.90300🎯

High Timeframe Analysis for Canadian DollarDISCLAIMER: This is not trading advice. This is for educational and entertainment purposes only. There are significant risks involved with trading. Do your due diligence.
MULTI-TIMEFRAME STRATEGY.
This approach is great for traders that don't have a lot of time to spend at the charts. This strategy can easily be managed with a few minutes a night. If you have kids, or are busy with another profession, this strategy is excellent.
HTF: 12 Month
ITF: 2 Week
ETF: 12 Hour
CANADIAN DOLLAR ANALYSIS:
I am looking for the Canadian Dollar to trade up to 2023 highs. My bias is due to the "swing low" we put in over the last few years, suggesting that overall there is some bullish momentum.
The intermediate timeframe is in flow with my htf objective. I want to see CAD trade down into the 2W fair value gap &/or 2 week orderblock, and then give an entry (cisd, 18 period ma entry, 10-8 mac entry). The target is 2023 highs. These trades can last a fairly long time due to the high timeframe objective. I will either roll over into next contract, or utilize spot forex market for these positions. To be clear, this does not mean I blindly long. What this means is this market has a setup, which means we wait for the trigger/timing tool to get me in. Until then, I do nothing.
If you want to learn more about the PD (Premium/Discount) arrays, I suggest you study ICT (Inner Circle Trader). My application of his work is unique, but to learn the fundamentals, there is no better place than his YouTube.
If you have questions, feel free to shoot me a message.
Have a great week.

CADCHF - BEARISH MOVEHi Traders !
After a huge bearish move,
The CADCHF price broke the support level (0.63597 - 0.63038).
This key level becomes a new resistance level !
So, I predict a bearish move📉
______________
TARGET: 0.61680🎯

Smart Money Positioned to SHORT CAD - COT StrategyDISCLAIMER: This is not trade advice. This is for educational purposes only to demonstrate how I am looking to participate in this market. There is significant risk involved in trading, do your own homework and due diligence.
COT Strategy
SHORT
Canadian Dollar (6C)
My COT strategy has me on alert for short trades in 6C if we get a confirmed bearish change of trend on the Daily timeframe.
COT Commercial Index: Sell Signal
OI Analysis: Upmove in price has seen Commercials aggressively move to the short side - bearish.
Valuation: Overvalued vs Treasuries
True Seasonal: Strong seasonal tendency to go down to October.
COT Small Spec Index: Sell Signal
Supplementary Indicators: %R
Remember, this is not a "Short Now" idea. These indicators are not timing tools. They simply tell us that this market could have a move of some significance to the downside, which we will participate in with a confirmed Daily trend change to the downside.
Good luck & good trading.

USDCAD - Losing Steam - Shorting the Mid RetestI’ve been tracking this one for a while, and I believe it’s time to short this area after the significant bearish signal right at the top, which resulted in a failed breakout.
After several months of accumulation and various breakout attempts that ultimately fell back into the range, it has now dropped below the mid-level. For me, this is a clear short signal.
If it reclaims the mid-level solidly before my invalidation point, I’ll consider closing my position manually. For now, I’m targeting the range low.

AUDCAD: Time to Drop Lower 🇦🇺🇨🇦
AUDCAD was consolidating within a horizontal range for 2 weeks.
The release of high impact fundamental news earlier this week
made the pair bearish.
The price managed to break and close below a support of the range on a daily.
We can expect a bearish movement now.
Next support - 90.5
❤️Please, support my work with like, thank you!❤️

Volatile Week for USD/CAD? Volatile Week for USD/CAD?
The Bank of Canada (BoC) is anticipated to lower rates by 25 basis points on Wednesday, bringing the policy rate down to 4.25%. This expectation follows a recent CPI report that indicated further easing in core inflation, coupled with weaker labor market data.
While a 50-basis point cut seems unlikely, it can't be entirely dismissed. In the July monetary policy meeting, Governor Tiff Macklem suggested that the focus may shift towards supporting economic growth rather than solely controlling inflation.
Additionally, Canada's August employment report is set to be released on Friday, coinciding with the US nonfarm payrolls report. This timing could heighten uncertainty and volatility in the USD/CAD pair.
A key level to watch will be the 1.3570-1.3600 zone, which previously served as a significant support area. Whether this area will be re-tested remains to be seen.

USDCAD Buy opportunity on extremely oversold RSIThe USDCAD pair hit both of our targets on the sell signal we gave a month ago (July 25, see chart below) as it is currently on a 4-week red candle streak:
We now start switching to a bullish medium-term strategy as we get clear signals of a pending trend reversal. The price isn't only on the 0.618 Fibonacci retracement level from Support 2 but the 1D RSI also hit the oversold bottom level of the December 26 2023 Low.
As you can see on this chart, every time the 1D RSI broke below the 30.00 oversold barrier in the past 12 months and reversed even a little, the USDCAD pair bottomed on the medium-term and targeted Resistance 1. Even the smaller April 14 2023 reversal (which wasn't from an oversold RSI) targeted the 0.618 retracement level.
As a result, we apply a two tier buy entry, one now and the 2nd at the less likely event the price approaches Support 1 (-5.40% decline, the most it had on a 2-year basis). In both cases, our Target is 1.37500 (0.618 Fib).
-------------------------------------------------------------------------------
** Please LIKE 👍, FOLLOW ✅, SHARE 🙌 and COMMENT ✍ if you enjoy this idea! Also share your ideas and charts in the comments section below! This is best way to keep it relevant, support us, keep the content here free and allow the idea to reach as many people as possible. **
-------------------------------------------------------------------------------
💸💸💸💸💸💸
👇 👇 👇 👇 👇 👇

USD/CAD Will it pullback!?Hello Ladies and Gentlemen!
I might have entered a tad early in this position, though it looks like it is forming a pullback.
The position is currently in a loss and that is okay. Let´s see if it works out.

NZDCAD This MA squeeze giving a strong Buy Signal.The NZDCAD pair has been trading within a long-term Channel Up pattern, currently sitting above bot the 1D MA50 (blue trend-line) and the 1D MA200 (orange trend-line). The upcoming squeeze of the two MA periods was last time a confirmation that the Bullish Leg that started would continue.
That rally peaked on June 12, just above the 1.236 Fibonacci extension. As a result, even though we are practically half-way into the current rally and the potential return is now less, we turn bullish on this pair, targeting 0.85650.
-------------------------------------------------------------------------------
** Please LIKE 👍, FOLLOW ✅, SHARE 🙌 and COMMENT ✍ if you enjoy this idea! Also share your ideas and charts in the comments section below! This is best way to keep it relevant, support us, keep the content here free and allow the idea to reach as many people as possible. **
-------------------------------------------------------------------------------
💸💸💸💸💸💸
👇 👇 👇 👇 👇 👇

CADCHF Strong buy signalThe CADCHF pair offered us an excellent sell signal last time we looked into it (July 02, see chart below) as trading within a Channel Down pattern, it was rejected on its 1D MA50 (blue trend-line) and hit our 0.63100 Target:
The Channel Down priced its new Lower Low, even broke momentarily below its bottom aggressively, and now seems to have recovered. The recent pull-back offers a good opportunity to enter this confirmed uptrend, which is technically the new Bullish Leg of the Channel Down.
Our Target is 0.65000, firmly below the 0.786 Fibonacci retracement level of the previous Lower High of the Channel, which is where both Lower Highs so far have been priced.
-------------------------------------------------------------------------------
** Please LIKE 👍, FOLLOW ✅, SHARE 🙌 and COMMENT ✍ if you enjoy this idea! Also share your ideas and charts in the comments section below! This is best way to keep it relevant, support us, keep the content here free and allow the idea to reach as many people as possible. **
-------------------------------------------------------------------------------
💸💸💸💸💸💸
👇 👇 👇 👇 👇 👇

USDCAD - Head and Shoulders Hello Traders !
The USDCAD reached the resistance level (1.39780 - 1.38811).
The price formed a head and shoulders pattern.
Currently, The neckline is broken !
So, I expect a bearish move 📉
__________________
TARGET: 1.36750🎯

AUDCAD: Important Breakout 🇦🇺🇨🇦
AUDCAD broke and closed above a key daily/intraday resistance cluster.
The broken structure turned into support.
We may expect a bullish continuation from that.
Next goal - 0.9115
❤️Please, support my work with like, thank you!❤️

BOC Rate Cut Bets Grow as Loonie Stands Firm
R2 1.3947 – 5 August/2024 high – Strong
R1 1.3900 – Figure – Medium
S1 1.3718 – 9 August low – Medium
S2 1.3700 – 19 July low – Medium
We remain in the thick of thin summer trade, something that must be taken into consideration when reflecting on price action. The market has done a good job overall recovering from last Monday’s panic mess and the question on everyone’s mind is whether or not all of that doom and gloom is behind us or just the start to another intense wave of risk off flow.
The Canadian Dollar held up rather well on Friday despite the discouraging Canada employment report. The local rate market has now begun to price in the 10% possibility for an even bigger 50 basis point rate cut at the Bank of Canada's next meeting in early September. Key standouts on Monday’s calendar come from German wholesale prices, Canada building permits, US consumer inflation expectations, and the US monthly budget statement.
A sustained hold above 1.3000 over the past several months signals an end to a period of longer-term bearish consolidation and suggests the market is in the process of carving out a more significant longer-term base. Next key resistance now comes in up into the 1.4000 area, with a break to open a retest of the 2020 high just ahead of 1.4700. Setbacks should be very well supported down into the 1.3000 area.
Exclusive FX research from LMAX Group Market Strategist, Joel Kruger

GBPCAD Waiting for the 1D MA200 to confirm the bottom.The GBPCAD pair broke this week below its 1D MA50 (blue trend-line) and is (including today) on a 2 day green streak. However this is technically not convincing for us to buy as despite holding the Internal Higher Lows trend-line, it is the 1D MA200 (orange trend-line) that has confirmed the major Higher Lows (bottoms) of the 11-month Channel Up.
In fact, it was a similar Internal Higher Lows trend-line that broke on April 01 2024 and despite a short-term rebound, broke downwards to confirm a bottom on the 1D MA200. As a result, we are waiting for that ideal technical opportunity to long and target 1.8000.
-------------------------------------------------------------------------------
** Please LIKE 👍, FOLLOW ✅, SHARE 🙌 and COMMENT ✍ if you enjoy this idea! Also share your ideas and charts in the comments section below! This is best way to keep it relevant, support us, keep the content here free and allow the idea to reach as many people as possible. **
-------------------------------------------------------------------------------
💸💸💸💸💸💸
👇 👇 👇 👇 👇 👇
