GBPAUD: Correction ContinuesAfter a period of consolidation within a broad horizontal range on an intraday chart, the 📈GBPAUD pair has violated its support level
This violation represents a significant indication of the buyers' dominance.
It could potentially initiate an upward correction, possibly reaching as high as 2.0717 support level.
Candlestick Analysis

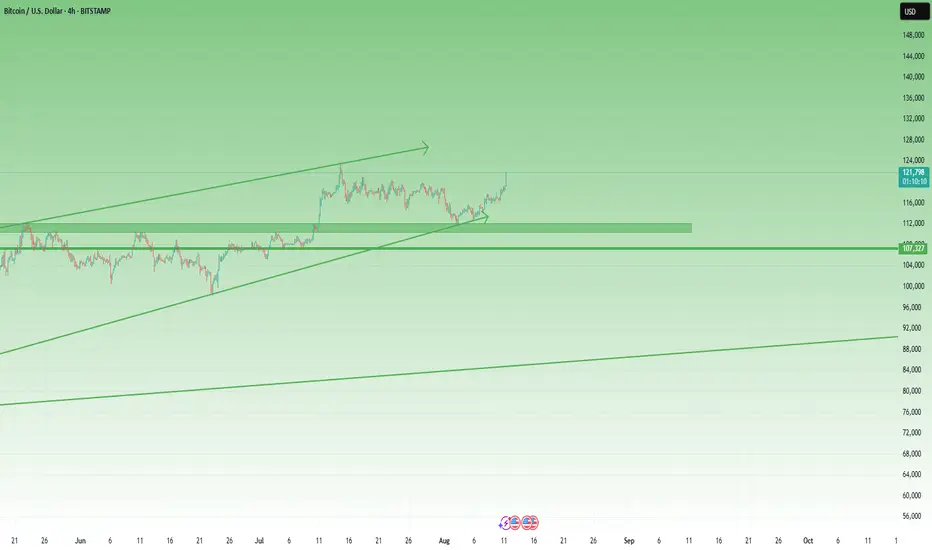
BTC Bulls Back in Control – 130K in SightIn my previous BTC analysis, I highlighted that the price was sitting right in a confluence support zone, with strong odds for a bullish reversal.
That scenario played out well — bulls regained control. After a retest of the low pruces in the middle of last week and a modest initial bounce, momentum accelerated today, pushing BTC close to its previous all-time high at the time of writing.
Looking ahead, I don’t expect the old ATH to be a major obstacle for buyers. A clean break above should open the path toward 130K+ as the next logical upside target.
For now, as long as BTC trades above 114K, bulls have no reason for concern.
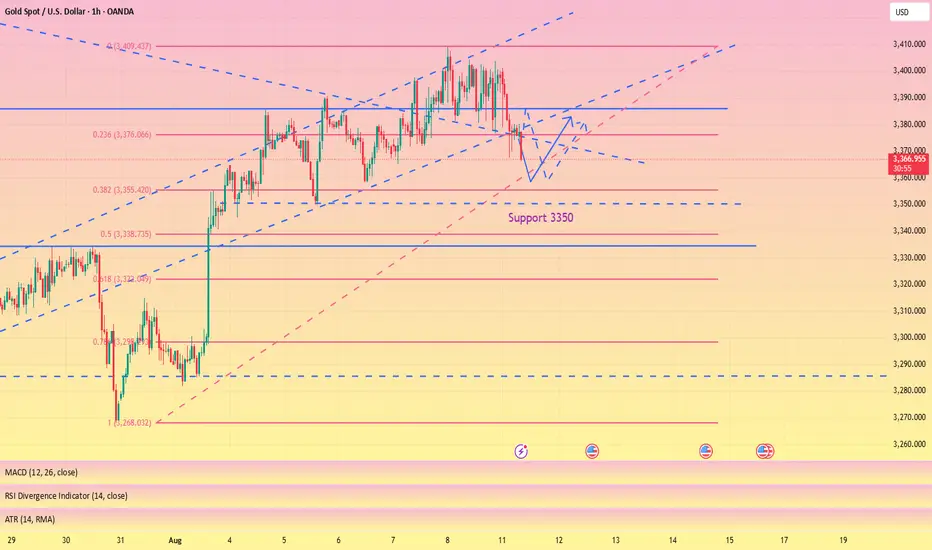
Gold’s Drop: The Calm Before the SurgeThe bulls have been defeated all the way, and the current lowest has fallen to around 3350. However, after gold touched around 3350, the downward momentum has slowed down. I think it is not appropriate to be overly bearish on gold in the short term.
It can be clearly seen during the day that gold started to fall from around 3401, and the decline reached $51 around 3350. In the absence of any major negative news, I believe that the intraday retracement space has reached its upper limit, and the structural support line for gold bulls happens to be in the 3350-3340 area, so the room for gold to continue to retrace will not be too large.
Moreover, gold has recently fallen under pressure several times after standing above 3340, proving that the upper resistance still exists. In addition, there is a certain amount of selling, which has hindered the bullish momentum to a certain extent, resulting in the lack of momentum for gold bulls. After the current pullback and technical repair, due to the increase in gold liquidity and accumulation of strength, it may be more conducive for gold to hit 3400 again or even higher targets.
Therefore, in the short term, I think it is not advisable to chase gold too much; instead, we can accumulate enough cheap chips during the gold pullback, and then wait patiently for gold to rebound and hit 3380-3390 again.

LTCUSDT:Elliot Wave Analysis Hello friends we see the chart of LTCUSDT , elliot analysis, the end of 5th of C wave at 138$ and I expected start the correction wave

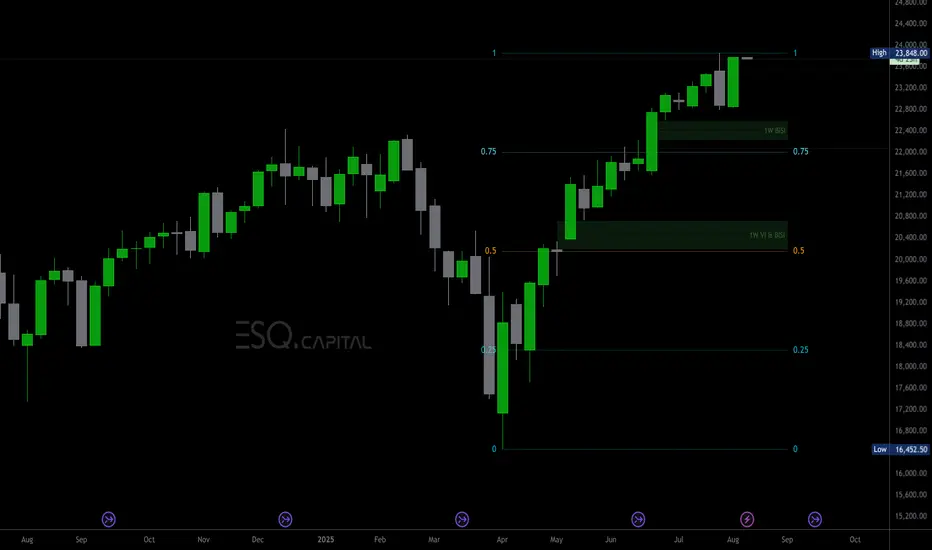
MNQ SET TO MAKE MORE NEW HIGHS, BEWARE OF THE STRONG PULLBACKSWe are very likely to witness CME_MINI:MNQU2025 (and of course NQ) reaching for new highs in the not too distant future.
However it is wise to bare in mind that price having made a high in the previous week of may experience a deep retracement into an area of weekly price inefficiency:
This general area sits nicely above the lower end of the Premium-High of the current weekly Dealing Range (0.75 DRT).
It is also feasible to expect price to revisit the Equilibrium of the current weekly Dealing Range (0.5DRT) as depicted in the chart at a general area of over the next month or so before seeing sustainable new highs being achieved.
Lets keep a keen look out for the release of this week's economic reports (especially inflation related) that may help drive price lower in the short term before we see it achieve a season of further new highs.
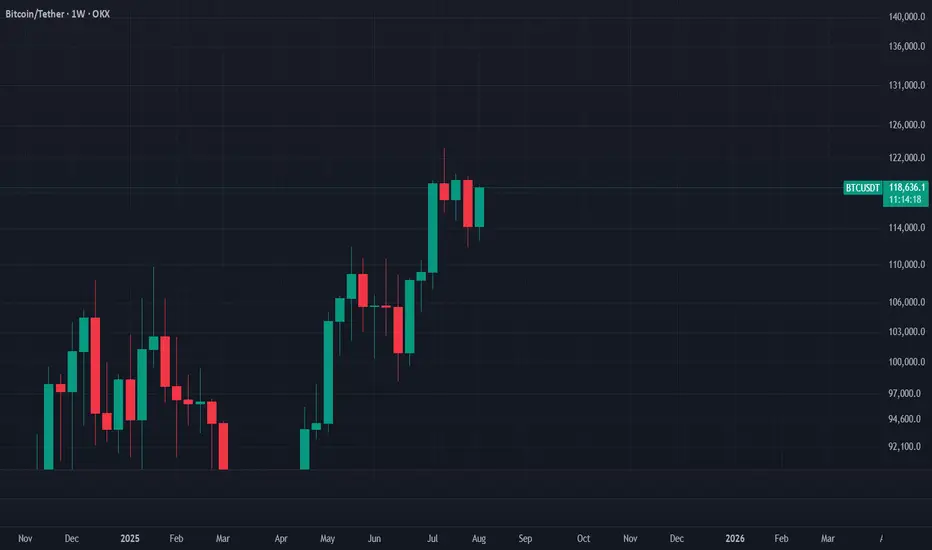
Bitcoin Readies for a $120K Breakout — Watch the Weekly Candle
OKX:BTCUSDT
Summary
If Bitcoin’s weekly candle engulfs the previous one, we can expect an explosive breakout.
Instrument / Timeframe
BTCUSDT, 1W
Scenario
If this week’s candle fully engulfs the prior week, the next week can start decisively bullish and push into fresh highs. For now, we won’t set fixed upside targets; let price discover. Once the market prints a clear resistance at the new peak, we’ll treat that level as Bitcoin’s new ceiling.
Trade Plan (example, not advice)
For long-term buyers who practice sound risk and capital management, a confirmed daily break and close above $120,000 can serve as an entry trigger.
Disclaimer
This is market commentary and reflects my personal opinion. It is not investment advice, a recommendation, or a solicitation to buy or sell any asset. Crypto markets are highly volatile and you can lose part or all of your capital. Always conduct your own research, make independent decisions, and use strict risk management (position sizing, stop-losses, scenario planning). Past performance is not indicative of future results. For guidance tailored to your situation, consult a licensed financial advisor.
#Bitcoin #BTC #BTCUSD #BTCUSDT #Crypto #Breakout #PriceAction #Engulfing #Candlestick #SupportResistance #MarketStructure #Momentum #RiskManagement #PsychologicalLevel #WeeklyClose
EURUSD: SELL OPPORTUNITYEUR/USD trading below a major resistance level and after pulling back to the broken trendline, we're seeing a scenario for short-term chop consolidation before potentially resuming the bearish move toward lower lows .
As long as price stays beneath the 1.1700 resistance level, the bearish bias remains intact.

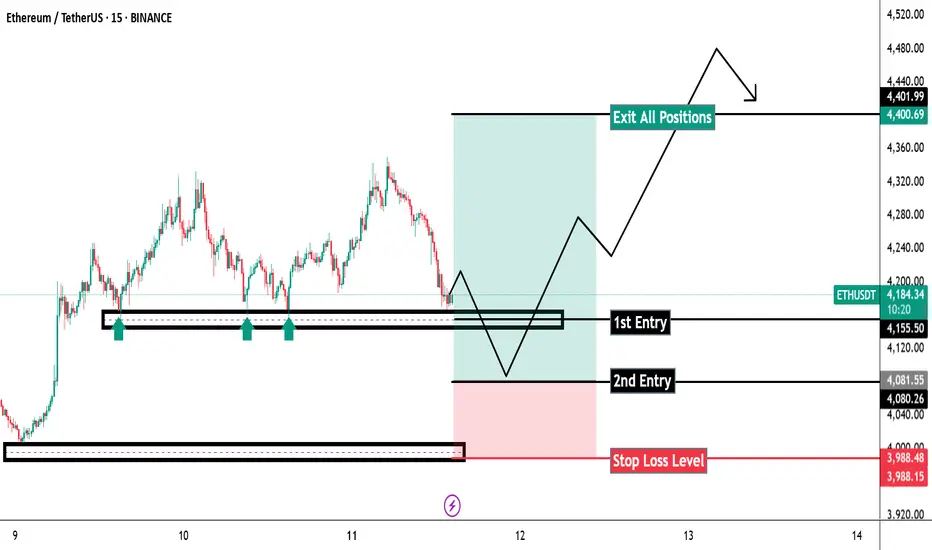
Can Ethereum Give Us Profit Before the Next Run to 4400?It feels safe to bid for BINANCE:ETHUSDT at 4100 right now and ride it up to 4400.
I will place my SL at 3.8k
Ignore this trade update if you don't know about position sizing and order scaling.
Let's see if this will cook.
What are your thoughts about this analysis? Let me know in the comments section.
If you like the analysis, like it and follow me for more trade updates.
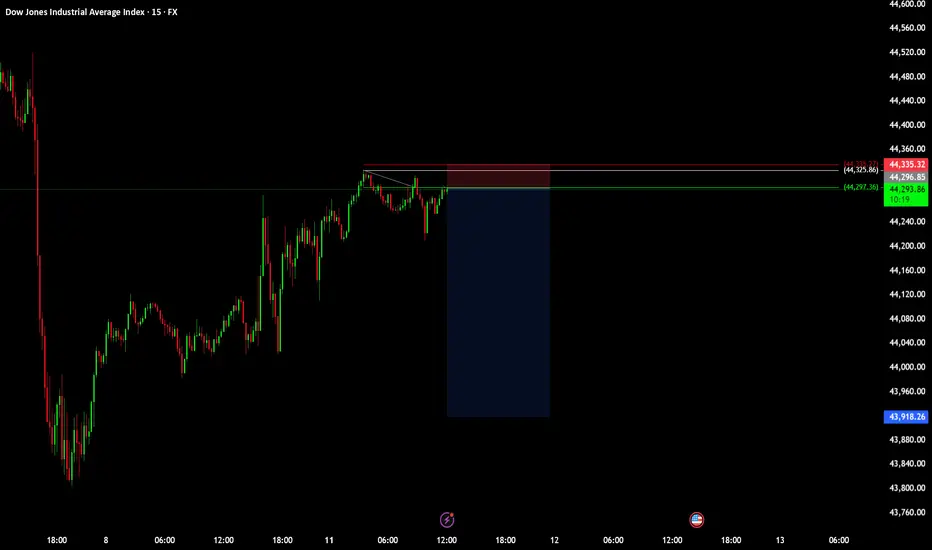
Short term idea on Ym (US30 Spot)Based on:
- Supply zone
- Different indices setup for short
- correlatoon between ethereum and indices indicate a potential short
The daily trend has not changed, go long on pullback#XAUUSD
Good morning, and a wonderful day. Last night we expected that if the 3390-3380 level below is effective, then gold will still have room to rise. After the morning opening, gold began to fall and adjust, reaching a low of around 3367, and the overall trend fell into a wide range of fluctuations. From a technical perspective, the daily moving average tends to converge upward, with the middle track located near 3357. Before it effectively falls below, the daily bullish trend remains unchanged. Paying attention to the 4H technical indicators, we find that the MACD indicator death cross with large volume tends to fluctuate and fall. In the short term, we should focus on 3380-3390 above. At present, we should focus on the support at 3350. If it fails to break through effectively, gold will rebound again. On the whole, it is recommended to go long when the price retreats to around 3360-3350 during the day, with the target at 3375-3385.
🚀 BUY 3360-3350
🚀 TP 3375-3385
Wait patiently, 3350 is the key, if it falls below, look at 3330Gold experienced frequent fluctuations last Friday night. After opening today at around 3,400, it quickly fell back. Gold has already fallen below last Friday's low. 🐻
It is expected to retrace to test the support level of 3357-3350 today📈. If the support level is not broken, the bulls may rebound at any time.🐂
If it unexpectedly falls below, it may accelerate its decline to around 3330📉, where there is also support, and you can go long in the short term when it approaches📊.
On the whole, the main strategy during the day is to go long based on support and callback. If it touches 3357-3350 for the first time, you can consider going long with a light position.✅
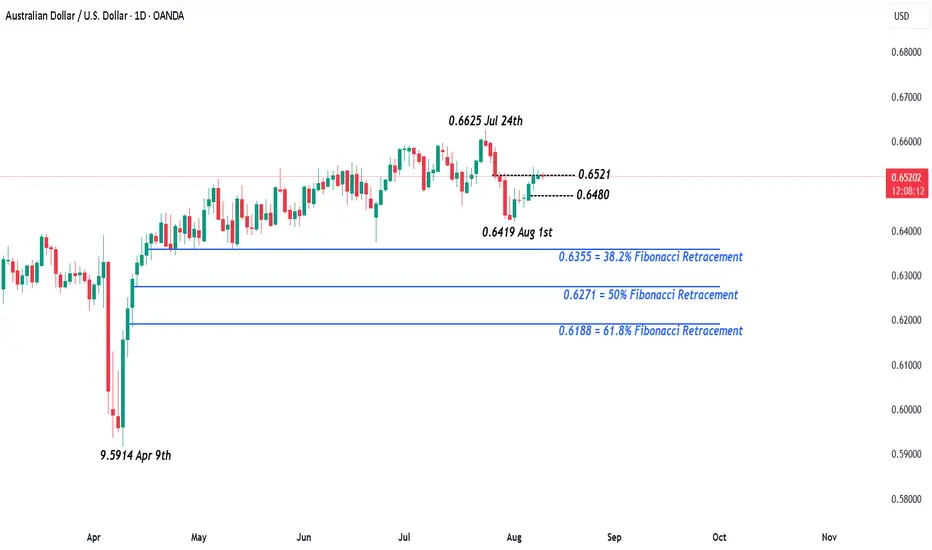
AUDUSD – Tuesday’s RBA Rate Decision and US CPI Release Pivotal?It’s only 5 weeks ago that the RBA surprised FX traders by keeping interest rates on hold to provide policymakers with extra time to assess new information on the Australian economy and to confirm that the direction of inflation is moving back down towards 2.5% on a sustainable basis. This decision helped AUDUSD to post a 2025 high of 0.6625 on July 24th, a level from which fresh selling reappeared resulting in a low of 0.6419 being touched on August 1st.
August has so far been a positive one for AUDUSD, with general US dollar weakness seeing this popular currency pair closing on Friday at 0.6522, right in the middle of the range identified above. This week, Tuesday is potentially the pivotal day for AUDUSD traders to focus on with the RBA Interest Rate Decision due at 0530 BST, which is then quickly followed by the press conference led by Governor Bullock starting at 0630 BST.
A 25bps (0.25%) RBA rate cut is fully priced so anything else would probably be an even bigger surprise than the July pause. Especially since the latest Q2 CPI print showed inflation moving lower, a move acknowledged by RBA Deputy Governor Hauser as a welcome development. This shifts the emphasis towards the press conference where AUDUSD traders will be keen to hear whether their expectations for more rate cuts from the RBA into the first quarter of 2026 are correct or well off base.
That’s the AUD side of the pair covered, then later Tuesday the focus shifts to the US dollar side, when the latest US CPI update is released at 1330 BST. FX traders are very sensitive to the direction of US inflation, and the outcome of this release could well influence whether the Federal Reserve cut interest rates at their next meeting in September, as traders expect, or if they could be forced to remain unchanged as President Trump’s tariffs start to lead to higher prices, something Fed Chairman Powell has stated policymakers are concerned about.
Strap in AUDUSD traders tomorrow could be a wild and volatile ride!
Technical Update: Is the 0.6521 Level Pivotal?
So far, August has seen AUDUSD rally from the August 1st low into last Thursday’s high by just under 2%. While this activity may lead to some traders anticipating a more sustained period of strength, looking at the chart below, it becomes evident that further confirmation may be required before jumping to this conclusion.
Price strength seen last Thursday and Friday, was held by the 0.6521 price level, which is equal to half the decline that materialised between July 24th and August 1st. While 0.6521 is currently being tested, this looks like the first potential resistance focus, with closing breaks above this level required to suggest further strength towards 0.6625, the July 24th high.
As for support, traders may well now be focused on the 0.6480 level, which is half of the August price strength. While not a guarantee of prolonged declines, successful closing breaks below the 0.6480 support, might suggest continued price weakness.
As the chart above shows, closing breaks below the 0.6480 level, may see prices under increasing pressure, with possibilities to then test the August price low at 0.6419, even 0.6355, which is the 38.2% Fibonacci retracement of April 9th to July 24th 2025 strength.
The material provided here has not been prepared accordance with legal requirements designed to promote the independence of investment research and as such is considered to be a marketing communication. Whilst it is not subject to any prohibition on dealing ahead of the dissemination of investment research, we will not seek to take any advantage before providing it to our clients.
Pepperstone doesn’t represent that the material provided here is accurate, current or complete, and therefore shouldn’t be relied upon as such. The information, whether from a third party or not, isn’t to be considered as a recommendation; or an offer to buy or sell; or the solicitation of an offer to buy or sell any security, financial product or instrument; or to participate in any particular trading strategy. It does not take into account readers’ financial situation or investment objectives. We advise any readers of this content to seek their own advice. Without the approval of Pepperstone, reproduction or redistribution of this information isn’t permitted.
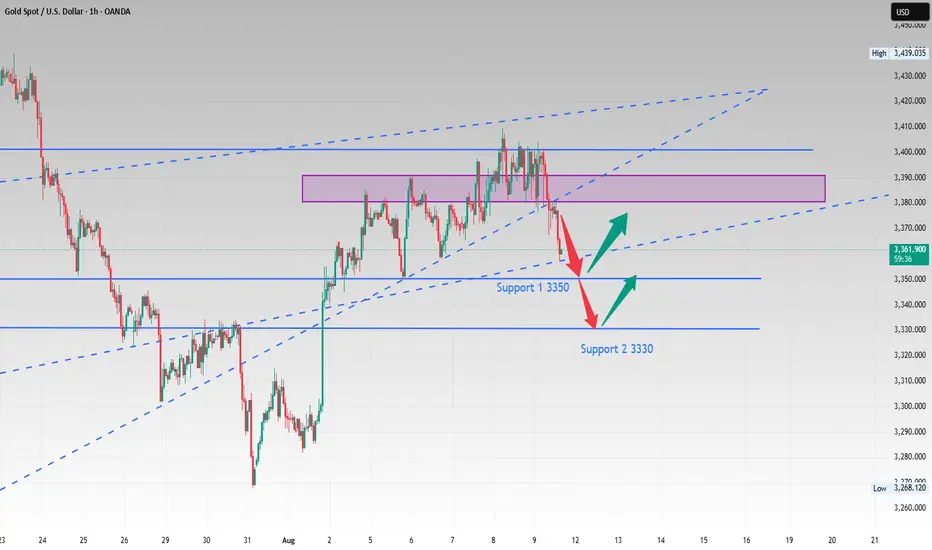
Gold’s Pullback: Fueling the Next Surge Toward 3390-3400Today is the first trading day of this week. Gold has continued to fall since the opening, and has reached a low of around 3364 so far. Through the short-term trend, we can see that gold has insufficient willingness to continue to rise above 3400 and still faces considerable resistance. It needs more support and momentum to drive it forward before it can continue to rise. Currently, gold continues to retreat to around 3364. Has the trend of gold turned into a bearish trend? I think it's too early to draw such a conclusion!
Although gold has fallen significantly, there is still strong buying support below. The 3360-3350 area has become a key support level. As long as gold does not fall below this area, the bullish structure has not been completely broken. Therefore, there is still sufficient energy for gold to continue its rebound. This decline in gold is intended to increase liquidity and accumulate more upward momentum, which will help gold stabilize at 3400 and move towards higher targets!
Therefore, for short-term trading, I think we can still continue to try to go long on gold, but after all, the decline in gold has been so large. For short-term trading, we can appropriately lower the rebound expectations to the 3380-3390 area.

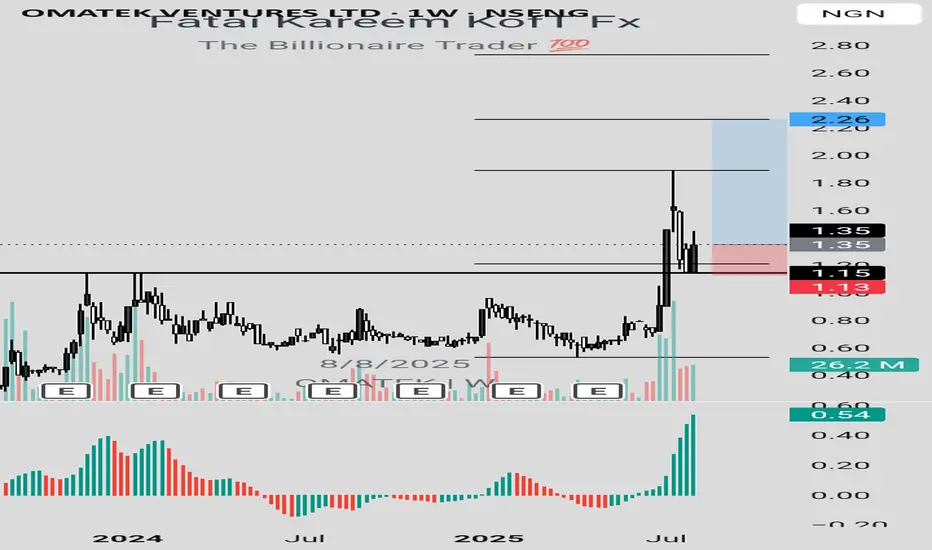
OMATEK LONG IDEAAfter getting to a resistance turned support within the discount level, bullish engulfing candlestick was formed on OMATEK stock. This is a signal that price is ready to go higher.
To take advantage of the long opportunity, you can buy at the current market price. The stop can be at N1.13 (-16.30%) while the targets are N1.89 (40%) and N2.26 (67.41%).
Confluences for the long idea:
1. Key level (resistance turned support)
2. Bullish engulfing candlestick
3. Uptrend
Disclaimer: This is not a financial advice. The outcome maybe different from the projection. Don't take the signal if you're not willing to accept the risk.
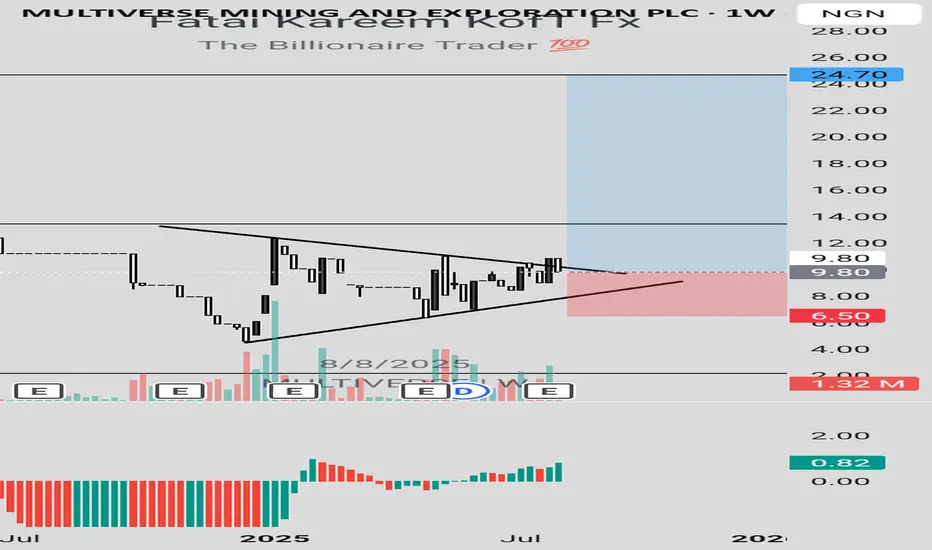
MULTIVERSE LONG IDEAMULTIVERSE just broke out of a trendline with a bullish engulfing candlestick. This happened within the discount level. Hence, this is an indication that price is ready to rally up targeting the high.
To take advantage of this long opportunity, you can buy at the current market price. The stop can be at N6.50 (-33.67%) while the targets are N12.30 (25.51%) and N24.70 (152.04%).
Confluences for the long idea:
1. Trendline breakout
2. Discount level
3. Uptrend
Disclaimer: This is not a financial advice. The outcome maybe different from the projection. Don't take the signal if you're not willing to accept the risk.
GAMUDA - Leading stock in CONSTRUCTION SECTORGAMUDA - CURRENT PRICE : RM4.97
Based on Japanese Candlestick , 30 April 2025 candle was a LONG CLOSING BOZU WHITE CANDLE . At that particular moment, it changed the trend from BEARISH to BULLISH because :
1) Price already above EMA 200 and closed on that day above EMA 50
2) Price closed into ICHIMOKU CLOUD
3) CHIKOU SPAN starts moving above CANDLESTICK
4) MACD also bullish
At current moment, after two days of selling pressure the share price turns positive today and closed higher than previous day's high. This may consider as potential buy on dips for those didn't have position yet. Supported by rising EMAs, the share price may move up to test the all time high level.
ENTRY PRICE : RM4.94 - RM4.98
TARGET : RM5.36 and RM5.57
SUPPORT : Below EMA 50 on closing basis

ETHUSD Buy !?I expect the price to retrace to approximately 4,190.37, after which the uptrend should resume with an initial price target of 4,265.43. What are your thoughts? Please share them in the comments.

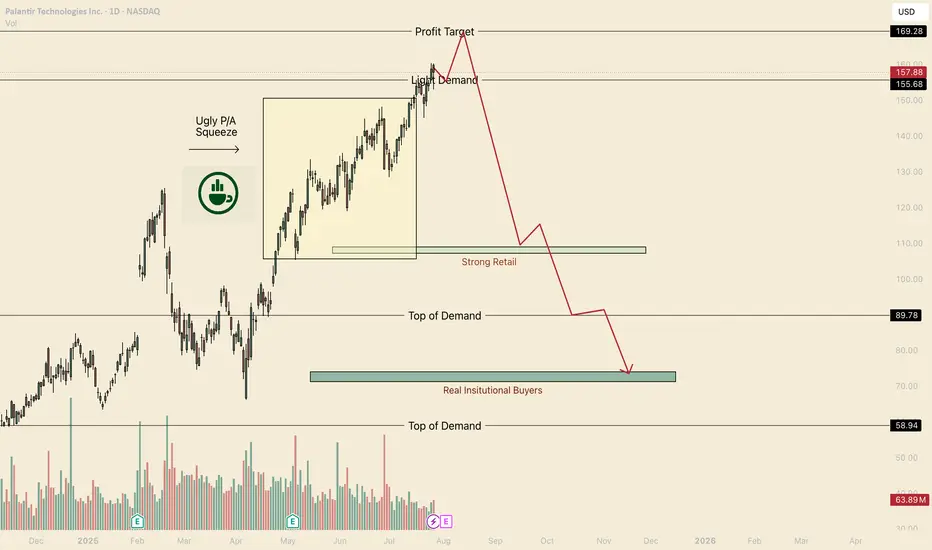
Hot Take, PLTR is a BubbleHello I am the Cafe Trader.
Price Action suggest we haven't had a proper buyer since $90.
Now I know that this can sound a bit off putting (especially if you bought above $90).
Even if this crashed, I am not suggesting you sell your long term position. I would instead look into hedging your position, giving yourself some exposure to the downside.
Consider these 2 non-biased reasons before writing me off.
Point 1
Price action suggests we have been in a short squeeze since April. Although in the short term I do see current retail buyers taking this to 169.
Point 2
If we do not land new Strong Buyer (someone that can support the price) all of this squeeze will come crashing back down to where they can support the price.
Conclusion
If we close below 152.50 on the day, this would suggest that bears have or are in control. This would expose many to tons of risk.
Here are my long Term prices for PLTR
Aggressive = 120
Fair = 107.50 - 108.50
Good = 89
Steal = 71-74.50
That's all for PLTR take a look at my other articles if you are interested in more!
Happy Trading!
@thecafetrader
ETH Critical Next Few Days.Hello I am the Cafe Trader.
Today we are taking a close look at Ethereum.
After the Tariff news and the Jobs report, The market as a whole seems very bearish suddenly to many. Even though we do have aggressive sellers in the short term, The market is still bullish in the mid to long term. Let's take a look.
Sentiment has changed
A major catalyst (like the Tariffs news) can cause a change of terrain. Buyers may become more bashful, taking their foot off the gas (where the put it before). Reactions to kry levels (like "top of demand") will give us clues into how strong are they still.
Short Term
ETH had a huge rally, Whats does a healthy rally need for a continuation?
Consolidation
This brings us to the charts
Top of demand gives us evidence of how convicted these current buyers still are in a market. A hot reaction = Aggressive Demand. Cold Reaction = Hesitant or lack of Demand.
Todays close was a touch cold, but considering the recent bearish news and data, not terrible. Buyers are still active in this area, but since the terrain might have changed, I have given you two scenarios.
Green Scenario
For this to play out, we need to see buyers step in immediately. The longer ETH stays in this demand, the heavier they will become (and it's a long way down)
Wait for a second test minimum. Best to get a hot reaction. If it presses into the demand zone, Cut it early. (always good to wait for a close)
Entry 3,518
Stop 3,360
TP 1 3,990
TP 2 Breakout? Trailing stop?
Red Scenario
If we can't close above top of demand (Like tomorrow...) This is the likely scenario. I would be hard pressed to try and catch a knife this overextended. So until we identify where the new sellers are sitting, I can't give you any trades on this scenario. If you are short biased this could run all the way down to the bottom of demand.
I'll keep a close eye this over the weekend and keep updates.
Long Term
These prices should be according to your personal sentiment on ETH.
Aggressive = 3,500
Good price = on the trend roughly 2,900 - 3k
STEAL = 2,200 - 2,400
That's all for ETH! Enjoy your weekend, and Happy Trading!
@thecafetrader

GER40 – Testing 24,300.00 Resistance ZoneGER40 has been pushing higher after reclaiming the 24,100.00 level, with price now consolidating just below the 24,300.00 resistance. Bulls are attempting to break through this zone to target the 24,652.29 high.
Support at: 24,100.00 🔽 | 23,950.00 | 23,800.00 | 23,400.00
Resistance at: 24,300.00 🔼 | 24,652.29 (ATH)
🔎 Bias:
🔼 Bullish: A breakout and close above 24,300.00 could trigger a rally toward the ATH at 24,652.29.
🔽 Bearish: Rejection at 24,300.00 with a drop below 24,100.00 may send price back toward 23,950.00.
📛 Disclaimer: This is not financial advice. Trade at your own risk.

Silver’s uptrend cracks with U.S. inflation in focusSilver’s latest run ended abruptly on Monday, with the metal reversing hard, breaking its recent uptrend and forming a bearish evening star three-candle pattern. With RSI (14) and MACD momentum readings now neutral rather than bullish, the focus shifts to price action over holding a set bias.
If the signal from recent price action proves reliable—a big “if” with U.S. CPI looming—watch for a break beneath $37.46, the prior multi-decade high from February 2012. If that occurs, one option would be to establish shorts beneath the level with a stop above for protection, targeting either the 50-day moving average or support at $36.27 or $35.50.
If silver fails to follow through on Monday’s reversal, the setup could be flipped, with longs established above the level and a stop beneath for protection. $38.50 or $38.73 screen as potential targets, with a break above the latter opening the door for a retest of the July 23 swing high at $39.53.
From a fundamental standpoint, the U.S. inflation report looms as Tuesday’s main volatility event. A monthly core reading of 0.4% or higher would likely create headwinds for riskier assets such as silver, curtailing Fed rate-cut pricing over the next year and strengthening the U.S. dollar. A core print below 0.3% could have the opposite effect, acting as a catalyst for a possible silver surge.
Good luck!
DS

NZDUSD INTRA-WEEK: BEARISH TRADE IDEAHi there,
I'm looking to sells on NZDUSD & GBPUSD as I speculate that this week would seek lower prices.
There is a clean bearish shift in market structure to look for shorts.
On the daily chart, we have created a swing high - which adds to the bearish conviction to seek lower prices.
I'd be sharing my trade idea for GBPUSD soon.
Cheers,
Jabari

August 11, Forex Outlook: What to Expect from This Weeks TradingWelcome back, traders!
In today’s video, we’ll be conducting a Forex Weekly Outlook, analyzing multiple currency pairs from a top-down perspective—starting from the higher timeframes and working our way down to the lower timeframes.
Pairs to focus on this Week:
USDCAD
EURGBP
EURJPY
GBPCHF
USDCHF
NZDCHF
EURNZD
Our focus will be on identifying high-probability price action scenarios using clear market structure, institutional order flow, and key confirmation levels. This detailed breakdown is designed to give you a strategic edge and help you navigate this week’s trading opportunities with confidence.
📊 What to Expect in This Video:
1. Higher timeframe trend analysis
2. Key zones of interest and potential setups
3. High-precision confirmations on lower timeframes
4. Institutional insight into where price is likely to go next
Stay tuned, take notes, and be sure to like, comment, and subscribe so you don’t miss future trading insights!
Have a great week ahead, God bless you!
The Architect 🏛️📉
