INJUSDT Daily Chart Analysis | Uptrend Brewing at Crucial LevelINJUSDT Daily Chart Analysis | Uptrend Brewing at Crucial Resistance
🔍 Let’s break down the INJ/USDT setup, examining its technical structure and mapping out key opportunities as it gears up for a decisive move.
⏳ Daily Overview
The INJUSDT pair is forming a solid bullish structure, supported by a clear ascending triangle pattern on the daily timeframe. Notably, the 3SMA (7, 25, 99) are crossing to the upside, signaling the early stage of a potential upward trend. This momentum is reinforced by the ascending triangle’s rising trendline, showing steady accumulation and higher lows.
🔺 Bullish Scenario:
Price is consolidating just below the critical resistance at $15.340—a key zone highlighted by multiple rejections in recent months. A confirmed breakout above this level, especially if backed by a surge in volume, would not only trigger a triangle breakout but also complete the weekly candle formation as a bullish hammer, strengthening the bullish case.
If this breakout sustains, short-term targets line up at $20.290, with the long-term roadmap pointing toward $33.970.
📊 Key Highlights:
- 3SMA (7, 25, 99) MA cross signals the beginning of an upward trend.
- Daily ascending triangle points to persistent bullish pressure.
- $15.340 remains a crucial resistance; price has tested and failed here twice before.
- Breakout confirmation (with volume) could ignite a rapid move to $20.290.
- Failure to break may result in another retest of the triangle’s trendline support.
🚨 Conclusion:
All eyes are on the $15.340 resistance. Wait for clear daily close and volume confirmation before entering. A successful breakout aligns with a bullish weekly hammer and could trigger the next phase higher. Beware of fakeouts, as rejection at resistance could send INJUSDT to retest lower trendline zones.
Stay sharp and plan your entries wisely!
Candlestick Analysis

Nifty Analysis EOD – July 25, 2025 – Friday🟢 Nifty Analysis EOD – July 25, 2025 – Friday 🔴
"When the tide goes out, you discover who’s been swimming naked." – Warren Buffett
Nifty GapDowns Below Key Support and Slips Further
The market opened with a sharp GapDown, breaching the previous day's low and instantly shedding 150 points within the first hour. Nifty attempted to find footing near the crucial 21st July low zone of 24,850–24,880, but the support gave way, slipping an additional 50 points.
The day mostly drifted around these lower levels with bearish dominance. Though bulls made an effort to recover late in the session, it lacked strength. The index finally settled at 24,837, decisively closing below the 21st July low — signalling a deeper structural breakdown.
📉 Trend & Zone Update
Resistance Zone Shifted To: 25,144 ~ 25,155
Support Zone Shifted To: 24,729 ~ 24,755
📊 What If Plans – 28th July Outlook
🅰️ Plan A (Contra Long Setup)
If market opens inside the previous day range and finds support at 24,815 ~ 24,850
Then potential targets are 24,920, 24,965, and 25,020
🅱️ Plan B (Trend is Friend – Short Continuation)
If market opens inside range and faces resistance around 24,965 ~ 24,995
Then aim for 24,850, 24,815, 24,780, and 24,730
⏸️ On-the-Go Plan
If market Gaps Up/Down outside previous day’s range
Then wait for the Initial Balance (IB) to form and act based on structure and S/R levels.
🕯 Daily Time Frame Chart with Intraday Levels
🕯 Daily Candle Breakdown
Open: 25,010.35
High: 25,010.35
Low: 24,806.35
Close: 24,837.00
Candle Structure
Body: Strong red candle (−173.35 pts)
Upper Wick: None (open = high)
Lower Wick: 30.65 pts
Interpretation:
A textbook bearish Marubozu — shows sellers had control throughout.
Bears stepped in immediately from open, preventing any bullish response.
Minimal lower wick implies limited buyer defense even at the session low.
Key Insight:
Bears are in command; bulls must reclaim 25,000+ quickly to prevent further downside.
If 24,800–24,820 breaks, eyes shift to 24,700–24,750 zone next.
🛡 5 Min Intraday Chart
⚔️ Gladiator Strategy Update
ATR: 192.95
IB Range: 87.4 → Medium
Market Structure: Imbalanced
Trades Triggered:
🕙 10:10 AM – Short Entry → 🎯 Target Hit (1:2.4 R:R)
🧭 Support & Resistance Levels
Resistance Zones
24,920
24,965
24,995 ~ 25,018
25,080
25,140 ~ 25,155
Support Zones
24,780
24,755 ~ 24,729
24,640
📌 Final Thoughts
When strong candles appear back-to-back with no meaningful recovery in between, it’s not just a correction — it’s a statement. In this market phase, reacting to price structure rather than assumptions will keep you on the right side. Stay nimble, stay prepared.
✏️ Disclaimer
This is just my personal viewpoint. Always consult your financial advisor before taking any action.

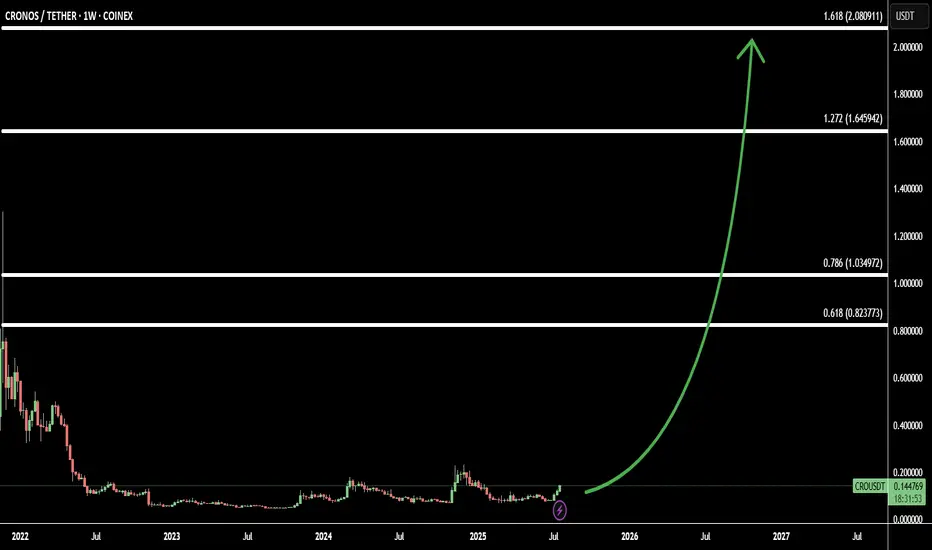
CRO Signals Big Move: 3 Soldiers Pattern + 4 Fibonacci Target(CRO/USDT) is showing a strong bullish reversal on the chart, forming the classic Three White Soldiers pattern — a powerful signal of trend reversal and sustained momentum.
This move comes after a prolonged consolidation phase, making CRO an ideal low-capital investment with the potential for a high reward.
Using Fibonacci extensions, I’ve identified 4 bullish targets:
Target 1: 0.618 Fib – 0.82 - confirmation of trend shift
Target 2: 0.786 Fib – 1.03 - key resistance zone
Target 3: 1.272 Fib – 1.64 - major breakout level
Target 4: 1.618 Fib – 2.08 - full bullish potential zone
With technicals and sentiment aligning, CRO may be gearing up for a big move, and current prices offer one of the best risk-reward opportunities in the market.
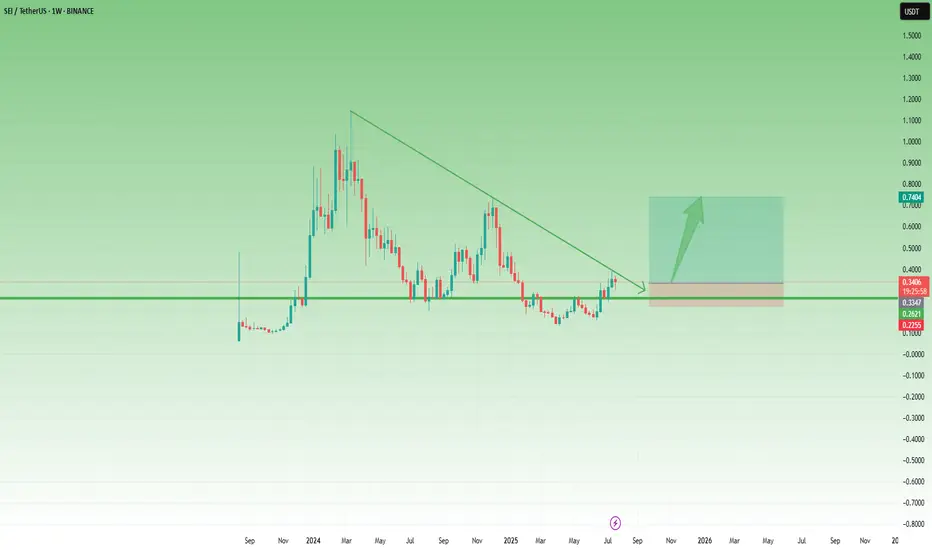
SEI Breakout Setup: Buy the Dip Before the Next Leg UpAfter the low around 0.13 in April, SEI started to recover, and although the first attempt to reclaim the 0.25–0.26 zone failed in mid-May, that key area—a former support from last year—was finally broken at the end of June.
Now, this previous resistance has turned into support, and even though gains have so far been capped by the falling trendline, price is consolidating above support – which could be a sign of bullish pressure building.
If we get a clean break above this descending trendline, momentum could accelerate, opening the way for a push toward the 0.75 resistance.
This is exactly the scenario I’m working with.
I'm looking to buy dips, with an ideal entry around 0.30, while keeping in mind that a move below 0.25 would invalidate the setup.
✅ Risk-reward? With a stop below 0.25, this setup offers a 1:4 R:R, and even a realistic chance at a 2x trade, which would be quite reasonable under current market conditions.
Real Sellers Vs Passive Sellers AMZNHello I am the Cafe Trader.
I was fortunate enough to get an editors pick, and I wanted to expound on how I came to those conclusions.
In this video we talk about passive sellers vs aggressive sellers and how we identify them. Also why it's important to identify these players in the market. This will help give you depth and help you get really good pricing in the markets.
Hope you enjoy the voiceover, Feel free to take a look at the previous article that this was pulled from on my profile.
Please share a boost if you enojoyed, and consider following for more.
Until next time! Happy Trading!!
@thecafetrader

Xauusd (GOLD)Price need to do some breakout resistance before it can go up. I still bias for long until price tell me that i need to against my analysis.
-4thur

OILUSD Range Between 60–64.26 – Will Support Hold or Break?WTI Crude has been in a sideways range after the sharp drop in early April. Price recently tested resistance at 64.260 but failed to break higher, pulling back into the 60.000 support zone. This level has held multiple times, forming a key pivot.
Support at: 60.000 🔽, 55.931 🔽
Resistance at: 64.260 🔼, 67.000 🔼, 71.101 🔼
🔎 Bias:
🔼 Bullish: A strong rejection from the 60.000 zone followed by a breakout above 64.260.
🔽 Bearish: A daily/12H close below 60.000 opens the path to retest 55.931, and potentially lower.
📛 Disclaimer: This is not financial advice. Trade at your own risk.

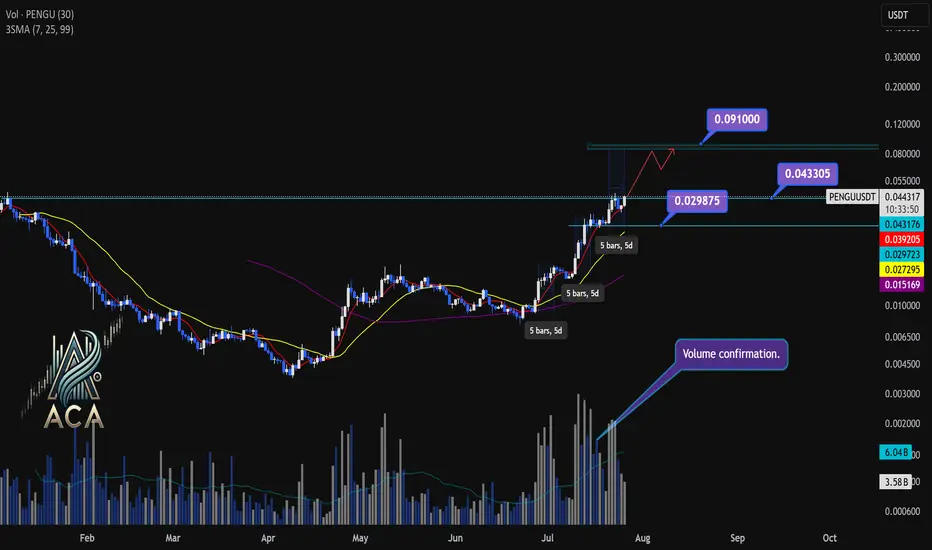
PENGUUSDT Daily Chart Analysis | Powerful Uptrend in PlayPENGUUSDT Daily Chart Analysis | Powerful Uptrend in Play
🔍 Let’s dissect the current PENGU/USDT daily chart, highlighting the unmistakable bullish structure and mapping potential targets as this trend matures.
⏳ Daily Overview
PENGUUSDT is riding a strong upward trend, with all three daily SMAs (7, 25, and 99) lined up in bullish sequence—clear confirmation of momentum. Recent rallies are also supported by textbook volume behavior: volume consistently surges during price climbs and tapers off during minor corrections, reflecting the classic signature of a robust uptrend.
🔺 Bullish Setup and Price Targets:
The next major upside target sits at $0.0910, almost 85% above the current level. For bulls, a daily candle closing above $0.043305 with convincing volume should act as a confirmation for fresh highs—though, as it’s Saturday, even moderate volume could suffice for a valid breakout.
📊 Key Highlights:
- All SMAs (7, 25, 99) confirming the uptrend on daily timeframe.
- Volume spikes on upward moves, fades on corrections—classic bullish confirmation.
- Historical trend velocity: Each time a new high (HH) is set, it’s preceded by around 5 days of advance; first leg was +83%, second +124%, the next (projected) is +160%, aligning with the $0.0910 target.
- Corrections: After each rally, pullbacks have measured about 15% and 20%. Should the first target be reached, expect a correction up to 25%—a healthy reset for further continuation.
🚨 Conclusion:
With all signals aligned—moving averages, volume dynamics, and historic price structure—the path remains bullish. A decisive close above $0.043305, especially with solid volume, could be the catalyst for the next major leg higher. As always, monitor for typical correction ranges post-breakout in line with the prior trend.
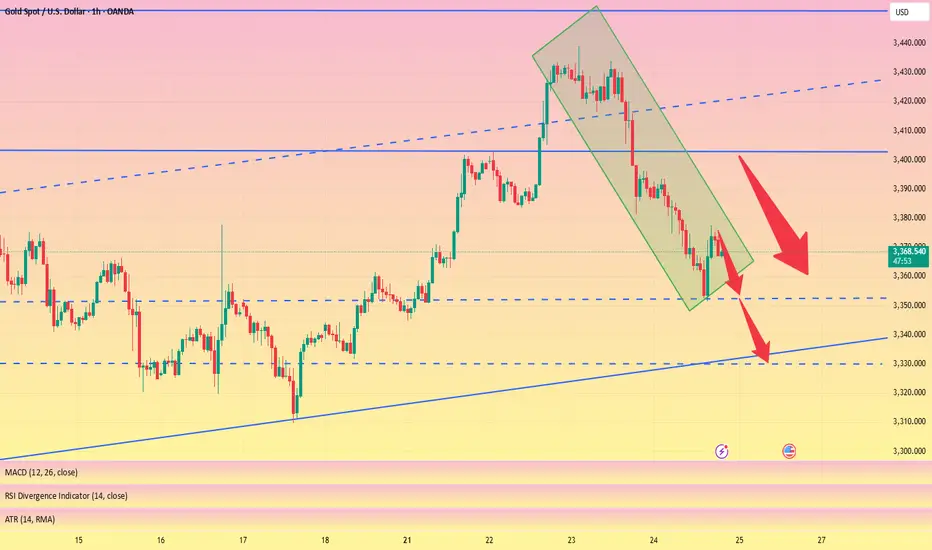
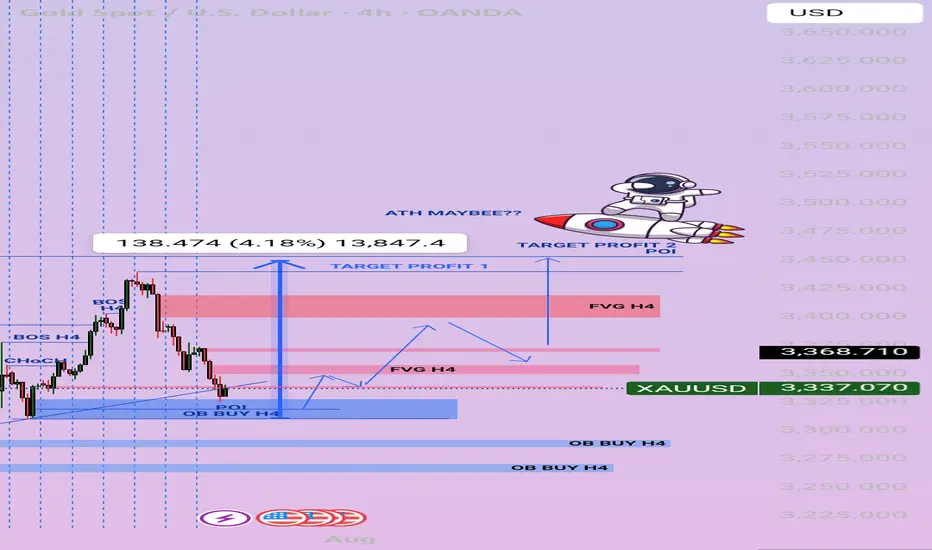
XAUUSD Weekly July 2025 28 July - 1 Aug🧭 MARKET STRUCTURE OVERVIEW – H4
1. Major Trend: Bullish
The overall trend remains bullish, with multiple Bullish Breaks of Structure (BOS) recorded during the upward move since early July.
A strong CHoCH followed by a solid Bullish BOS on H4 after the early July breakout confirms strong buyer intent.
---
2. Bearish BOS?
You're absolutely right — there are no significant Bearish BOS on H4 after the recent rally.
The current downward movement appears to be a retracement, not a structural break. No confirmation of bearish market structure yet.
---
🔵 CURRENT ZONE: H4 OB BUY (Active POI)
Price is currently rejecting from the H4 OB BUY zone, which aligns with the ascending trendline confluence.
If the H4 candle closes with a strong rejection (e.g. bullish engulfing or pinbar), this would confirm a potential buy entry for the next bullish leg.
This OB BUY is the main POI for next week and represents a:
✅ Buy from Discount
✅ Entry in Uptrend Structure
✅ Confluence of OB + POI + Momentum
---
🟥 FVG & TP Structure
1. TP1 / Scaling Zone:
H4 Fair Value Gap (FVG) around 3368–3380 can serve as the first target.
2. Final TP / ATH Zone:
Upper FVG (3420+) near a previous POI could act as the final target or a potential ATH test zone if buyers push higher.
---
🚀 TRADING PLAN – NEXT WEEK (Still Valid)
✅ Structure is still bullish
✅ Current drop is a retracement to OB BUY
✅ No valid Bearish BOS detected
✅ Current POI + OB BUY zone = prime entry level
---
📌 ENTRY STRATEGY
Entry: Buy within the OB BUY H4 zone (around 3320–3340)
Confirmation: Wait for a strong H4 rejection candle
Stop Loss: Below OB H4 (~3310, or adjust to lower OB zone)
TP1: 3368–3380 (FVG zone)
TP2: 3420+ (Upper FVG / POI / ATH zone)
---
⚠️ Additional Notes
If price breaks below OB BUY H4 with a strong bearish candle, this setup becomes invalid.
Then, we shift focus to lower OB zones (3280 / 3250).
Be cautious of high-impact news (FOMC/NFP?) – price may spike before confirming direction.
---
🔥 FINAL VERDICT:
✅ Plan is highly valid
❌ No strong bearish structure in place
🔒 Current POI is a key sniper entry zone
Fiber (EU) This is my Analysis for the Eurousd, Fiber has been in down trend for years now and comparing the US Central bank interest rates with the European Central bank it shows that the Dollar is Stronger compared to the Euro, Blending the Fundamentals with Technical Analysis.

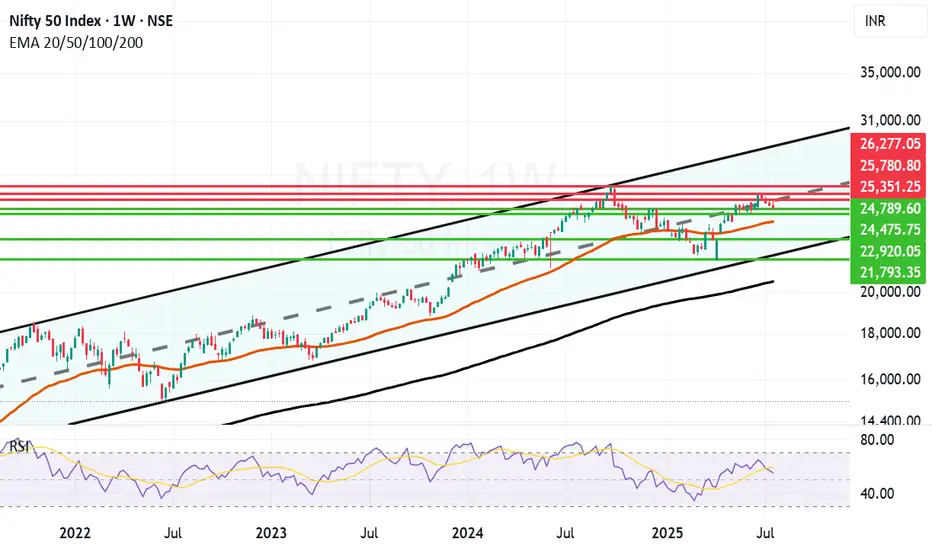
Long term Nifty Outlook Still upbeat. Long term outlook of Nifty is still upbeat. As you can see in the parallel channel in the weekly chart of Nifty. As you can see in the weekly chart Nifty attempted to break free above the Mid-Channel resistance went above it briefly but due to various geopolitical, Tariff and earning related concerns has not yet been successful. In a few years time the channel top can be around 30K and channel bottom seems to be around 21K. Supports for Nifty currently are near 24789, 24475, 23969 (Mother Line support of Weekly chart), 22920 and 21793 (Channel Bottom.) Below that 200 Weeks EMA ot the Father line is at 20577. Resistances for Nifty with long term perspective remain at 25351, 25780 and previous All time high of 26277. Once we get a weekly or monthly closing above 26277 the doors towards 27K+ will open.
Disclaimer: The above information is provided for educational purpose, analysis and paper trading only. Please don't treat this as a buy or sell recommendation for the stock or index. The Techno-Funda analysis is based on data that is more than 3 months old. Supports and Resistances are determined by historic past peaks and Valley in the chart. Many other indicators and patterns like EMA, RSI, MACD, Volumes, Fibonacci, parallel channel etc. use historic data which is 3 months or older cyclical points. There is no guarantee they will work in future as markets are highly volatile and swings in prices are also due to macro and micro factors based on actions taken by the company as well as region and global events. Equity investment is subject to risks. I or my clients or family members might have positions in the stocks that we mention in our educational posts. We will not be responsible for any Profit or loss that may occur due to any financial decision taken based on any data provided in this message. Do consult your investment advisor before taking any financial decisions. Stop losses should be an important part of any investment in equity.
Bitcoin AnalysisWe have an order block in 1Hour TF, price can retest this before bullish continuation. If it breaks below bearish momentum continues.
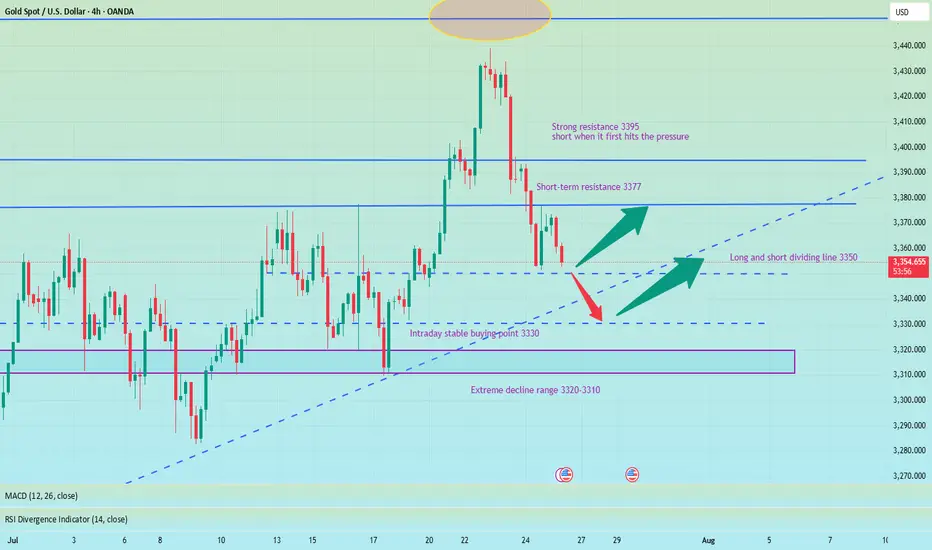
Wait for 3330 to buy the bottom and reduce unnecessary operation#XAUUSD
We have made good profits from short selling yesterday. Currently, gold has fallen to 3350📎. The 4HMACD death cross has increased in volume and is expected to continue to decline. Consider going long near 3330📈. I don’t think it is prudent to bottom out at 3340. Move forward steadily on Friday and reduce unnecessary operations⚖️.
🚀 BUY 3335-3330
🚀 TP 3345-3362
Be alert to new lows, pay attention to 3350 and go long at 3330📰 News information:
1. Tariff issues
2. Next week's NFP data
📈 Technical Analysis:
Last night, gold rebounded to only around 3377 before starting to fall back. Our judgment that the current rebound is weak is completely correct. 3350 is the support point of the bottoming out and rebounding to nearly $20 last night. Whether the European session can go down to 3350 will determine the trend of gold.
From the daily chart, the daily line has fallen for two consecutive days, suggesting that the price may continue to fall today. At present, we need to pay attention to this week's starting point of 3344-3345, and then the 3330 line below. The extreme decline is 3320-3310. At the same time, the narrowing of the daily Bollinger Bands is also paving the way for next week's NFP data.
From the 4H chart, the current MACD indicator crosses and increases in volume, and the middle track of the Bollinger Bands and SMA30 basically overlap near 3388. As for the hourly chart, the upper pressure is mainly concentrated near 3375-3377, which is also the high point of the rebound last night. If gold rebounds directly upward and encounters pressure and resistance at 3375-3385 for the first time, you can consider shorting and strictly implement stop loss.
Overall, if the current market falls to 3350-3345 for the first time and gets effective support, you can consider going long with a light position, defend 3340, and look to 3356-3362; if the decline is strong and continues to fall below 3350, the best stable long point for the day is 3330-3320, defend 3310, and earn $10-20 to leave the market.
🎯 Trading Points:
BUY 3350-3345
TP 3356-3362
BUY 3330-3320
TP 3345-3360
In addition to investment, life also includes poetry, distant places, and Allen. Facing the market is actually facing yourself, correcting your shortcomings, facing your mistakes, and exercising strict self-discipline. I share free trading strategies and analysis ideas every day for reference by brothers. I hope my analysis can help you.
TVC:GOLD PEPPERSTONE:XAUUSD FOREXCOM:XAUUSD FX:XAUUSD OANDA:XAUUSD FXOPEN:XAUUSD
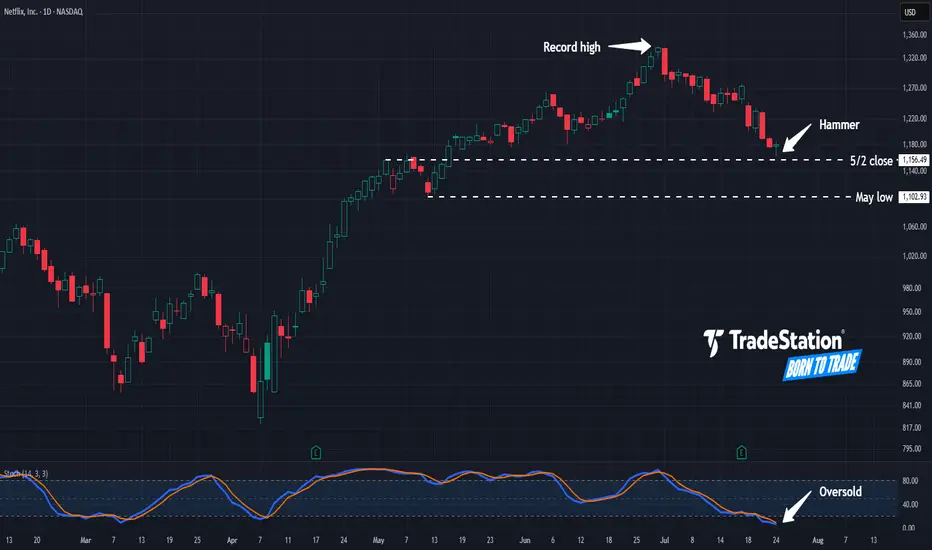
Hammer in NetflixNetflix has pulled back from record highs, and some traders may see potential opportunities in the streaming video giant.
The first pattern on today’s chart is the $1,156.49 level. It was a weekly close on May 2 and near the high the following week. NFLX is now showing signs of potential stabilization near that level. Is new support emerging?
Second, prices hit their lowest level in more than two months yesterday but rebounded. The resulting hammer candlestick pattern may be viewed as a bullish reversal pattern.
Third, stochastics have fallen to oversold territory.
Fourth, if the potential support at $1,156.49 breaks, traders may next eye the May low of $1,102.93.
TradeStation has, for decades, advanced the trading industry, providing access to stocks, options and futures. If you're born to trade, we could be for you. See our Overview for more.
Past performance, whether actual or indicated by historical tests of strategies, is no guarantee of future performance or success. There is a possibility that you may sustain a loss equal to or greater than your entire investment regardless of which asset class you trade (equities, options or futures); therefore, you should not invest or risk money that you cannot afford to lose. Online trading is not suitable for all investors. View the document titled Characteristics and Risks of Standardized Options at www.TradeStation.com . Before trading any asset class, customers must read the relevant risk disclosure statements on www.TradeStation.com . System access and trade placement and execution may be delayed or fail due to market volatility and volume, quote delays, system and software errors, Internet traffic, outages and other factors.
Securities and futures trading is offered to self-directed customers by TradeStation Securities, Inc., a broker-dealer registered with the Securities and Exchange Commission and a futures commission merchant licensed with the Commodity Futures Trading Commission). TradeStation Securities is a member of the Financial Industry Regulatory Authority, the National Futures Association, and a number of exchanges.
Options trading is not suitable for all investors. Your TradeStation Securities’ account application to trade options will be considered and approved or disapproved based on all relevant factors, including your trading experience. See www.TradeStation.com . Visit www.TradeStation.com for full details on the costs and fees associated with options.
Margin trading involves risks, and it is important that you fully understand those risks before trading on margin. The Margin Disclosure Statement outlines many of those risks, including that you can lose more funds than you deposit in your margin account; your brokerage firm can force the sale of securities in your account; your brokerage firm can sell your securities without contacting you; and you are not entitled to an extension of time on a margin call. Review the Margin Disclosure Statement at www.TradeStation.com .
TradeStation Securities, Inc. and TradeStation Technologies, Inc. are each wholly owned subsidiaries of TradeStation Group, Inc., both operating, and providing products and services, under the TradeStation brand and trademark. When applying for, or purchasing, accounts, subscriptions, products and services, it is important that you know which company you will be dealing with. Visit www.TradeStation.com for further important information explaining what this means.
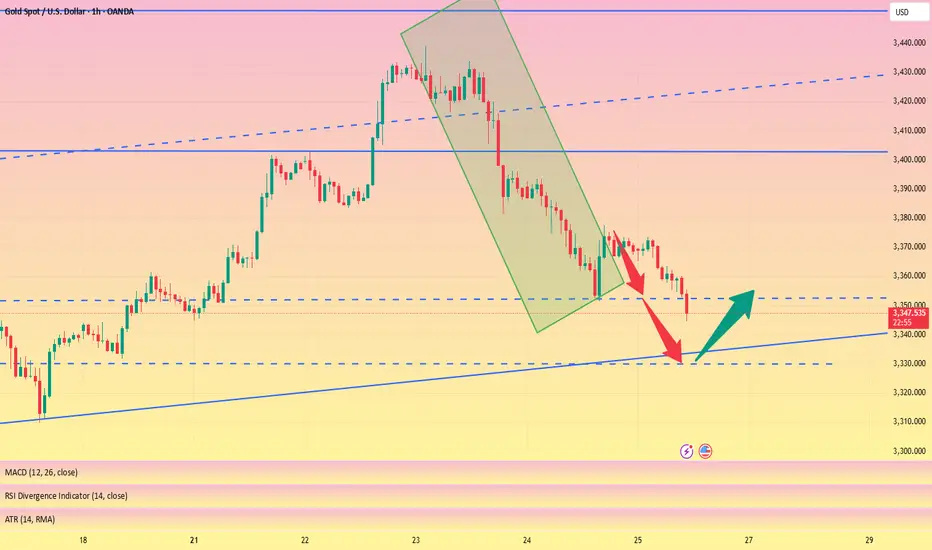
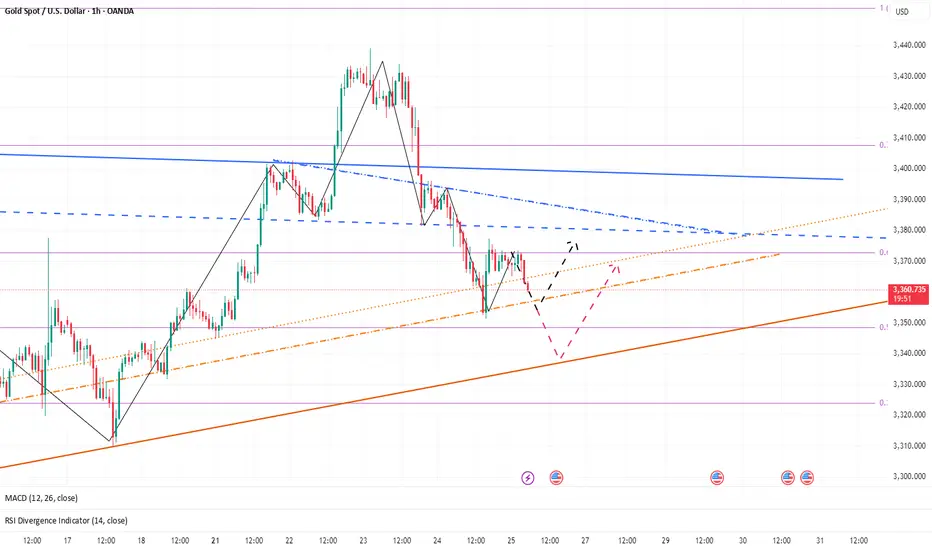
Gold Softens — Watching for a Tactical Long OpportunityYesterday, gold hit a low of around 3351 and then began to rebound. During the rebound, it hit a high of around 3377 and then retreated again. We can clearly see that below 3400, gold is still weak overall, and even failed to reach 3380 during the rebound. In the short term, the 3380-3390 area has become an obvious resistance area.
Yesterday, gold rebounded after dropping to around 3351. Whether the support near 3350 is effective has not been verified again, so from a technical perspective, gold still has the need to retreat again and test the support near 3350. Once gold falls below the area when testing the support near 3350, gold may continue to fall to the 3335-3325 area.
Therefore, in today's trading, the focus is still on shorting gold, supplemented by trying to go long on gold with the support.
1. Consider shorting gold in the 3380-3390 area, TP: 3365-3355;
2. Consider going long gold in the 3355-3345 area, TP: 3365-3375; strictly set SL
3. If the 3355-3345 area is broken, try to go long gold again in 3335-3325, TP: 3360-3370
XAU/USD Buy Setup – Trendline + Support ConfluenceReasons for Possible Buy:
Price is sitting on a rising trendline acting as dynamic support.
Strong horizontal support zone previously acted as demand.
Signs of a potential bullish reaction or bounce after extended downside.
Trade Plan:
Looking for bullish confirmation (candle structure or momentum shift) around this level.
If confirmed, potential targets:
First target: $3,365–$3,380
Second target: $3,431
🔹 Invalidation: Clean break below $3,320 zone or trendline support would invalidate the setup.
This is a high-reward area if buyers step in again like they did previously. Patience for confirmation is key before executing.

USDJPY: Confirmed CHoCH & Bullish OutlookI spotted a confirmed Change of Character on 📈USDJPY on 4-hour timeframe.
The market, currently in a global bullish trend, has effectively broken through a minor bearish trend and surpassed a key horizontal resistance level.
It is likely to continue rising, with the next resistance at 149.00.

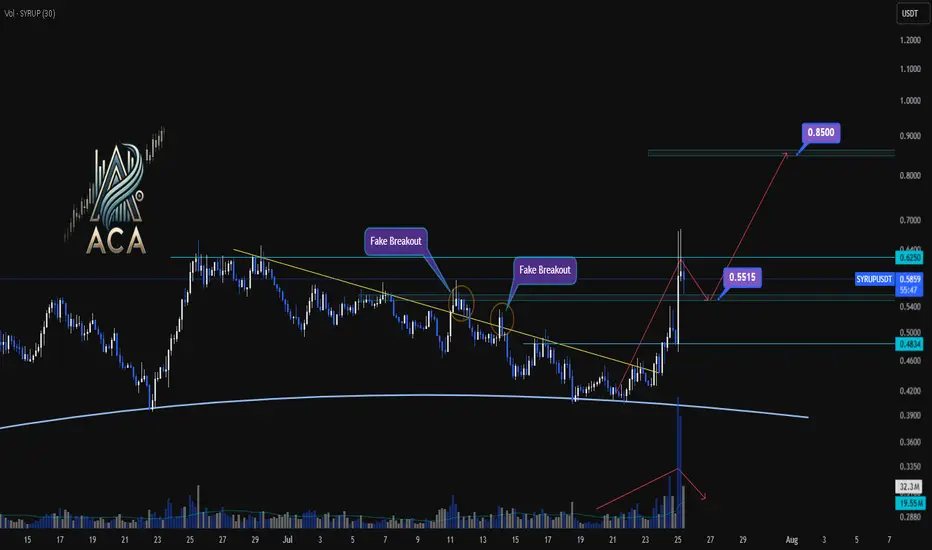
SYRUPUSDT 4H Chart Analysis | Trendline Breakout & Next MovesSYRUPUSDT 4H Chart Analysis | Trendline Breakout & Next Moves
🔍 Let’s break down the latest action on the SYRUP/USDT 4H chart and pinpoint what comes next as trend and momentum cues line up for traders.
⏳ 4-Hour Overview
- The recent breakout above the key trendline was backed by a surge in volume, providing clear momentum confirmation and pushing price toward resistance.
- Price has already reached 1.5R of the initial breakout target, a strong sign the trend is in motion.
- Upon touching the $0.6250 resistance, momentum cooled, with volatility decreasing — a classic consolidation phase after a high-energy move.
🔻 Correction & Structure
- With volume subsiding and momentum slowing post-$0.6250, we’re now expecting a corrective move down toward $0.5515.
- This retracement zone will be critical to watch for higher low formation – a bullish structural signal if supported by volume confirmation.
🔺 Long Setup:
- Should SYRUP reclaim and break above $0.6250 after setting a higher low at $0.5515, and with renewed volume, we could see another strong leg higher.
- The next major resistance sits around $0.85 — this aligns as a logical upside target based on the range extension.
📊 Key Highlights:
- Trendline breakout with sharp volume spike = momentum confirmation.
- 1.5R reached before first deep pullback; structure remains bullish above $0.5515.
- Watch for a higher low and subsequent break of $0.6250 with volume to confirm the next move to $0.85.
🚨 Conclusion:
SYRUP’s chart is at a pivotal juncture: a constructive pullback to $0.5515 could set up the next wave higher if supported by volume. A confirmed breakout above $0.6250 targets $0.85 — stay patient and wait for volume signals at key levels.
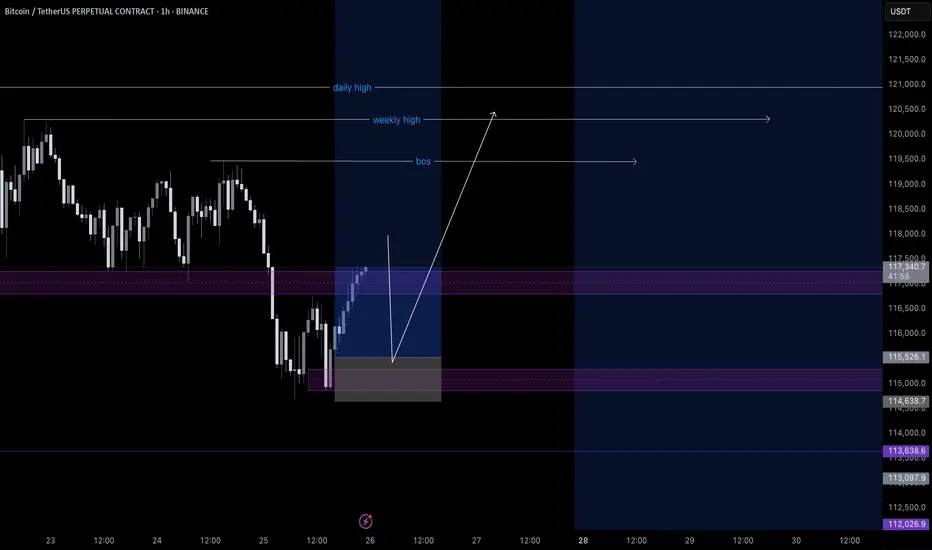
BITCOIN (BTCUSD): Recovery Starts
Bitcoin is going to rise from a key daily support.
After a liquidity grab, the market shows a clear strength,
forming a double bottom on an hourly time frame.
I expect a bullish movement at least to 117100
❤️Please, support my work with like, thank you!❤️
I am part of Trade Nation's Influencer program and receive a monthly fee for using their TradingView charts in my analysis.

EURJPY: Correction is Over?!It seems like 📈EURJPY has finished consolidating within a broad horizontal channel on the 4H chart.
The formation of a new higher high today suggests potential upward movement.
Since it's Friday, I recommend considering trend-following buys starting Monday.
We should wait for the market to close above the highlighted resistance to establish a Higher Close on the daily chart.
Look to buy after a pullback, targeting 174.00 as the initial goal.

AUDJPY: Strong Bearish Signal?! 🇦🇺🇯🇵
AUDJPY may retrace from a key daily resistance.
As a confirmation, I see a bearish breakout of a support line of a rising
wedge pattern with a high momentum bearish candle.
Goal - 96.47
❤️Please, support my work with like, thank you!❤️
I am part of Trade Nation's Influencer program and receive a monthly fee for using their TradingView charts in my analysis.

Trend corrected, long funds reduced, sellers returned#XAUUSD
The current moving average is still spreading downward, and the 4-hour chart closed with a large negative line. The market has not yet given a clear feedback on the current trend. However, after a large amount of buying funds intervened, the gold price hit a high of around 3377 and then stagnated. The short-term bullish momentum has weakened, and there is a certain risk of a correction and decline. Sellers are beginning to return📉.
Currently, you can consider participating in short selling at 3370-3377💡. If it rebounds directly to 3400-3405, you can still short if it does not break🔍. The target is 3360 below, and 3350 or even 3330 if it breaks🎯.
🚀 SELL 3370-3377
🚀 TP 3360-3350