USD/JPY(20250724)Today's AnalysisMarket news:
U.S. President Trump continued to lash out at the Federal Reserve on Tuesday, but seemed to back off from the remaining plan to fire Chairman Powell. "I think he's doing a bad job, but he's going to be out of office soon anyway," Trump said in an exchange with reporters at the White House. "In eight months, he'll be out of office."
Technical analysis:
Today's buying and selling boundaries:
146.60
Support and resistance levels:
147.70
147.29
147.02
146.18
145.92
145.51
Trading strategy:
If the price breaks through 146.60, consider buying in, with the first target price at 147.02
If the price breaks through 146.18, consider selling in, with the first target price at 145.92
Candlestick Analysis

PLTR moving higherPLTR expected to move higher.
The price is bouncing off the 20MA and respecting it.
Making new higher/highs and higher lows.
Earnings is due shortly, which could have a negative impact to the price.
However, the long term outlook for the company is still strong.
Anyone else have thoughts on this stock?

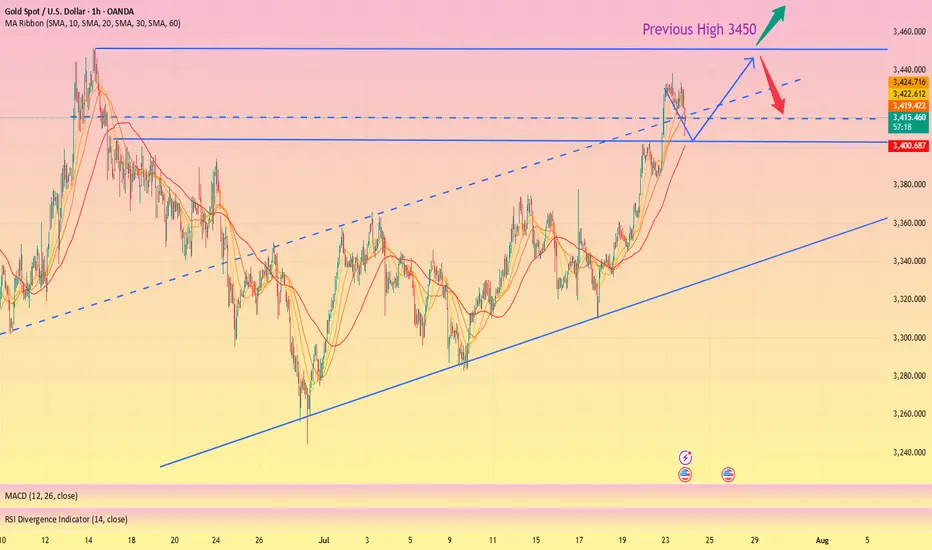
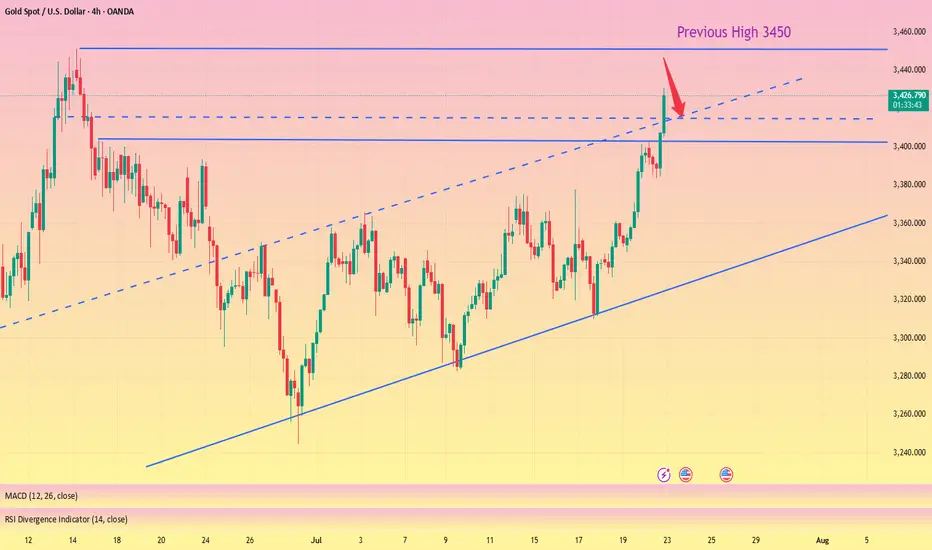
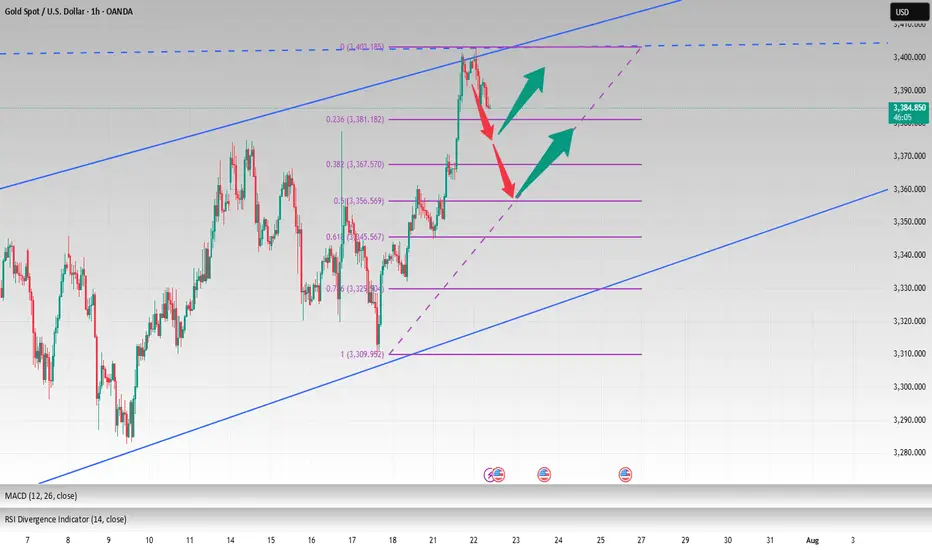
Perfect profit on short position, long TP 3450#XAUUSD
Gold is in an upward trend from the daily chart. From the technical indicators, the SMA5-SMA10 moving averages are golden crosses, BOLL opens upward, the K line runs on the upper track of the daily Bollinger Band, and the MACD continues to increase, indicating that the bullish trend remains unchanged📈.
The approaching August 1st tariff deadline, coupled with uncertainties such as the Federal Reserve, provide short-term support for gold🔍.
📊The current lower support is at 3410-3400. If it falls back to this level during the day, you can consider going long. Gradually check 3430 and 3440 on the upside, and pay close attention to the breakthrough of the 3450 level🏅. If it effectively breaks through 3450, gold is expected to break through the historical high. If it encounters resistance near 3450 as in the previous trend, you can consider shorting📉.
🚀BUY 3410-3400
🚀TP 3430-3440
The callback continuity is poor, and the bulls are still strong📰 News information:
1. Geopolitical situation
2. Tariff retaliation
📈 Technical Analysis:
Trump continued to lash out at the Fed, but seemed to have backed off on whether to remove Fed Chairman Powell. The continuous rise of the gold index, once close to 3440, also ushered in a new high in more than a month. Next, we need to pay attention to whether gold can reach the 3450 mark.
Judging from the daily chart, there were three times when it touched around 3450 and then fell back. If it breaks through and stabilizes above 3450 this time, the historical high of 3500 may be refreshed. If it cannot effectively break through 3450, the probability of subsequent retracement is still very high.
From the hourly chart, the bottom support is almost at 3405-3400. However, the recent rhythm belongs to the consolidation of the Asian and European sessions, the US session has begun to rise, and the risk of serious overbought data indicators is still there. This is why I told everyone in the morning that we need to be vigilant about the current rise. Waiting for a pullback to go long is relatively more stable. I also explained in the morning that if it falls below 3405-3400, the decline may continue to around 3385. After all, the fundamental purpose of our trading is to make a profit, so we must minimize the foreseeable risks to the greatest extent possible.
On the whole, if there is an obvious stop-loss signal at 3405-3400, you can consider going long and looking at 3450. Once it falls below 3400, don't chase it easily, and pay attention to the possibility of a retracement below 3385.
🎯 Trading Points:
BUY 3405-3400
TP 3440-3450
In addition to investment, life also includes poetry, distant places, and Allen. Facing the market is actually facing yourself, correcting your shortcomings, facing your mistakes, and exercising strict self-discipline. I share free trading strategies and analysis ideas every day for reference by brothers. I hope my analysis can help you.
FXOPEN:XAUUSD OANDA:XAUUSD FX:XAUUSD FOREXCOM:XAUUSD PEPPERSTONE:XAUUSD TVC:GOLD
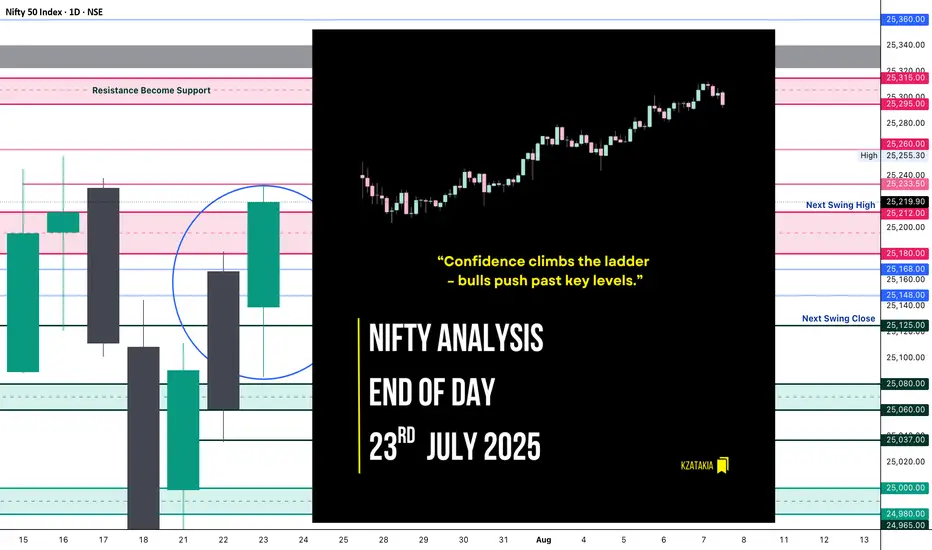
Nifty Analysis EOD – July 23, 2025 – Wednesday 🟢 Nifty Analysis EOD – July 23, 2025 – Wednesday 🔴
“Confidence climbs the ladder – bulls push past key levels.”
Nifty opened with a Gap Up of 78 points and initially retraced 54 points, finding solid footing around the CPR Zone. Once reclaimed VWAP, the index climbed in a methodical, low-volatility uptrend, breaking one resistance after another: CDH, R1, 25150, PDH, and the key zone 25200~25212 — finally touching the anticipated resistance at 25333, and closing just below that at 25219.90, close to the day’s high.
📌 Flashback from Yesterday's Note:
“If this is truly a retracement, 25K must hold in upcoming sessions, and bulls will need to reclaim 25,200 to regain their grip.”
👉 This expectation played out to perfection today — gradual yet confident bullish strength led Nifty to reclaim 25200 and close above it.
🔍 Today’s close of 25220 is higher than the last 7 sessions, suggesting a bullish shift in structure. However, bulls now face the real test — breaching the 25300 ~ 25350 resistance zone.
🕯 5 Min Time Frame Chart with Intraday Levels
🕯 Daily Time Frame Chart with Intraday Levels
🕯️ Daily Candle Breakdown
Open: 25,139.35
High: 25,233.50
Low: 25,085.50
Close: 25,219.90
Change: +159.00 (+0.63%)
Candle structure analysis:
Real body: Green body = 80.55 pts → strong bullish body
Upper wick: 13.60 pts → very small
Lower wick: 53.85 pts → moderate
Candle Interpretation:
The session opened stable, dipped to 25,085, but strong buyers showed up, helping price climb throughout the day and close near high. A firm green candle, signaling buyers in control.
Candle Type:
A Bullish Marubozu–like candle, not perfectly clean but represents strong continuation momentum.
Key Insight:
Close above 25200 confirms a bullish grip
If price holds above 25220–25250, next push could be towards 25280–25330
Immediate support now moves to 25,120–25,140
🛡 5 Min Intraday Chart
⚔️ Gladiator Strategy Update
ATR: 181.35
IB Range: 64.35 → Medium
Market Structure: Balanced
Trades Triggered:
⏱️ 10:45 AM – Long Entry → Trailing SL Hit (1:2.65 RR)
🔁 Support & Resistance Levels
Resistance Zones:
25,180 ~ 25,212
25,233
25,260
25,295 ~ 25,315
25,340 ~ 25,322 (Gap Zone)
Support Zones:
25,168
25,125
25,080 ~ 25,060
25,037
🧠 Final Thoughts
“Momentum is not magic—it’s built one level at a time.”
Bulls showed strength with control and consistency today. With 25200 reclaimed, they now hold the ball — next challenge lies at the gates of 25300–25350. Will they break through or pause for breath? Tomorrow holds the answer.
✏️ Disclaimer:
This is just my personal viewpoint. Always consult your financial advisor before taking any action.
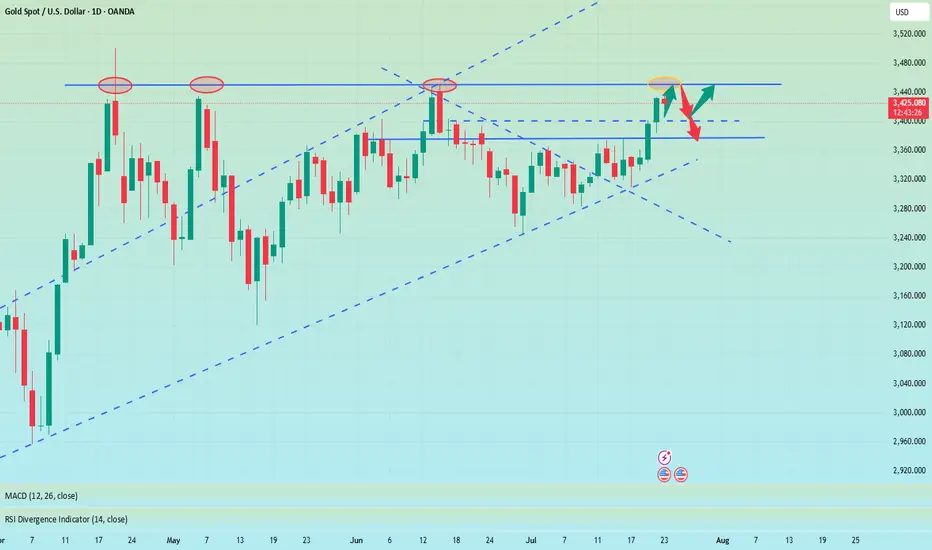
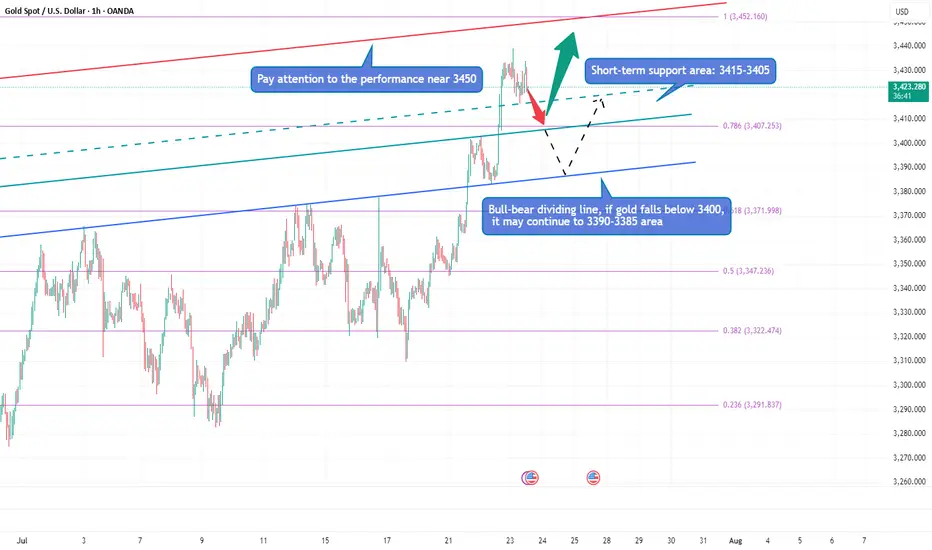
Gold is surging, can it hit 3500?Due to the trade tensions caused by tariffs and the continued conflict between the White House and the Federal Reserve, gold continued to rise, and the current highest has reached around 3438. Obviously, after gold rose strongly and broke through the 3400 and 3420 areas, the bullish sentiment of gold has been ignited. Next, we need to pay attention to whether gold can test and stand firm at 3450.
Gold is currently extremely strong, and there is basically no room for retracement during the rise. As gold rises, the short-term support below has also moved up to the 3415-3405 area; and the upper side needs to pay attention to the breakthrough of the 3450 mark. If gold continues to break through 3450, then gold has the potential to challenge 3500 again; however, if gold still cannot effectively break through when it touches the area near 3500 again, the sentiment of gold cashing out and leaving the market may be stimulated, resulting in gold There may be room for retracement in the short term. If gold falls below 3400 during the retracement, the decline may continue to the 3395-3385 area.
Therefore, for the next short-term trading, we can first wait for the opportunity for gold to pull back, and then consider going long on gold with the 3415-3405 area as support; if gold does not give a chance to pull back, then when gold first touches the area around 3440-3450, we can consider starting to short gold.
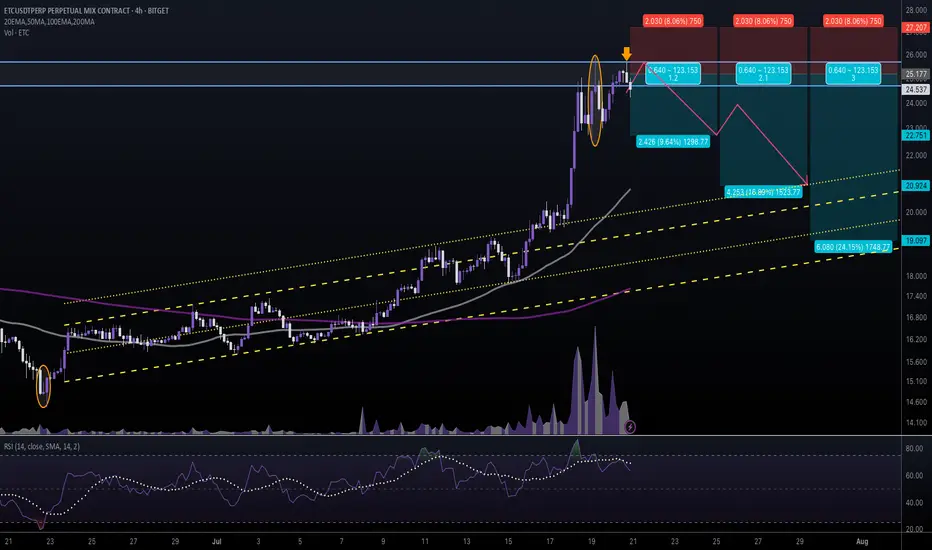
#ETCUSDT #4h (Bitget Futures) Ascending channel retestEthereum Classic printed two evening stars in a row, looks locally topped and ready for correction towards 50MA & 200MA supports.
⚡️⚡️ #ETC/USDT ⚡️⚡️
Exchanges: Bitget Futures
Signal Type: Regular (Short)
Leverage: Isolated (5.0X)
Amount: 5.0%
Entry Zone:
24.679 - 25.675
Take-Profit Targets:
1) 22.751
2) 20.924
3) 19.097
Stop Targets:
1) 27.207
Published By: @Zblaba
CRYPTOCAP:ETC BITGET:ETCUSDT.P #4h #EthereumClassic #PoW #L1 ethereumclassic.org
Risk/Reward= 1:1.2 | 1:2.1 | 1:3.0
Expected Profit= +48.2% | +84.5% | +120.7%
Possible Loss= -40.3%
Estimated Gaintime= 1-2 weeks
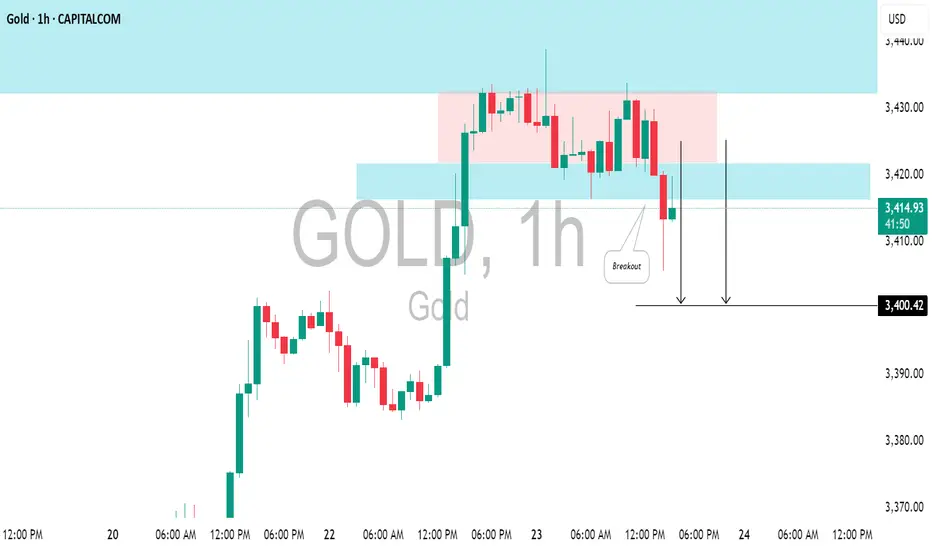
GOLD(#XAUUSD): Pullback From Resistance ConfirmedGOLD could retreat from the highlighted resistance level.
I observed a horizontal trading range pattern following a test of significant intraday resistance, along with a breach of its support level marked by a strong bearish candle.
Target - 3400.
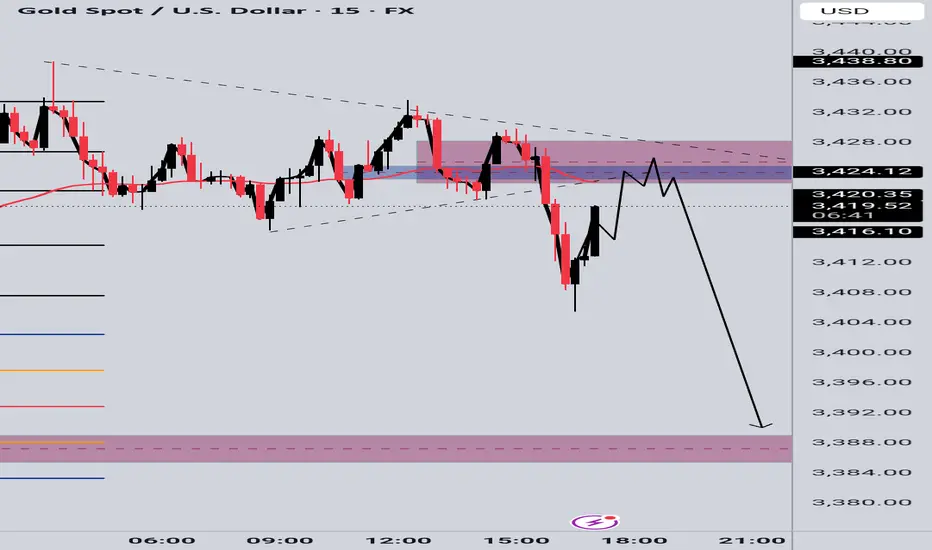
GOLD SELL SETUPWe failed the bullish momentum on previous chart ,now aiming for the continuation to the downside;
🔹 Entry Zone: 3425–3430 (Supply Rejection)
🔸 Trendline Break + Liquidity Sweep Confirmed
🎯 Targets:
— TP1: 3410
— TP2: 3388 (Major Demand Zone)
🔒 Bearish momentum building, watching for continuation toward the lower zone.
NZDUSD: Time For Pullback 🇳🇿🇺🇸
I think that NZDUSD will retrace from the underlined resistance.
As a confirmation, I spotted a bearish imbalance candle on an hourly time frame
after its test.
There is a high chance to see a retracement.
Goal - 0.602
❤️Please, support my work with like, thank you!❤️

Gold breaks new high, expect a pullback in the evening#XAUUSD
After the rapid rise of the previous day, the gold market has fallen into an overbought state, but yesterday's increase of nearly $60 still provided solid support for the bulls. It is expected that the market will show repeated fluctuations in the future⚖️.
In terms of operation, it is recommended to pay close attention to the gains and losses of the 3,400 mark. If it is successfully broken through, it is expected to further test the 3,420-3,425 and 3,450 lines; on the downside, pay attention to the top and bottom conversion support of 3,403📈.
📊At present, you can consider shorting near 3430, defending 3440, and aiming at 3410💡
🚀SELL 3430-3440
🚀TP 3415-3405
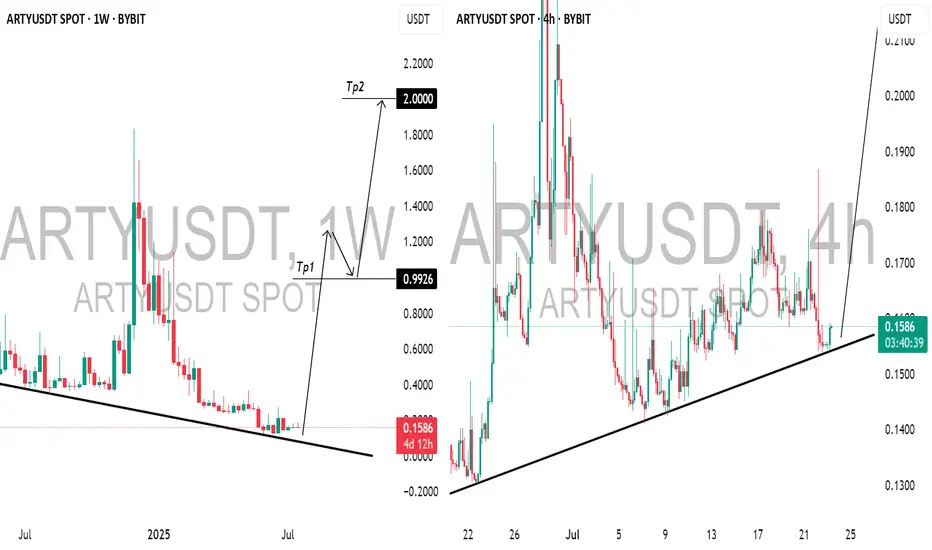
ARTFACT (ARTYUSDT): Bullish Outlook ExplainedThis morning, while analyzing 📈ARTY on a weekly chart, I noticed a promising bullish signal following a test of a falling trend line.
The price has been adhering well to a rising trend line on the 4-hour chart, and after a recent test, we observed a positive bullish reaction, prompting me to enter a long position.
Recently, early investors took profits from three years of staking, alleviating sell pressure. Additionally, Artyfact has introduced its first Play-and-Earn mode, which is expected to attract hundreds of thousands of new players.
This surge in interest will likely increase the demand for AMEX:ARTY and drive up its price, as players can only purchase gaming NFTs using $ARTY.
I believe the price has good potential to rise to 1.00 then to 2.00 soonest.
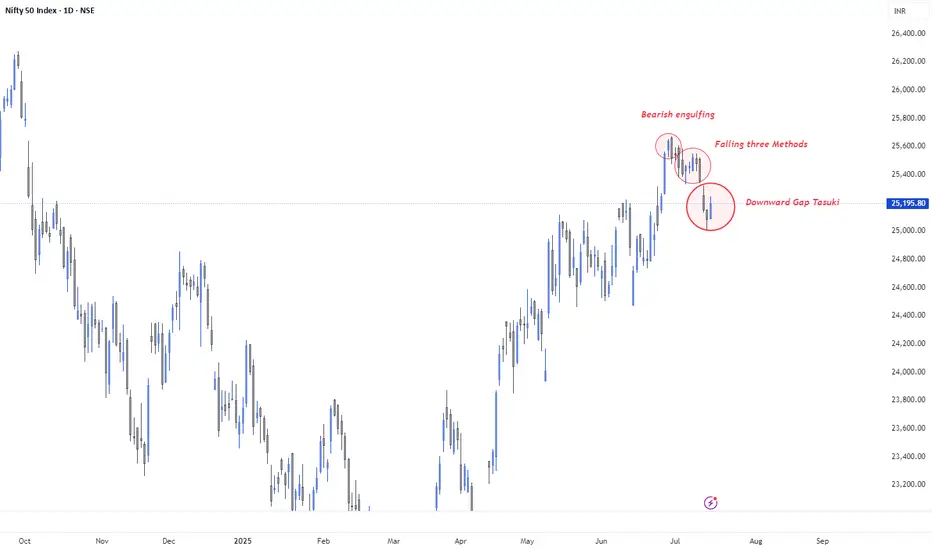
Candlestick Confluence: Bearish Signals in a Bullish Trend🔹 30 June – Bearish Engulfing
A large bearish candle fully engulfed the prior bullish day, forming at new highs (~25,790). Classic sign of distribution after an extended uptrend. This marked the beginning of the current corrective leg.
🔹 3 to 10 July – Falling Three Methods
After the initial drop, price consolidated in a tight range. Three small-bodied candles (4–9 July) signaled indecision. On 10 July, a strong bearish continuation candle confirmed the Falling Three Methods pattern — strengthening the downside move.
🔹 15 July – Downward Gap Tasuki
A bearish gap formed between 12–14 July. On 15 July, a small bullish candle emerged but failed to fill the gap — forming a Downward Gap Tasuki, a bearish continuation pattern. While this is typically a trend-continuation signal, it's forming within a primary uptrend, making follow-through uncertain.
🧠 Trend Context: Bullish Dominance Meets Short-Term Exhaustion
Despite these bearish candlestick formations, the broader trend from April remains structurally bullish. This confluence of reversal + continuation signals indicates:
Controlled profit-booking at highs
Low conviction from bulls near resistance
Possible mid-trend correction, not a trend reversal (yet)
🔎 Key Technical Levels to Watch
📉 Support Zones:
25,050: Immediate swing low (14 July)
24,850: Prior breakout zone
24,600: Horizontal support from mid-June
📈 Resistance Zones:
25,300 – 25,350: Gap resistance from 12–15 July
25,500: Key rejection zone from recent highs
25,650 – 25,700: All-time highs
⚠️ Market Psychology
Bulls are still in control on the higher timeframe, but the emergence of strong bearish patterns suggests hesitation at the top.
With Indian CPI easing and RBI’s neutral stance, macro still supports the bullish narrative — but the technical structure is flashing red flags in the short term.
🧾 Conclusion
"Nifty Spot has printed a sequence of reliable bearish candlestick formations — Bearish Engulfing (30 June), Falling Three Methods (3–10 July), and Downward Gap Tasuki (15 July). While these indicate short-term pressure, the broader uptrend remains intact. A close below 25,050 could trigger a deeper correction to 24,850–24,600. Bulls need to decisively reclaim 25,400+ to nullify the bearish setup and resume the uptrend."
#Nifty50
#NiftyAnalysis
#NiftyTechnicalAnalysis
#NSEIndia
#IndianStockMarket
#BearishEngulfing
#FallingThreeMethods
#TasukiGap
#CandlestickPatterns
#PriceAction
Simple Swing Trading Strategy with Smart Money Concept Explained
I will share with you the essential basics of swing trading forex gold with Smart Money Concepts.
You will learn how to do swing trading with the best SMC strategy.
I will teach you to c ombine order blocks, liquidity zones and imbalances to spot accurate entries and confirmation signals.
If you just started learning swing trading Forex with Smart Money Concepts, I strictly recommend trading with the trend only.
The cases and examples that we will discuss will be strictly trend-following ones.
Swing Trading with SMC in Uptrend
For swing buying any forex pair, we will look for the market that is trading in a bullish trend.
To confirm that the market is rising, you will need to execute structure mapping and find a forex pair that updates Higher Highs HH and Higher Lows HL.
Above is the example how I confirmed that GBPUSD is bullish with structure mapping. You can see that the pair consistently updates the highs.
Once you identified a bullish pair, your next step will be to find the zone from where the next swing move will follow.
According to the rules, the market remains in uptrend till the price is staying above or on the level of the last Higher Low HL.
Here is such a zone on GBPUSD.
It is based on the last Higher Low and current price levels.
We will assume that buying orders will concentrate within that area and from that a bullish rally will follow.
The problem is that this area is extremely wide, and we can not just buy randomly within.
Our next step will be to find liquidity zones within.
To buy, we need demand areas.
I found 4 price action based historic demand zones on GBPUSD.
We will need to wait for the test of one of these zones and then wait for an order block - a place where smart money are placing their buy orders.
The problem is that we don't know in which of these areas the order block is, so we will need to wait for tests of these zones and a consequent imbalance to confirm it.
To confirm a bullish imbalance for swing trading Forex, I recommend analyzing a 4H time frame after a test of a demand zone.
According to Smart Money Concepts, a bullish imbalance can be any sign of strength of the buyers : bullish breakout of a vertical/horizontal resistance, change of character, high momentum bullish candle, bullish price action pattern, etc.
An order block on GBPUSD was confirmed with a breakout of a resistance line of a falling channel on a 4H time frame.
That was the signal that Smart Money are buying, and that is your signal to open a swing long trade.
You place a buy position then with a stop loss below the order block and a target - at least a current high.
Swing Trading with SMC in Downtrend
For swing selling any forex pair, you will need to find a market that is trading in a bearish trend.
I suggest applying structure mapping to identify such a pair.
It simply should update Lower Lows LL and Lower Highs consistently.
USDCAD is trading in a bearish trend.
Structure mapping helps to easily confirm that.
Then, we will need to identify the zone from where the next bearish wave will start.
According to Smart Money Concepts structure mapping rules, the market remains bearish till the price is staying below or on the level of the last Lower High LH.
That's such a zone on USDCAD.
It is based on current prices and the last Lower High.
We will assume that selling orders will be distributed along the entire lenth of our zone.
Of course, we can not sell randomly within that zone because it is relatively extended.
Our next task will be to find liquidity supply zones within.
I found 2 price action based supply zones within our underlined area.
Before we sell, we will need to find an order block.
A place from where smart money are selling big.
To spot that, I suggest waiting for a test of one of our supply zones and wait for a bearish imbalance on a 4H time frame.
According to SMC, a bearish imbalance can be a bearish high momentum candle, a bearish CHoCH, a bearish price action pattern, a bearish breakout of a horizontal/vertical support , etc.
You can see that a lower supply zone was tested on USDCAD.
Our bearish order block confirmation is a bearish Change of Character, a formation of a high momentum bearish candle and a breakout of a rising trend line.
After that we can open a swing sell position and expect a bearish movement at least to a current low.
Stop loss should lie strictly above the order block.
TP should be at least a c urrent low.
That is how a trade should be executed on USDCAD pair.
Remember that there is no guarantee that the order block will be within a liquidity zone. You should learn to track the signs of smart money and their operations.
A proper combination of a trend analysis, liquidity zones and order block is the essential basis of a profitable swing trading Forex.
Mastering that, practice recognizing the imbalances and confirmations for spotting the best swing trading entries.
❤️Please, support my work with like, thank you!❤️
I am part of Trade Nation's Influencer program and receive a monthly fee for using their TradingView charts in my analysis.
SILVER (XAGUSD): Confirmed Break of Structure
Silver updated a year's high yesterday, breaking a strong daily resistance.
With a confirmed Break of Structure BoS, we can expect that
the market will rise even more.
The next strong resistance is 40.
It is a round number based psychological level.
It can be the next goal for the buyers.
❤️Please, support my work with like, thank you!❤️
I am part of Trade Nation's Influencer program and receive a monthly fee for using their TradingView charts in my analysis

XAU/USD 23 July 2025 Intraday AnalysisH4 Analysis:
-> Swing: Bullish.
-> Internal: Bullish.
You will note that price has targeted weak internal high on two separate occasions forming a double top which is a bearish reversal pattern. This is in-line with HTF bearish pullback phase.
Remainder of analysis and bias remains the same as analysis dated 23 April 2025.
Price has now printed a bearish CHoCH according to my analysis yesterday.
Price is now trading within an established internal range.
Intraday Expectation:
Price to trade down to either discount of internal 50% EQ, or H4 demand zone before targeting weak internal high priced at 3,500.200.
Note:
The Federal Reserve’s sustained dovish stance, coupled with ongoing geopolitical uncertainties, is likely to prolong heightened volatility in the gold market. Given this elevated risk environment, traders should exercise caution and recalibrate risk management strategies to navigate potential price fluctuations effectively.
Additionally, gold pricing remains sensitive to broader macroeconomic developments, including policy decisions under President Trump. Shifts in geopolitical strategy and economic directives could further amplify uncertainty, contributing to market repricing dynamics.
H4 Chart:
M15 Analysis:
-> Swing: Bullish.
-> Internal: Bullish.
H4 Timeframe - Price has failed to target weak internal high, therefore, it would not be unrealistic if price printed a bearish iBOS.
The remainder of my analysis shall remain the same as analysis dated 13 June 2025, apart from target price.
As per my analysis dated 22 May 2025 whereby I mentioned price can be seen to be reacting at discount of 50% EQ on H4 timeframe, therefore, it is a viable alternative that price could potentially print a bullish iBOS on M15 timeframe despite internal structure being bearish.
Price has printed a bullish iBOS followed by a bearish CHoCH, which indicates, but does not confirm, bearish pullback phase initiation. I will however continue to monitor, with respect to depth of pullback.
Intraday Expectation:
Price to continue bearish, react at either M15 supply zone, or discount of 50% internal EQ before targeting weak internal high priced at 3,451.375.
Note:
Gold remains highly volatile amid the Federal Reserve's continued dovish stance, persistent and escalating geopolitical uncertainties. Traders should implement robust risk management strategies and remain vigilant, as price swings may become more pronounced in this elevated volatility environment.
Additionally, President Trump’s recent tariff announcements are expected to further amplify market turbulence, potentially triggering sharp price fluctuations and whipsaws.
M15 Chart:

3400 has been reached, wait patiently for a pullback to go longGold opened on Monday with a volatile rise. After breaking through the 3360-65 area, the bulls turned strong. After breaking through the 3375~80 area in the evening, the bulls accelerated their rise, reaching the highest point of 3402. It fluctuated sideways in the late trading, and the daily line closed at around 3397 with a big positive line! Gold temporarily broke the small range oscillation pattern, but the bulls were not strong, and it still fluctuated upward.
From the perspective of the intraday cycle, after yesterday's rapid rise, the market fell into a serious overbought state; however, yesterday's $60 big positive line supported the bulls, and it is expected that the market will fluctuate; the next focus is still the 3400 mark area. The pressure in the 3400~05 area was dense last night, and adjustments may be made at any time before the breakthrough; and since the rise of 3282, it has just touched the upper edge of the parallel channel. The big sweep will continue, but the range is constantly changing!
So although gold broke the recent volatility yesterday and hit the 3400 mark with a big positive line; however, if it cannot stand above it, then it will continue to fall; recently we have repeatedly and many times emphasized the importance of the 3400 mark. If it stands here, the market will gradually rise to 3420~25 and break through to the 3450 area before looking for a decline.
Today we will continue to focus on the 3400 mark area. First, we will rush to the high altitude, with the goal of retracement to the 3375 and 3356 regional support platforms, and then pay attention to long opportunities; if the bulls stand above the 3400 mark, they will further bullishly impact 3420~25 and break through the 3450 area before falling back.
OANDA:XAUUSD
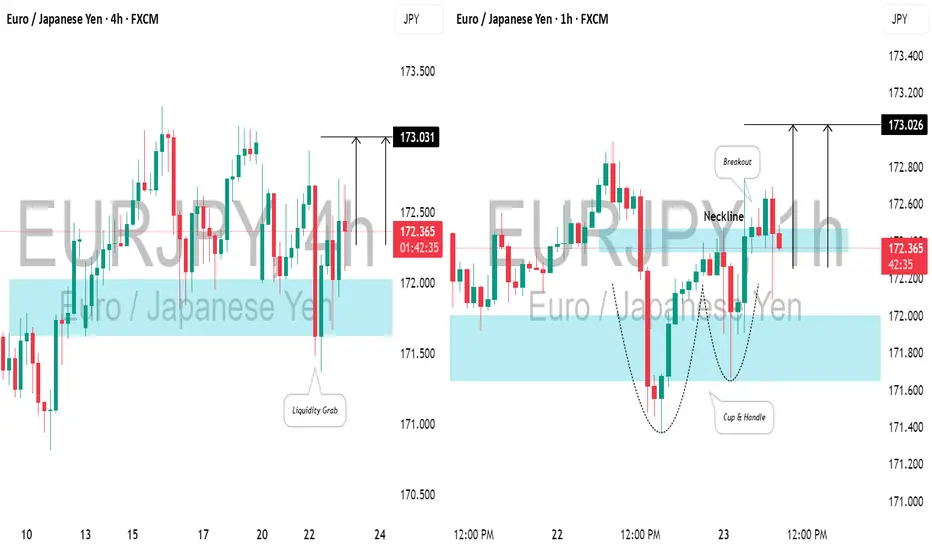
EURJPY: Bullish Move After Liquidity Grab📈EURJPY created a bearish high-range candle beneath a crucial support level in a horizontal trading range on the 4-hour chart.
However, a subsequent recovery and a bullish opening in the Asian session indicate a strong likelihood of an upward movement today, targeting 173.00.
AUDUSD Long - A BreakdownAfter a thorough breakdown, I decided to enter longs on AUD/USD. I expect for price to reach highs of around .65898 Which is the daily structure high Currently in profit On a long position and We entered on the 5 minute using a one hour stop loss Hopefully this trade continues to play out, and we'll see you on the other side of profit.

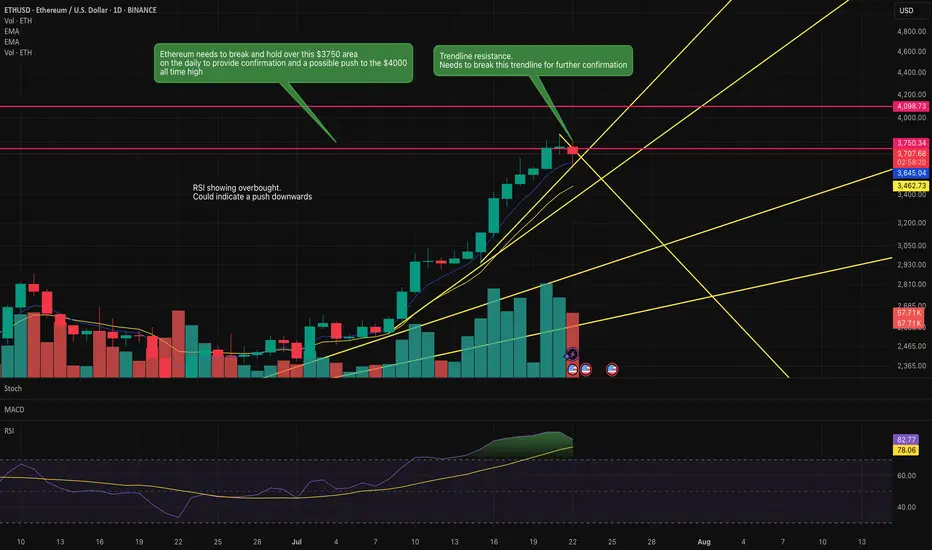
Is Ethereum going to push above this key resistance?Ethereum is knowcking against this key resistance area.
If it pushes above this $3750 area then it has a clear run to the previous all time highs of $4000.
RSI indicates overbought so it could indicate a reversal to the downside.
Key trendline is being honoured currently. However, a break of this trendline may indicate the move upwards to the previous all time high.
Watch this space over the next couple of days.
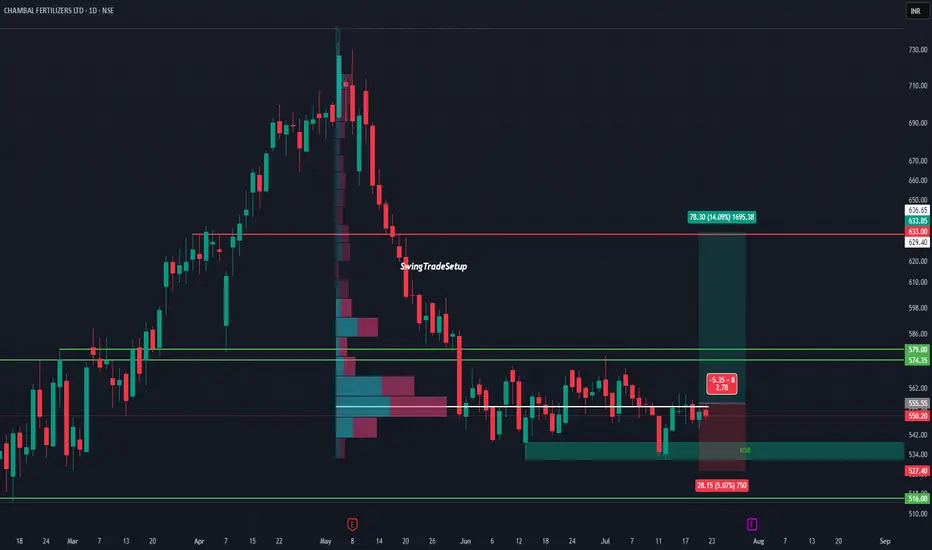
CHAMBAL FERTILISERS LTD – Potential Bottoming Out‽CHAMBAL at Demand Zone | Volumes story
After a steep fall from 730 to 516, Chambal is now consolidating in a critical demand zone backed by visible volume activity. This range has previously triggered price reversals, and now history might repeat.
The stock is respecting the support between 527–516, forming a potential base. On the upside, a clean breakout above ₹555.55 can unlock a near-term target of 633+, a move of over 14%.
The risk-to-reward ratio remains attractive with a tight invalidation below ₹527, while the volume profile suggests accumulation in this range.
Technical View :
• Major support: ₹516–527
• Breakout trigger: ₹555.55
• Upside target: ₹633–636
• Risk below: ₹527
• Volume profile: Dense node suggests buyer interest
Valuation :
• PE: ~10.3 (undervalued vs peers)
• Dividend Yield: ~6.5% (steady income potential)
• Promoter Holding: 60.62% (strong & stable)
• No recent equity dilution
• DII/FII: Activity neutral, could turn if technical align
A good mix of fundamentals, attractive valuation, and technical structure makes this a stock to keep an eye on. If it crosses ₹560 with volume, it may kick off a short-term trend reversal.
This chart is for educational use only and not a buy/sell recommendation.
SOL holding above the 204 on the daily could be a long positionSOL is respecting the 204 on the daily and if it holds above it, we could have a long position buying opportunity.
Upside could be too the 222 resistance line if it holds above the 204.
Sentiment seems to be good for Sol and other strong alt coins at the moment. This also supports and upside trajectory.

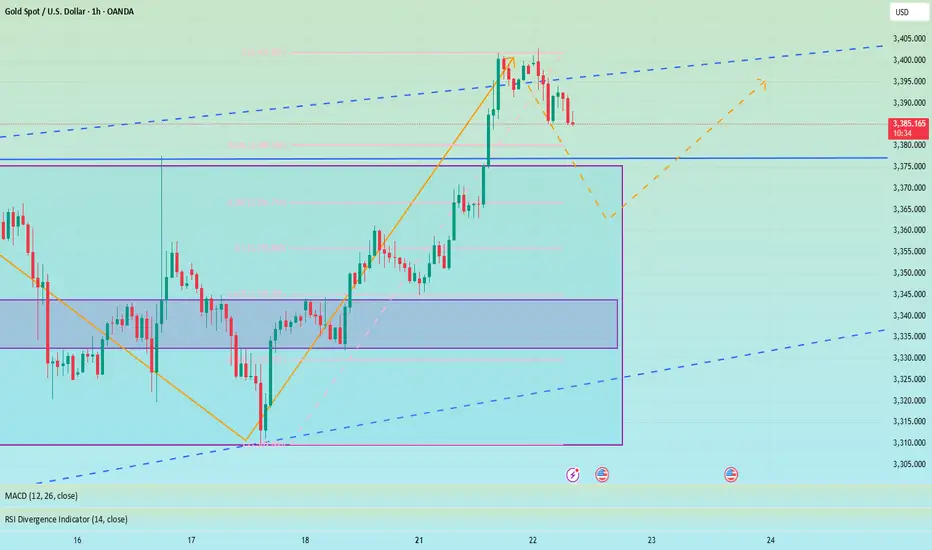
Bulls are still the main theme, 3400 is not the high point📰 News information:
1. Fed Chairman Powell delivers a welcome speech at a regulatory conference
2. The tariff deadline is approaching
📈 Technical Analysis:
Today's opening high reached around 3402, and did not effectively break through the upper resistance of 3405-3415. As I said yesterday, a decline and return to the moving average is an inevitable result. The tariff issue is still there, with the deadline on August 1, and the daily MACD indicator still shows a golden cross. The general direction of short-term bullishness has not changed, but from a technical point of view, gold still has room to fall to correct the overbought part.
Below the day, we first focus on the top and bottom conversion position of 3377-3375. As time goes by, the 4H middle track will probably resonate with the 50% position of the Fibonacci line at 3355, which is also a good long position I expect. Therefore, if the price falls back to 3380-3375 for the first time during the day, you can consider going long. If the price continues to fall, pay attention to the second opportunity to go long at 3355, with the target at 3390-3410.
🎯 Trading Points:
BUY 3380-3375
TP 3390-3410
BUY 3360-3350
TP 3370-3380
In addition to investment, life also includes poetry, distant places, and Allen. Facing the market is actually facing yourself, correcting your shortcomings, facing your mistakes, and exercising strict self-discipline. I share free trading strategies and analysis ideas every day for reference by brothers. I hope my analysis can help you.
TVC:GOLD PEPPERSTONE:XAUUSD FOREXCOM:XAUUSD FX:XAUUSD OANDA:XAUUSD FXOPEN:XAUUSD