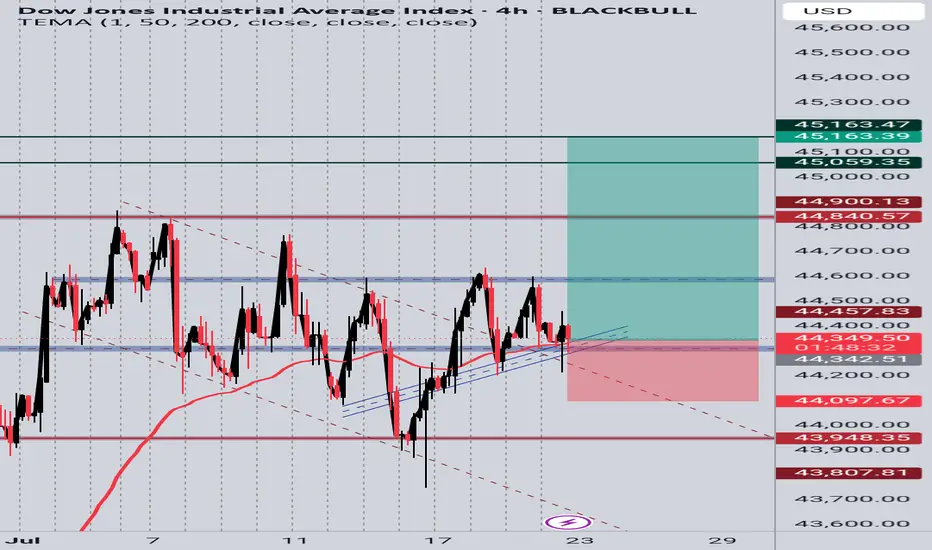
US30 4H Long SetupPrice is respecting a rising trendline and holding above a key support zone. After multiple rejections at the trendline and EMA bounce, current candle shows bullish intent. Targeting previous resistance zones around 45,059 and 45,163. SL placed below the trendline and recent structure low at 44,097. Setup based on structure support, EMA reaction, and potential bullish continuation.
Candlestick Analysis
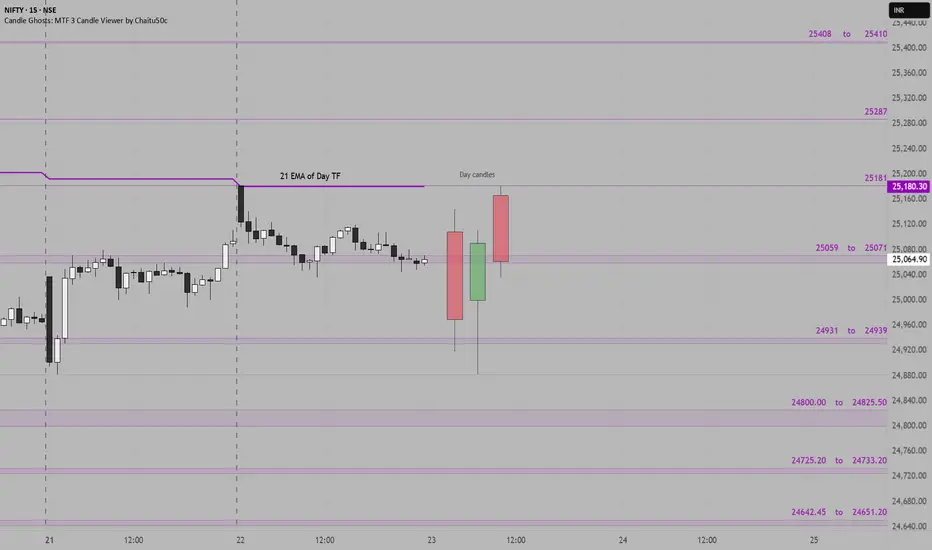
Nifty Support & Resistance Zones for 23rd July 2025The following support and resistance zones have been identified for Nifty based on recent price structure, candle reactions, and high-activity price clusters:
Resistance Zones:
25408 – 25410
25287
25181
25059 – 25071
Support Zones:
24931 – 24939
24800 – 24825.50
24725.20 – 24733.20
24642.45 – 24651.20
Yesterday Nifty formed a strong bullish day candle after testing support near 24800, showing signs of recovery. If the price holds above 25070, we may see a move toward 25181 and possibly 25287.
These levels act as potential zones of reaction and should be used with confirmation via price action or volume triggers during live market.
GBPNZD SHORT Market structure bearish on HTFs 3
Entry at both Weekly and Daily AOi
Weekly Rejection at AOi
Previous Weekly Structure Point
Daily Rejection at AOi
Around Psycholoogical Level 2.26000
H4 Candlestick rejection
Rejection from Previous structure
Levels 4.68
Entry 95%
REMEMBER : Trading is a Game Of Probability
: Manage Your Risk
: Be Patient
: Every Moment Is Unique
: Rinse, Wash, Repeat!
: Christ is King.

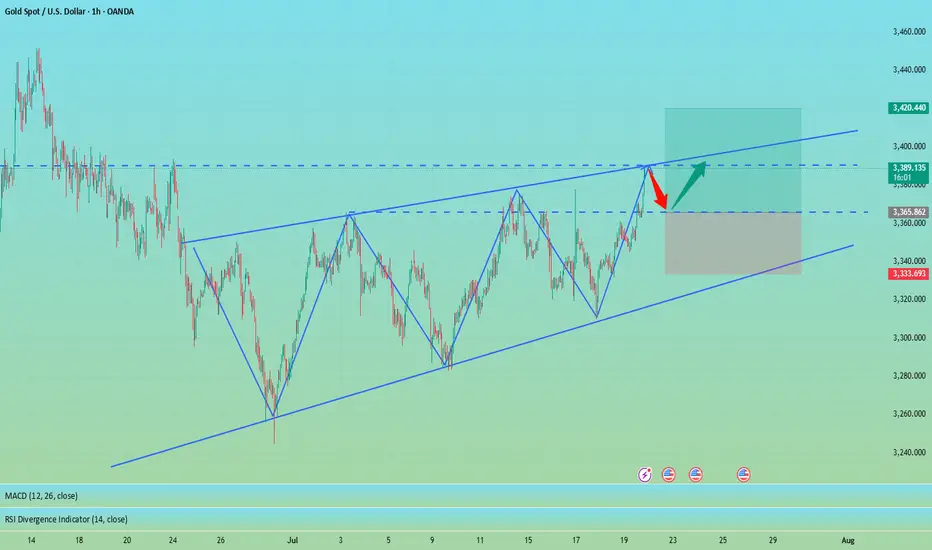
Don't chase the bullish trend,wait for the short position layout#XAUUSD
The tariff policy recently announced by the US government is undoubtedly the focus of the current gold market. Trump also tied the tariffs to the trial of former Brazilian President Jair Bolsonaro, adding to policy uncertainty. ⚖️
The implementation of the tariff policy may push up commodity prices, thereby exacerbating inflationary pressure, which is both an opportunity and a challenge for gold📊. On the one hand, rising inflation expectations may enhance the attractiveness of gold as an anti-inflation asset; on the other hand, the strengthening of the US dollar and US Treasury yields may offset this positive. 💡
At present, the lower support has moved up to the 3375-3365 area, where a top-bottom conversion position will be formed. The upper short-term resistance level is 3387-3393, the previous high. If the market touches this for the first time, you can try to see a double top fall.
🚀SELL 3385-3390
🚀TP 3365-3355
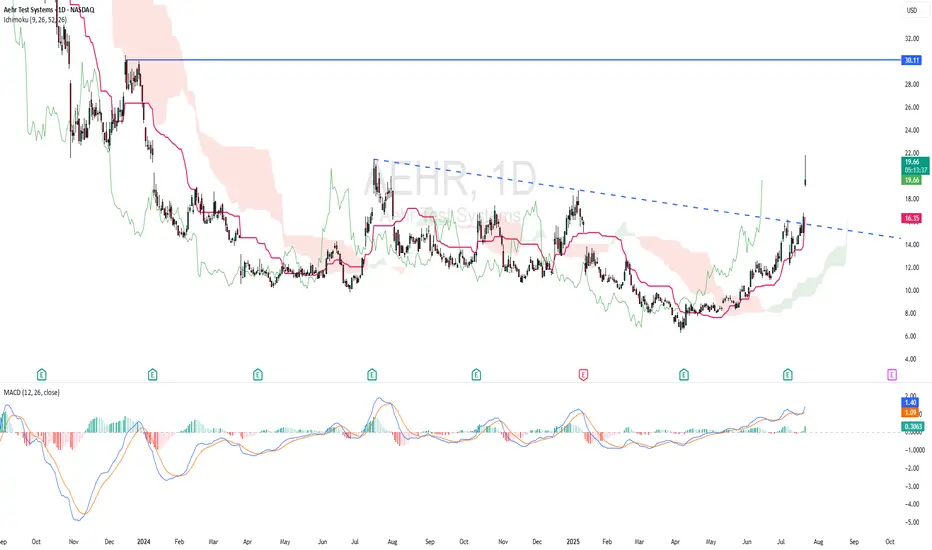
AEHR - RISING WINDOWTechnically AEHR is bullish as the stock made a strong rising window. Based on ICHIMOKU CLOUD, price is above cloud and chikou span is above candlestick - indicating bullish scenario. Kijun Sen is rising. MACD indicator showing bullish momentum.
ENTRY PRICE : 19.30 - 19.70
TARGET : 30.00 (potential almost 50% roi)
SUPPORT : 14.72
GBPUSD BUYS GU broke the previous LH and formed support. I’m waiting for price to break out of consolidation on the M15 and form more bullish pressure before entering longs towards 1.36200 area.

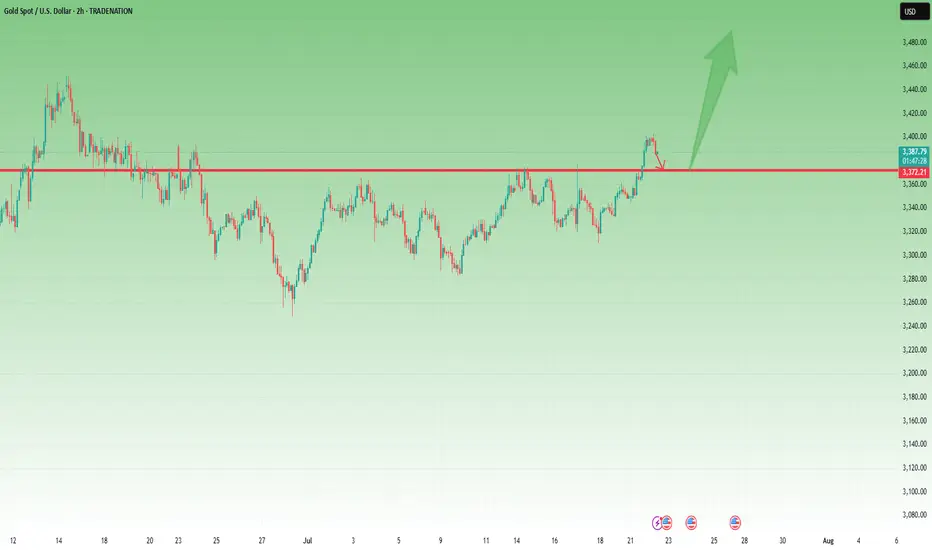
Gold - Above 3370 Is Bullish Territory – But 3360 Must Hold📆 What happened yesterday?
After more than a week of frustrating, sideways price action, Gold finally broke out above the key 3370 resistance zone.
The breakout was clean and impulsive, with TRADENATION:XAUUSD pushing to an intraday high around 3400.
Following that move, price printed a small double top near the high and began a modest correction — perfectly normal after such a breakout. At the time of writing, Gold trades at 3385, still holding above former resistance.
📈 Why this breakout matters:
The daily close at 3396 came in strong and near the top, leaving behind a clear Marubozu candle
This kind of price action signals conviction and momentum
The breakout confirms what I’ve been anticipating for days — the range is resolved, and the market is choosing the bullish path
🎯 What to expect next:
If price stabilizes above 3400, the road to 3450 opens — which is the target mentioned in my previous analyses
That area represents the next major resistance and likely magnet for price if bulls stay in control
🧭 Trading Plan:
For me, the plan is now simple:
✅ Buy the dips — especially on a potential retest of the 3370–3375 broken resistance, which now turns into support
❌ Negation comes only with a daily close below 3360, which would invalidate this breakout and raise questions
📌 Conclusion:
The breakout has finally come. After days of coiling, Gold chose the upside.
Momentum is building, structure is clean, and bulls are back in control — unless 3360 fails.
Until then, I remain bullish, looking to buy dips into strength. 🚀
Disclosure: I am part of TradeNation's Influencer program and receive a monthly fee for using their TradingView charts in my analyses and educational articles.
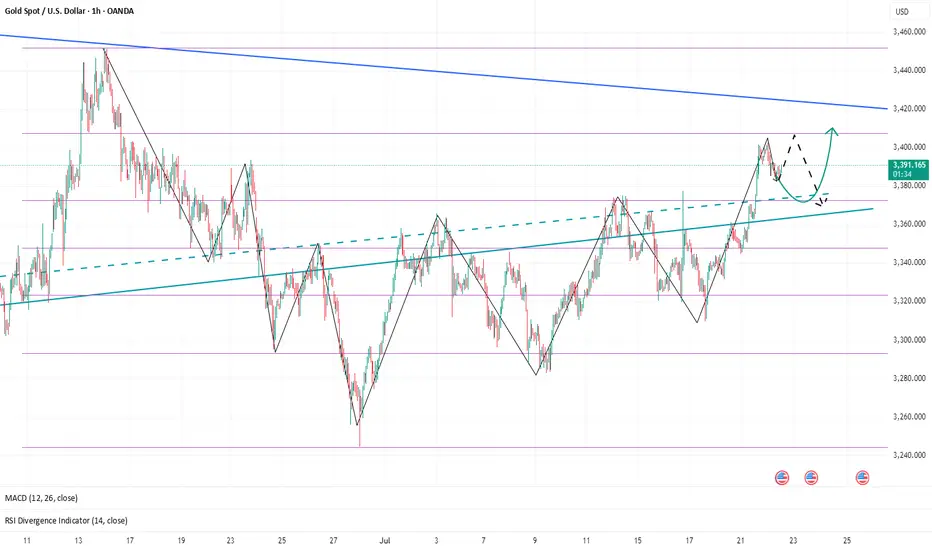
More Pain for Gold? The Charts Say It’s PossibleSince the start of the London market, gold has almost maintained a narrow range of fluctuations in the 3390-3385 area. Compared with yesterday, the market is much weaker today, and gold has failed to stabilize at 3400 several times, indicating that the sentiment of cashing out near this area is also very high. From the current gold structure, gold is obviously biased towards a long structure. Since gold broke through 3400, 3375-3365 has become the key support area after the top and bottom conversion in the short term.
However, gold rose strongly yesterday but did not stabilize at 3400. The bullish sentiment may no longer be strong. Moreover, after the accelerated rise in gold, the sustainability was not strong, so gold still needs to retreat in the short term. This is why I insisted on shorting gold again near 3400 yesterday. Therefore, I think gold has not yet retreated to the right level. I will pay attention to the opportunity to go long on gold after it pulls back to the 3375-3365 area.
Gold fell after touching 3400 twice. Whether a short-term effective "M" double top structure has been formed, I think more signals are needed to verify. However, in the short term, it is still under pressure in the 3405-3410 range, so if there is no major positive news, I think gold may maintain a wide range of fluctuations in the 3410-3360 range. Therefore, if gold rises to the 3400-3410 range again, I will continue to try to short gold!
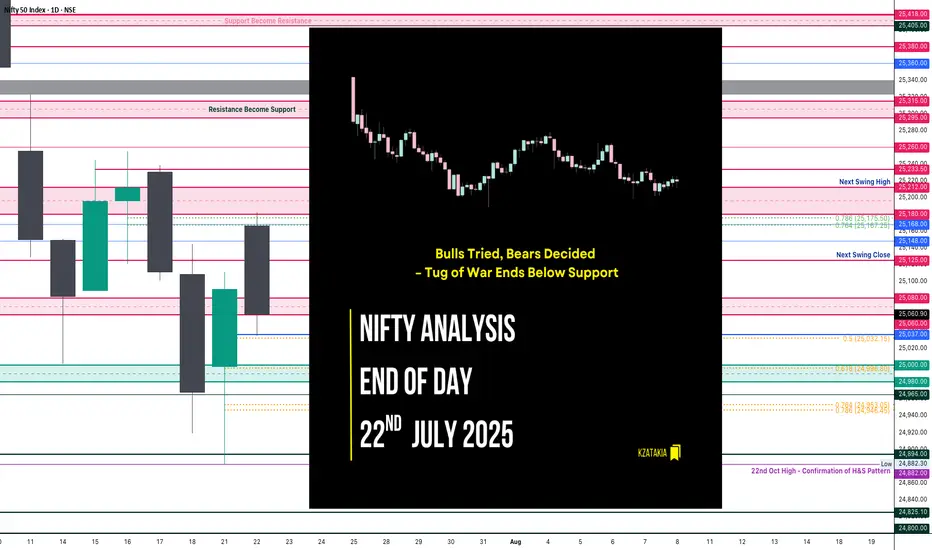
Nifty Analysis EOD – July 22, 2025 – Tuesday🟢 Nifty Analysis EOD – July 22, 2025 – Tuesday 🔴
"Bulls Tried, Bears Decided – Tug of War Ends Below Support"
Nifty opened with an 88-point gap-up, continuing the bullish sentiment, right at the resistance zone of 25,180 ~ 25,212. However, the market opened at the high (OH) and quickly slipped around 100 points to form the Initial Balance (IB). After a brief bounce back to the mean, it faced resistance, leading to a breakdown of IB and further losses of 77 points.
A supportive bounce emerged near 25,060 ~ 25,080, but the price was pushed down again by PDH + VWAP + R1. The day closed below PDC and under the support zone at 25,065, showing bearish dominance despite a volatile tug-of-war between bulls and bears.
Today’s low tested the 0.5 Fibonacci retracement level (from yesterday’s low to today’s high). If this is truly a retracement, 25K must hold in upcoming sessions, and bulls will need to reclaim 25,200 to regain their grip.
🕯 5 Min Time Frame Chart with Intraday Levels
🕯 Daily Time Frame Chart with Intraday Levels
📊 Daily Candle Breakdown
Open: 25,166.65
High: 25,182.00
Low: 25,035.55
Close: 25,060.90
Change: −29.80 (−0.12%)
Candle Structure:
Real Body: Red (−105.75 pts) → Decent bearish body
Upper Wick: 15.35 pts → Small
Lower Wick: 25.35 pts → Moderate
Interpretation:
Price opened strong but faced selling near 25,180, leading to a steady drop throughout the session. The lower wick shows some buying attempt near 25,035, but the close below open signals bears dominated.
Candle Type:
Bearish candle with moderate lower wick – resembles a Bearish Engulfing setup after a green candle, suggesting profit-booking or fresh selling.
Key Insight:
Sellers defending 25,180–25,200 firmly
Holding above 25,030–25,050 is critical; breaking this could retest 24,950–25,000
Bulls must reclaim 25,120–25,150 for momentum revival
🛡 5 Min Intraday Chart
⚔️ Gladiator Strategy Update
ATR: 182.32
IB Range: 92.6 → Medium
Market Structure: Balanced
Trades Triggered:
10:45 AM – Short Trade → Trailing SL Hit (1:0.8)
12:45 PM – Long Trade → SL Hit
📌 Support & Resistance Levels
Resistance:
25,080 ~ 25,060
25,125
25,168
25,180 ~ 25,212
Support:
25,037
25,000 ~ 24,980
24,965
24,894 ~ 24,882
24,825
24,800 ~ 24,768
🧠 Final Thoughts:
"Markets often dance between zones of power — where bulls flex and bears press. It's not chaos, it's the choreography of sentiment."
The 25,000–25,212 zone continues to be the battlefield. Let’s see who seizes the upper hand tomorrow.
✏️ Disclaimer:
This is just my personal viewpoint. Always consult your financial advisor before taking any action.
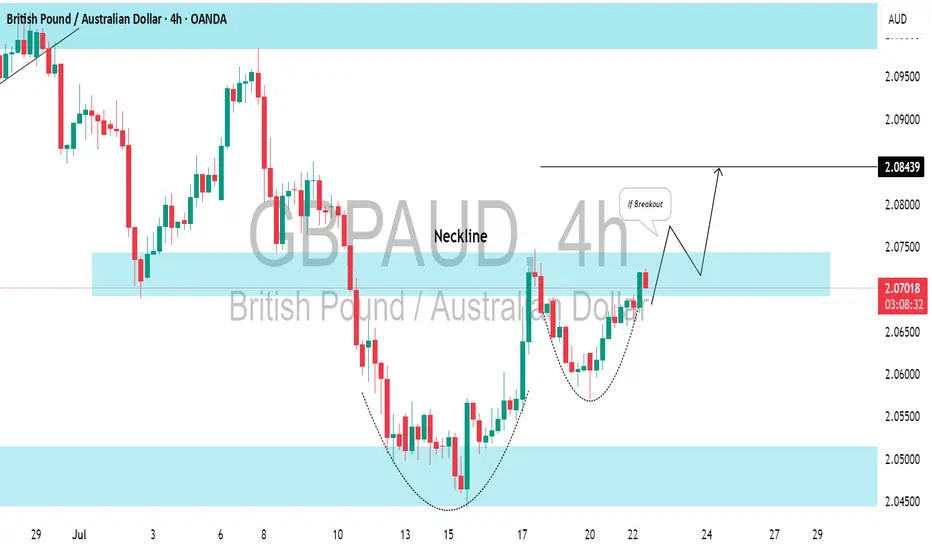
GBPAUD: Another Bullish Pattern⚠️GBPAUD has adhered to a horizontal support level on the intraday chart and has bounced back from it, revealing a strong bullish pattern.
The price has formed a cup and handle pattern and is currently testing its neckline.
Look for a breakout confirmation; a 4-hour candle closing above the 2.0750 level will validate this breakout, leading to an anticipated bullish continuation.
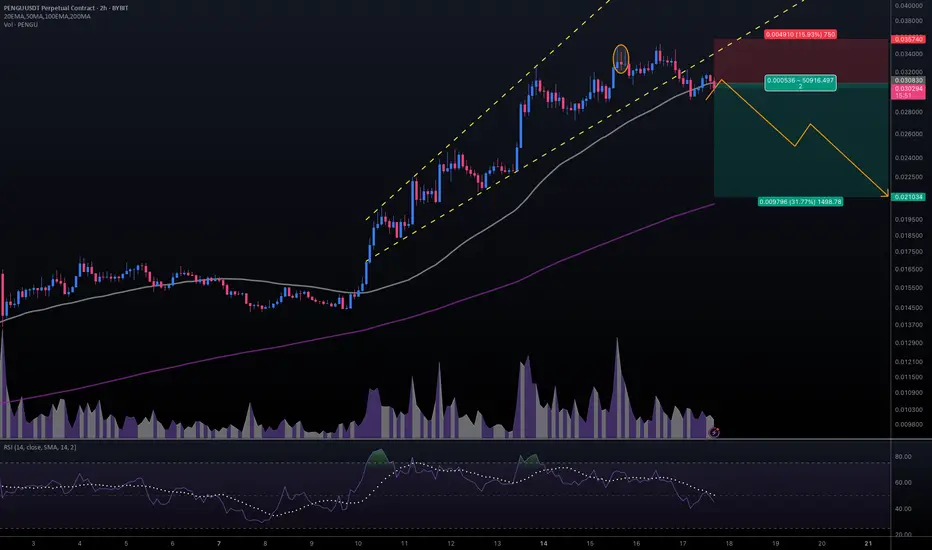
#PENGUUSDT #2h (ByBit) Broadening wedge breakdownPudgy Penguins printed an evening star then lost 50MA, seems to be heading towards 200MA support next.
⚡️⚡️ #PENGU/USDT ⚡️⚡️
Exchanges: ByBit USDT
Signal Type: Regular (Short)
Leverage: Isolated (2.5X)
Amount: 5.0%
Entry Targets:
1) 0.030830
Take-Profit Targets:
1) 0.021034
Stop Targets:
1) 0.035740
Published By: @Zblaba
CSECY:PENGU BYBIT:PENGUUSDT.P #4h #PludgyPenguins #Meme pudgypenguins.com
Risk/Reward= 1:2.0
Expected Profit= +79.4%
Possible Loss= -39.8%
Dollar Index (DXY): Time to Recover
It looks like Dollar Index is going to recover after a yesterday's
rapid fall.
The market reached a key support and formed a cup & handle pattern on that.
We can expect a pullback at least to 98.09 level.
❤️Please, support my work with like, thank you!❤️

Gold’s Rapid Surge: A Trap Before the Drop?Gold finally showed signs of retreat. We are still holding a short position near 3400. So far, we have made a profit of 50 pips. However, I will still hold it to see if gold can fall back to the 3385-3375 area as expected. We have completed 2 transactions today, and there is still 1 transaction left to hold.
1. First, we bought gold near 3345 and ended the transaction by hitting TP: 3370, making a profit of 250 pips, with a profit of more than $12K;
2. We shorted gold near 3385 and ended the transaction by hitting SL: 3395, with a loss of 100 pips, a loss of nearly $5K;
3. We are still holding a short gold transaction order near 3400, with a current floating profit of 60 pips and a floating profit of nearly $4K;
The above is the detailed transaction situation today. To be honest, today's rebound strength far exceeded my expectations, and after our first long position hit TP, the market never gave any chance to go long on gold after a pullback, but accelerated to around 3401. But obviously, the accelerated rise of gold is suspected of catching up with the top, and in the short term it faces resistance in the 3405-3410 area, and secondly pressure in the 3420-3425 area. So I don't advocate chasing gold at the moment. On the contrary, I am still actively trying to short gold around 3400, first expecting gold to pull back to the 3385-3375-3365 area.
And I think if gold wants to continue to test the 3405-3415 area, or even sprint to the area around 3425, gold must go through a pullback to increase liquidity to accumulate upward momentum. I think it will at least pull back to the 3385-3375 area.
Japanese Candlestick Cheat Sheet – Part Two- 2 candle patternsTwo-Candle Patterns That Signal Shifts in Sentiment
Single candles whisper…
But two candles talk to each other — and when they do, they often reveal the first signs of a reversal or continuation.
In this second part of the series, we go deeper.
From engulfings to haramis, tweezer tops to piercing lines — these patterns don’t just look good on charts… they capture the psychological tug-of-war between buyers and sellers.
Price doesn’t lie.
And two candles in a row can say: “Something just changed.”
Learn to spot them early. Learn to listen when the chart speaks.
This is Part Two of your practical guide to mastering candlestick formations.
BULLISH KICKER
Bias: Bullish
What is the Bullish Kicker pattern?
The Bullish Kicker forms when a strong bullish candle follows a bearish one with no overlap between the two, indicating a sudden shift in sentiment. This pattern is a powerful indicator of a reversal as buyers take control. The sharp contrast between the bearish and bullish candles reflects a dramatic shift in market psychology, where bears are caught off-guard and forced to cover their positions.
Bullish Kickers are rare but extremely telling, providing a clear signal that sentiment is favoring buyers. Recognizing such decisive patterns can be a game-changer.
Meaning:
Found after downtrends or sell-offs; suggests a sudden shift in sentiment, indicating strong buying interest and potential trend reversal.
BULLISH ENGULFING
Bias: Bullish
What is the Bullish Engulfing pattern?
The Bullish Engulfing pattern occurs when a large bullish candle fully engulfs the previous smaller bearish candle, signaling a potential trend reversal. This pattern highlights a moment when buyers overpower sellers, often marking the beginning of upward momentum. Psychologically, it suggests that buyer confidence is returning, and sellers are losing their grip.
For traders, understanding Bullish Engulfing patterns can provide crucial entry points into emerging trends. Learning to identify and trade such patterns is essential for capturing momentum and new trends.
Meaning:
Typically found in downtrends, this pattern signals a potential bullish reversal as buyers overpower sellers, often indicating a shift toward upward momentum.
BULLISH HARAMI
Bias: Bullish
What is the Bullish Harami pattern?
The Bullish Harami consists of a small bullish candle within a preceding larger bearish one, indicating a pause in downward momentum and hinting at a potential reversal. This pattern shows that sellers are beginning to weaken as buyers cautiously test the waters. The Harami reflects a shift in sentiment from bearish to neutral, often marking a transitional phase in the market.
Interpreting the Bullish Harami helps traders spot moments when sentiment is shifting, potentially signaling the start of a trend change.
Meaning:
Seen in downtrends, it suggests indecision, with possible bullish reversal if the following candles confirm buying strength, indicating a weakening bearish trend.
PIERCING LINE
Bias: Bullish
What is the Piercing Line pattern?
The Piercing Line forms when a bullish candle opens below the previous bearish candle’s low but closes over halfway into it. Found in downtrends, this pattern reflects strong buying pressure as buyers step in at lower prices, creating a potential bullish reversal. The Piercing Line pattern suggests that sentiment may be shifting as buyers gain confidence.
This pattern’s strength lies in its psychological impact, revealing moments when buyers are willing to take risks. Recognizing these signs early can provide valuable insights for traders looking to time entries.
Meaning :
Found in downtrends, this pattern suggests a possible bullish reversal if buying continues, as sellers lose control to buyers.
TWEEZER BOTTOM
Bias: Bullish
What is the Tweezer Bottom pattern?
The Tweezer Bottom pattern is characterized by two consecutive candles with nearly identical lows, one bearish and one bullish. This pattern often signals the end of a downtrend, as the matching lows suggest a strong support level where buyers are stepping in. The Tweezer Bottom highlights market psychology at work, with sellers unable to push prices lower, reflecting renewed buying interest.
Tweezer Bottoms are ideal for traders looking to identify support zones and potential reversal points. By understanding this pattern’s significance, traders can make informed decisions.
Meaning:
Found in downtrends, it signals potential reversal, showing strong support at the matching low, suggesting buyers are stepping in.
BEARISH KICKER
Bias: Bearish
What is the Bearish Kicker pattern?
The Bearish Kicker is the inverse of the Bullish Kicker, forming when a strong bearish candle follows a bullish one without overlap, indicating a sharp sentiment shift. This pattern often marks a sudden reversal, with sellers taking control after an initial bullish period. Psychologically, Bearish Kickers are powerful, signaling that buyers are caught off-guard and losing momentum.
Recognizing Bearish Kickers provides traders with insights into sudden shifts in market dynamics, helping them avoid buying into weakening trends.
Meaning:
Found after uptrends; indicates a sudden sentiment shift, signaling potential trend reversal and intensified selling pressure.
BEARISH ENGULFING
Bias: Bearish
What is the Bearish Engulfing pattern?
The Bearish Engulfing pattern forms when a large bearish candle engulfs the previous smaller bullish candle, suggesting a potential reversal in an uptrend. This pattern signals that sellers have regained control, often marking the start of downward momentum. The Bearish Engulfing reveals a psychological shift, as selling pressure overtakes buying interest.
This pattern is a powerful tool for traders who aim to catch trend reversals, allowing them to align with emerging downward momentum.
Meaning:
Typically found in uptrends, this pattern signals a potential bearish reversal as sellers overpower buyers, often indicating a downward momentum shift.
BEARISH HARAMI
Bias: Bearish
What is the Bearish Harami pattern?
The Bearish Harami consists of a small bearish candle contained within a larger preceding bullish one, reflecting indecision and a potential trend reversal. Found in uptrends, it hints that buyers are losing strength, while sellers are cautiously testing the market. This pattern highlights moments when buyer momentum begins to wane, suggesting caution.
Interpreting the Bearish Harami allows traders to spot potential shifts in sentiment, helping them manage risk and time their exits.
Meaning:
Seen in uptrends, it suggests indecision with a potential bearish reversal if following candles confirm, indicating a weakening bullish trend.
DARK CLOUD COVER
Bias: Bearish
What is the Dark Cloud Cover pattern?
The Dark Cloud Cover appears when a bearish candle opens above the previous bullish candle but closes over halfway into it, reflecting a shift in control from buyers to sellers. This pattern suggests that bullish momentum may be fading, hinting at a potential reversal. Dark Cloud Cover patterns reveal moments when sentiment shifts from optimism to caution.
For traders, understanding this pattern helps them anticipate reversals at the top of uptrends.
Meaning:
Found in uptrends; signals potential bearish reversal if selling continues, as buyers lose control to sellers.
TWEEZER TOP
Bias: Bearish
W hat is the Tweezer Top pattern?
The Tweezer Top is formed by two candles with matching or nearly matching highs, typically one bullish and one bearish. This pattern signals potential resistance, as sellers are consistently pushing back against the same level. The Tweezer Top reflects a moment of seller strength, often marking the end of an uptrend.
Recognizing Tweezer Tops helps traders spot resistance zones and potential reversal points, allowing them to avoid buying into weakening trends or even shorting the asset.
Meaning:
Found in uptrends, it signals potential reversal, showing strong resistance at the matching high, suggesting selling pressure.
🧭 Final Thought
Two-candle formations often appear at key turning points — right where most traders hesitate or get trapped.
Learn to read them not just as patterns, but as conversations between candles — one pushing, the other reacting.
And if this is your first time reading the series, don’t miss Part One – where we covered single-candle signals like dojis, hammers, and marubozus — the very foundations of candlestick reading.
A significant drop in price about to occur in XAUUSD (Gold)!!!Price of gold is about to drop significantly as we just spotted a bearish engulfing candlestick pattern in the H4 timeframe around the $3400 level. Also we can spot a double top pattern in 45M timeframe. All of these signals shows a potential sell opportunity from the current market price.
This is likely to be the first significant sell correction after the bullish impulse the market has made since the major breakout occurred around the $2000 level. A sell opportunity is envisaged from the current market price.

GBPUSD Short, 21 JulyShort-Term Bearish Bias Despite HTF OB
Even though we sit at a Daily Orderblock (Buy), LTF structure remains bearish, and price respects both D/4H EMA.
📉 Confluence:
Multiple Asia lows unfilled
Clear snap of recent lows
Gap on DXY still open
DXY lacks perfect structure but aligns with 4H EMA and gaps = possible short-term drop
On GU 15m Extreme OB in play
🎯 Entry: Waiting for 1m BOS to confirm sellers stepping in
🛡️ SL: Slight risk, can’t fully cover highs with a 10 pip stop
📌 TP: Focused on completing Asia lows with 1:3 RR target minimum

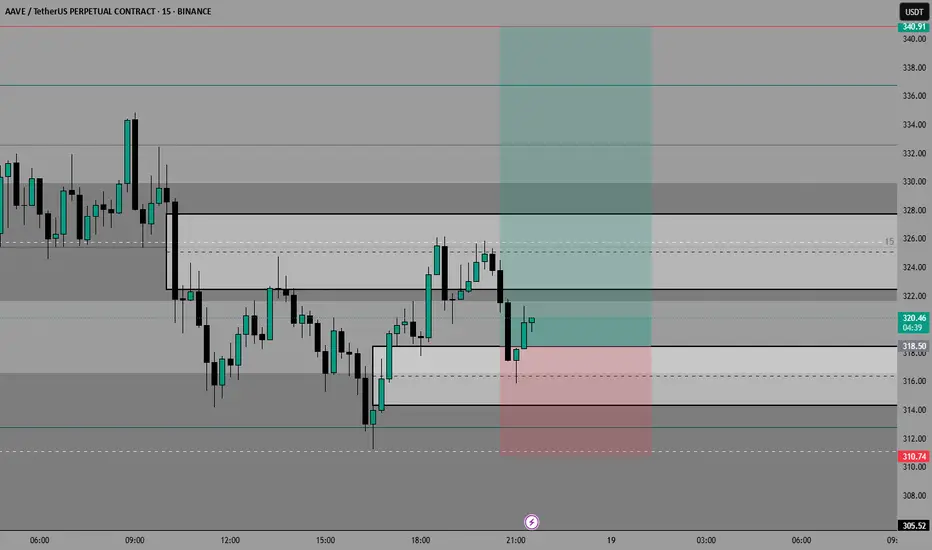
AAVE IDEA JUL/18/25Let’s try another one over the weekend.
We’re aiming for that LQ on the HTF, but we’ll catch some partials along the way
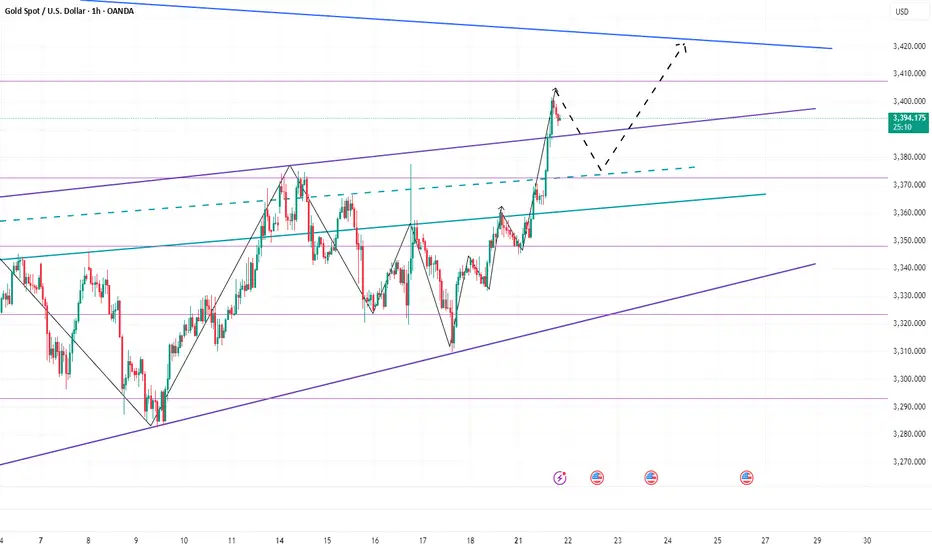
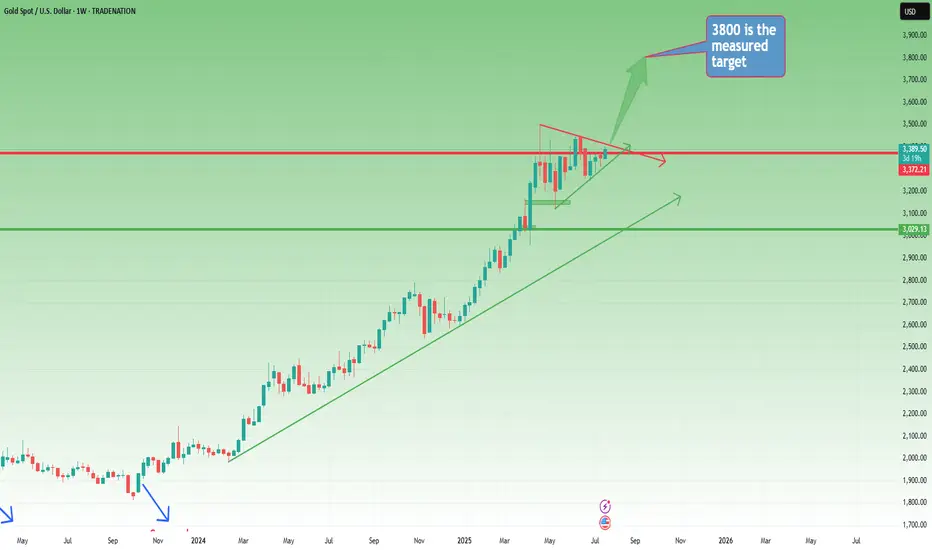
Weekly Outlook: Gold Builds Pressure – Is the Big Move Coming?📆 Big Picture View
Since the start of 2024, Gold has been moving in a well-defined long-term bullish trend.
Yes, there were meaningful pullbacks along the way — but the direction was never in doubt. Step by step, Gold climbed over 15,000 pips in just over a year, reaching a new all-time high in late April.
📉 Post-ATH: A Period of Stabilization
After peaking, Gold shifted into consolidation mode, with price gravitating around the 3300 zone.
This sideways movement has been ongoing for the past three months, but it’s not a sign of weakness — it’s the market catching its breath.
On the weekly chart, this consolidation is now forming a symmetrical triangle, a classic continuation pattern that often appears mid-trend.
📐 The Technical Setup
- The symmetrical triangle shows compression of volatility
- Buyers and sellers are slowly converging toward a decision point
- A breakout is approaching, and when it comes, it could be explosive
🎯 What’s the Trigger?
- A confirmed break above 3450 would validate the triangle breakout
- That opens the door to quickly test the 3500 round figure
- The measured target for the triangle sits at 3800
Given the time Gold has spent consolidating (3+ months), this target could realistically be reached by year’s end
🧭 Strategic Takeaway
- As long as Gold holds above 3300, the bullish structure remains valid
- Breakout above 3450 is the green light for the next leg up
- Until then, the consolidation continues, and smart money prepares
📌 Conclusion:
Gold is building pressure. The weekly triangle is maturing.
This isn’t the end — it’s the pause before the next move.
Stay patient. Stay focused.
Because if 3450 breaks… 3800 is not a dream — it’s a destination. 🚀
Disclosure: I am part of TradeNation's Influencer program and receive a monthly fee for using their TradingView charts in my analyses and educational articles.
P.S: Here you have a short term analysis on Gold
Properly navigating this ATH run in NASDAQ - No supply yetEverything is explained quickly in the video.
Main points:
1) Lows and bullish imbalances respected
2) It's very difficult to short without supply
3) May get cyclical take profit like previous years
Be sure to let me know what you think!

How to Trade Doji Candles on TradingViewLearn to identify and trade doji candlestick patterns using TradingView's charting tools in this comprehensive tutorial from Optimus Futures. Doji candles are among the most significant candlestick formations because they signal market indecision and can help you spot potential trend reversal opportunities.
What You'll Learn:
• Understanding doji candlestick patterns and their significance in market analysis
• How to identify valid doji formations
• The psychology behind doji candles: when buyers and sellers fight to a draw
• Using volume analysis to confirm doji pattern validity
• Finding meaningful doji patterns at trend highs and lows for reversal setups
• Timeframe considerations for doji analysis on any chart period
• Step-by-step trading strategy for doji reversal setups
• How to set stop losses and profit targets
• Real example using E-Mini S&P 500 futures on 60-minute charts
This tutorial may help futures traders and technical analysts who want to use candlestick patterns to identify potential trend reversals. The strategies covered could assist you in creating straightforward reversal setups when market indecision appears at key price levels.
Learn more about futures trading with Tradingview: optimusfutures.com
Disclaimer:
There is a substantial risk of loss in futures trading. Past performance is not indicative of future results. Please trade only with risk capital. We are not responsible for any third-party links, comments, or content shared on TradingView. Any opinions, links, or messages posted by users on TradingView do not represent our views or recommendations. Please exercise your own judgment and due diligence when engaging with any external content or user commentary.
This video represents the opinion of Optimus Futures and is intended for educational purposes only. Chart interpretations are presented solely to illustrate objective technical concepts and should not be viewed as predictive of future market behavior. In our opinion, charts are analytical tools—not forecasting instruments. Market conditions are constantly evolving, and all trading decisions should be made independently, with careful consideration of individual risk tolerance and financial objectives.

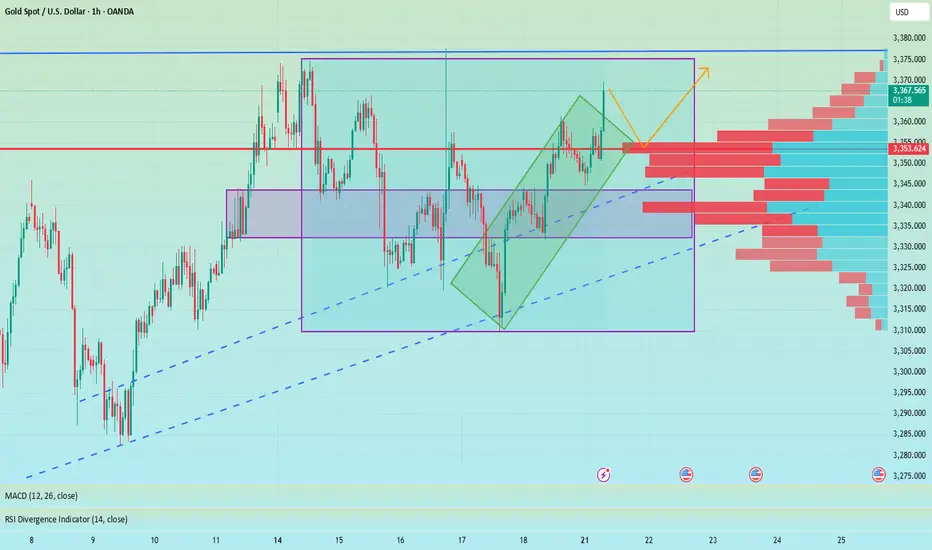
Accurate prediction, continue to buy after retracement to 3353📰 News information:
1. The Trump administration puts pressure on the Federal Reserve to cut interest rates
2. The continued impact of tariffs and the responses of various countries
📈 Technical Analysis:
Gold is currently rising rapidly, reaching a high near 3368, and the overall bullish trend has not changed yet. It is not recommended to continue chasing the highs at present. Those who are long at 3345 can consider exiting the market with profits. The technical indicators are close to the overbought area and there is a certain risk of a correction. Be patient and wait for the pullback to provide an opportunity. At the same time, 3353 has become the position with relatively large trading volume at present, and the top and bottom conversion in the short term provides certain support for gold longs. If it retreats to 3355-3345, you can consider going long again, with the target at 3375-3385. If it falls below 3345, look to 3333, a second trading opportunity within the day. If it falls below again, it means that the market has changed, and you can no longer easily chase long positions.
🎯 Trading Points:
BUY 3355-3345
TP 3375-3385
In addition to investment, life also includes poetry, distant places, and Allen. Facing the market is actually facing yourself, correcting your shortcomings, facing your mistakes, and exercising strict self-discipline. I share free trading strategies and analysis ideas every day for reference by brothers. I hope my analysis can help you.
FXOPEN:XAUUSD OANDA:XAUUSD FX:XAUUSD FOREXCOM:XAUUSD PEPPERSTONE:XAUUSD TVC:GOLD
Nifty Analysis EOD – July 21, 2025 – Monday 🟢 Nifty Analysis EOD – July 21, 2025 – Monday 🔴
“Shock, Squeeze, and a Strong Close — Bulls Reclaim 25K”
Today’s move was nothing short of shocking. In the first 45 minutes, Nifty plunged more than 150 points, breaking through key levels and touching 24,882. But what followed was a V-shaped recovery that caught both Friday’s shorts and those who shorted below PDC/PDL completely off guard.
The index powered up to mark a day high of 25,080, and sustained above CPR and VWAP throughout most of the session. A final push came around 2:55 PM, breaking the intraday trendline and CDH, registering a fresh high before closing near the top at 25,090.70.
✅ Bulls not only held 25K — they dominated the battlefield all day, recovering almost everything lost during Friday’s drop.
🕯 5 Min Time Frame Chart with Intraday Levels
🕯 Daily Time Frame Chart with Intraday Levels
🕯 Daily Candle Breakdown
Open: 24,999.00
High: 25,111.40
Low: 24,882.30
Close: 25,090.70
Change: +122.30 (+0.49%)
📊 Candle Structure Breakdown
Real Body: 91.70 points → strong bullish body
Upper Wick: 20.70 points → slight hesitation near highs
Lower Wick: 116.70 points → deep intraday buying from the lows
🔍 Interpretation
Mildly negative open, followed by a sharp 150-point fall
Buyers stepped in strongly near 24,880, triggering a sharp reversal
V-shape recovery sustained above CPR & VWAP, closing near high
Close is not just above open — it’s above Friday’s close and 25K mark
🕯 Candle Type
Hammer-like Bullish Reversal Candle — Long lower wick with green body, signaling strong dip buying and possible short-term trend reversal
📌 Key Insight
Strong defense at 24,880–24,900 created the base for reversal
Close above 25,090 shifts near-term bias in favor of bulls
25,110–25,140 is the next resistance to watch
As long as we stay above 24,900, buyers hold the edge
🛡 5 Min Intraday Chart
⚔️ Gladiator Strategy Update
ATR: 186.31
IB Range: 166.8 → Wide IB
Market Structure: 🟡 Balanced
📉 Trades Triggered:
10:09 AM – Long Trade → ❌ SL Hit
📌 Support & Resistance Levels
Resistance Levels:
25,080 ~ 25,060
25,125
25,168
25,180 ~ 25,212
Support Levels:
25,037
25,000 ~ 24,980
24,965
24,894 ~ 24,882
24,825
24,800 ~ 24,768
💭 Final Thoughts
🧠 “Volatility doesn’t confuse the market — it reveals who’s in control.”Today’s V-shaped reversal erased all doubts from Friday’s fall. Buyers didn’t just defend — they counterattacked and reclaimed 25K with authority.Follow-through above 25,125 on Monday could confirm trend resumption.
✏️ Disclaimer
This is just my personal viewpoint. Always consult your financial advisor before taking any action.

GBPUSD SHORTMarket structure bearishh on HTFs 3
Entry at both Weekly and Daily AOi
Weekly Rejection at AOi
Previous Weekly Structure Point
Daily Rejection at AOi
Daily EMA retest
Around Psychological Level 1.34500
H4 EMA retest
H4 Candlestick rejection
Rejection from Previous structure
Levels 5.02
Entry 115%
REMEMBER : Trading is a Game Of Probability
: Manage Your Risk
: Be Patient
: Every Moment Is Unique
: Rinse, Wash, Repeat!
: Christ is King.
