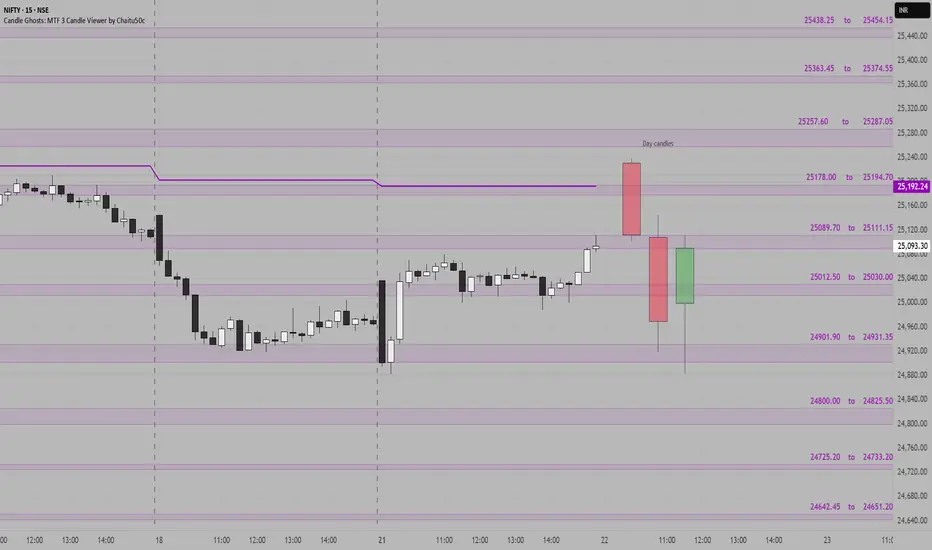
NIFTY SUPPORT & RESISTANCE ZONES FOR 22-07-2025Nifty Support & Resistance Zones for Tomorrow 22-07-2025
Based on price cluster analysis and recent market structure, the following key support and resistance levels have been identified for the upcoming session:
Resistance Zones:
25438.25 – 25454.15
25363.45 – 25374.55
25257.60 – 25287.05
25178.00 – 25194.70
25089.70 – 25111.15
Support Zones:
25012.50 – 25030.00
24901.90 – 24931.35
24800.00 – 24825.50
24725.20 – 24733.20
24642.45 – 24651.20
These levels are derived from high-probability zones where price has shown repeated interaction in the recent past. Watch how Nifty reacts at these zones for potential breakout, reversal, or pullback setups.
Candlestick Analysis
BTCUSD - BEARISH DIVERGENCE DETECTEDCAPITALCOM:BTCUSD
BTCUSD has been in a bullish trend over the past few hours and is now approaching the resistance at 119,500.00.
On the hourly chart, a bearish hammer has formed alongside a stochastic divergence, signaling potential downside.
⚡ This signal is reinforced by a strong resistance level above, adding weight to a possible pullback scenario.
📉 If BTCUSD rebounds from this level, consider Sell setups with take profit at the nearest support.
📈 If it breaks out, look for Buy opportunities on confirmation.
⚡ We use Stoch (14) to spot potential reversals when it exits overbought or oversold zones — helping you catch clear, confident entries.

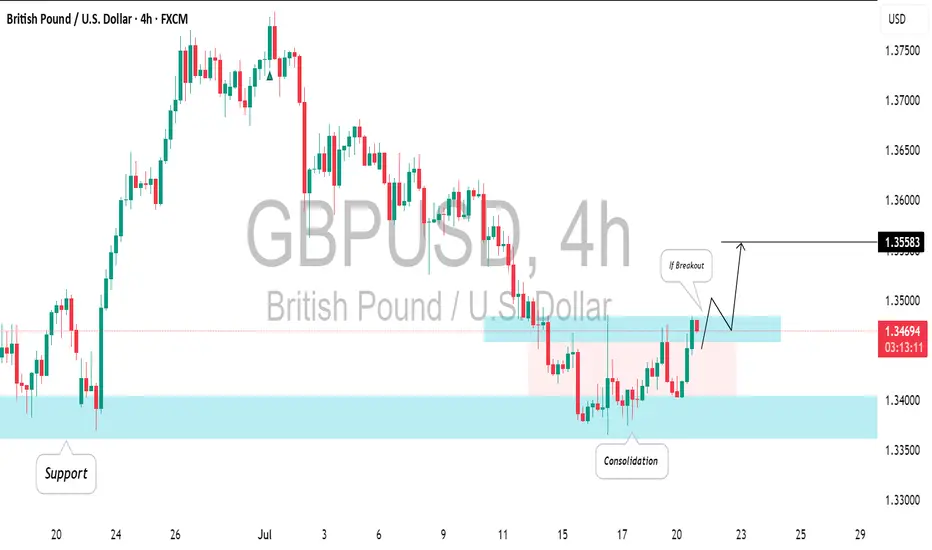
GBPUSD: Your Trading Plan For Today ExplainedThe GBPUSD is currently consolidating at a solid intraday/daily support level.
To enter a buy position with confirmation, it's advisable to wait for a breakout on the 4-hour chart.
A breakout followed by a 4-hour candle closing above the horizontal resistance will serve as a strong bullish signal, with a target of 1.3558.
Conversely, if the price makes a new lower low on the 4-hour chart, this setup will be considered invalid.
Bear Despite major trend being bulls we have a n opportunity to sell at this region (1Day resistance line and target previous 4hr resistance line that has been broken

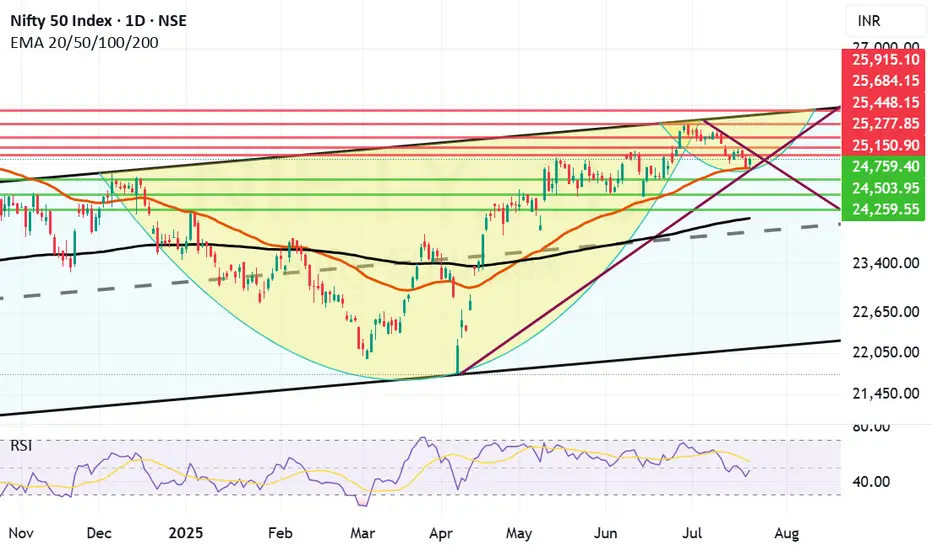
Nifty has taken support at Mother line as expected.Despite poor showing by Reliance post result and TCS continuing to fall Nifty staged a remarkable comeback on the back of Pvt Sector banking which did well. Bank Nifty came back strongly posting 1.19% gains today which enabled Nifty to rise 122 points or 0.49%. Capital Goods, Finance and Metals indices also gained more than 1% each.
Resistances for Nifty now remain at: 25150, 25277 (Trend line resistance), 25448, 25684 and finally channel top resistance at 25915.
Supports for Nifty remain at: 24938 (Mother Line Support of Daily Chart), 24759, 24503, 24259 and finally 24116 (Father Line support of Daily chart).
Shadow of the candle right now is neutral to positive and RSI is 47.63 with median RSI resistance at 54.09.
Disclaimer: The above information is provided for educational purpose, analysis and paper trading only. Please don't treat this as a buy or sell recommendation for the stock or index. The Techno-Funda analysis is based on data that is more than 3 months old. Supports and Resistances are determined by historic past peaks and Valley in the chart. Many other indicators and patterns like EMA, RSI, MACD, Volumes, Fibonacci, parallel channel etc. use historic data which is 3 months or older cyclical points. There is no guarantee they will work in future as markets are highly volatile and swings in prices are also due to macro and micro factors based on actions taken by the company as well as region and global events. Equity investment is subject to risks. I or my clients or family members might have positions in the stocks that we mention in our educational posts. We will not be responsible for any Profit or loss that may occur due to any financial decision taken based on any data provided in this message. Do consult your investment advisor before taking any financial decisions. Stop losses should be an important part of any investment in equity.
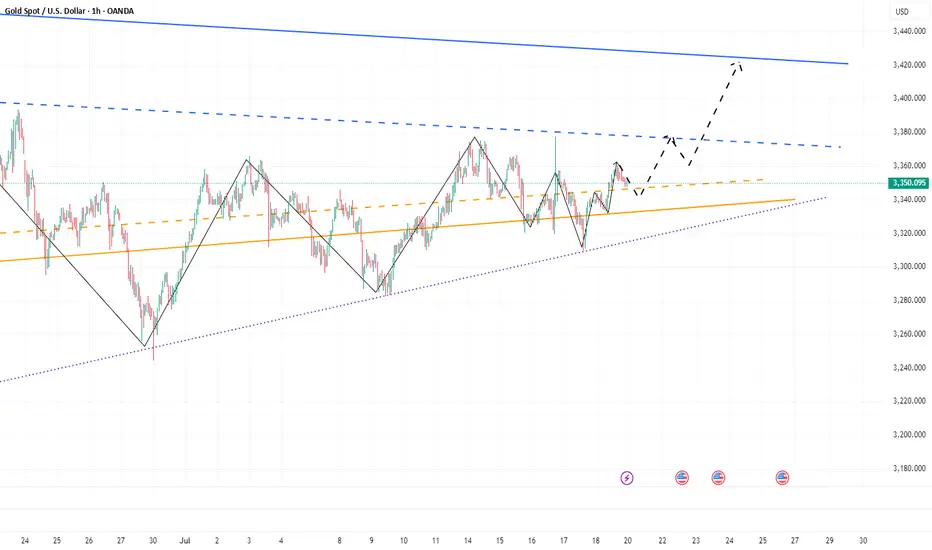
GOLD: Pre-market PrepSo for gold today, I see a lot of confluence around the prior week's high, prior day's high, and the prior value area high. We also had a poor high last Friday that we've clearly broken through.
Right now, we're in balance up above these key levels. My immediate plan is to continue going long up to the prior month's value area high. If we get a pullback to the confluence area, I want to take it up from there.
If the market opens and we accept back into the previous area, I'll be looking to go short from that area and take it down. That's my main analysis for gold today. Let’s trade smart, peace!

Gold is waiting for a pullback to break through 3400In the short term, gold is stuck in a sideways trend near 3365. It is not recommended to enter this point regardless of long or short positions. It is expected that there will be certain variables in the NY period. If gold retreats and falls in the short term as we expect, it may first touch around 3361. If it falls below 3361, it is expected to touch around 3353, which is also the point I gave this morning to see support.
Judging from the market, our focus on the upper side is still the 3375-3385 resistance area. If it can be effectively broken through, it is expected to hit the 3400-3420 mark. Although the daily MACD is oscillating near the zero axis, the 4H market shows that the oscillation is strong. Our trading strategy remains unchanged in the short term. The pullback in the NY period provides an opportunity, and we can consider going long. If there is new news during the day that requires adjustment, I will notify you immediately. Bros, please be patient and wait for trading opportunities.
OANDA:XAUUSD

Japanese Candlestick Cheat Sheet – Part OneSingle-Candle Formations That Speak
Before you dream of profits, learn the one language that never lies: price.
Indicators are just subtitles — price is the voice.
Japanese candlesticks are more than just red and green bars — they reflect emotion, pressure, and intention within the market.
This series will walk you through the real psychology behind candlestick patterns — starting here, with the most essential:
🕯️ Single-candle formations — the quiet signals that often appear before big moves happen.
If you can’t read a doji, you’re not ready to understand the market’s hesitation.
If you ignore a hammer, you’ll miss the moment sentiment shifts.
Let’s start simple. Let’s start strong.
This is Part One of a five-part series designed to build your candlestick fluency from the ground up.
1. DOJI
Bias: Neutral
What is the Doji pattern?
The Doji candlestick pattern forms when a candle’s open and close prices are nearly identical, resulting in a small or nonexistent body with wicks on both sides. This pattern reflects market equilibrium, where neither buyers nor sellers dominate. Dojis often appear at trend ends, signaling potential reversals or pauses.
As a fundamental tool in technical analysis, Dojis help traders gauge the psychological battle between buyers and sellers. Proper interpretation requires context and experience, especially for spotting trend shifts.
Meaning:
Indicates market indecision or balance. Found during trends and may signal a reversal or continuation based on context.
LONG-LEGGED DOJI
Bias: Neutral
What is the Long-Legged Doji pattern?
The Long-Legged Doji captures a moment of intense uncertainty and volatility in the market. Its long wicks represent significant movement on both sides, suggesting that neither buyers nor sellers have control. This back-and-forth reflects the psychology of market participants wrestling for control, which often foreshadows a shift in sentiment. When traders see a Long-Legged Doji, it highlights the need to monitor for potential changes in direction.
They can appear within trends, at potential reversal points, or at consolidation zones. When they form at the end of an uptrend or downtrend, they often signal that the current trend may be losing momentum.
Meaning:
The prominent wicks indicate volatility. Buyers and sellers pushed prices in opposite directions throughout the session, ultimately reaching an indecisive close.
SPINNING TOP
Bias: Neutral
What is the Spinning Top pattern?
A Spinning Top is a candlestick with a small body and long upper and lower wicks, indicating that the market has fluctuated significantly but ultimately closed near its opening price. This pattern often points to a moment of indecision, where both buyers and sellers are active but neither dominates. Spinning Tops are commonly found within both uptrends and downtrends and can suggest that a trend is losing momentum.
For traders, a Spinning Top provides a valuable insight into market psychology, as it hints that the prevailing sentiment may be weakening. While Spinning Tops alone aren’t always definitive, they can serve as a precursor to larger moves if the following candles confirm a shift in sentiment.
Meaning:
Shows indecision between buyers and sellers. Common in both up and downtrends; signals potential reversal or pause.
HAMMER
Bias: Bullish
What is the Hammer pattern?
A Hammer candlestick appears at the end of a downtrend, with a small body and a long lower wick. This shape reflects a moment when sellers pushed prices lower, but buyers managed to absorb the selling pressure and drive prices back up before the close. This pattern is particularly important for spotting potential reversals, as it indicates that buyers are beginning to reassert control.
Hammers reveal the underlying psychology of a market where buying confidence is emerging, even if sellers have dominated for a while. To successfully trade this pattern, it’s essential to confirm the reversal with subsequent candles.
Meaning:
Showing rejection of lower prices. Signals potential bullish reversal, especially if followed by strong buying candles.
INVERTED HAMMER
Bias: Bullish
What is the Inverted Hammer pattern?
The Inverted Hammer forms at the bottom of a downtrend, with a small body and long upper wick. This pattern shows that buyers attempted to push prices higher, but sellers ultimately brought them back down by the close. The Inverted Hammer is an early sign of buyer interest, hinting that a trend reversal may be underway if subsequent candles confirm the shift.
Interpreting the Inverted Hammer helps traders understand where sentiment may be shifting from bearish to bullish, often marking the beginning of a recovery. Recognizing these patterns takes practice and familiarity with market conditions.
Meaning:
Showing rejection of higher prices. Can signal bullish reversal if confirmed by subsequent buying pressure.
DRAGONFLY DOJI
Bias: Bullish
What is the Dragonfly Doji pattern?
The Dragonfly Doji has a long lower wick and no upper wick, forming in downtrends to signal potential bullish reversal. This pattern reveals that sellers were initially in control, pushing prices lower, but buyers stepped in to push prices back up to the opening level. The Dragonfly Doji’s unique shape signifies that strong buying support exists at the lower price level, hinting at an impending reversal.
Recognizing the psychology behind a Dragonfly Doji can enhance a trader’s ability to anticipate trend changes, especially in markets where support levels are being tested.
Meaning:
Found in downtrends; suggests possible bullish reversal if confirmed by a strong upward move.
BULLISH MARUBOZU
Bias: Bullish
What is the Bullish Marubozu pattern?
The Bullish Marubozu is a large, solid candle with no wicks, indicating that buyers were in complete control throughout the session. This pattern appears in uptrends, where it signals strong buying momentum and often foreshadows continued upward movement. The absence of wicks reveals that prices consistently moved higher, with little resistance from sellers.
For traders, the Bullish Marubozu offers a glimpse into market psychology, highlighting moments when buyer sentiment is particularly strong. Learning to identify these periods of intense momentum is crucial for trading success.
Meaning:
Showing complete buying control. Found in uptrends or at reversal points; indicates strong buying pressure and likely continuation of the trend.
SHOOTING STAR
Bias: Bearish
What is the Shooting Star pattern?
The Shooting Star appears at the top of an uptrend, characterized by a small body and a long upper wick, indicating a potential bearish reversal. Buyers initially drove prices higher, but sellers took over, bringing prices back down near the open. This shift suggests that buyers may be losing control, and a reversal could be imminent.
Interpreting the Shooting Star gives traders valuable insights into moments when optimism begins to fade, providing clues about a potential trend shift.
Meaning:
Indicating rejection of higher prices. Signals a potential bearish reversal if followed by selling pressure.
HANGING MAN
Bias: Bearish
W hat is the Hanging Man pattern?
The Hanging Man candle forms at the top of an uptrend, with a small body and long lower wick. This pattern suggests that sellers attempted to drive prices down, but buyers regained control. However, the presence of a long lower shadow hints that sellers may be gaining strength, potentially signaling a bearish reversal.
The Hanging Man pattern reflects market psychology where buyers might be overextended, making it a valuable tool for identifying potential tops in trends.
Meaning:
Signals potential bearish reversal if confirmed by selling candles afterward.
GRAVESTONE DOJI
Bias: Bearish
What is the Gravestone Doji pattern?
With a long upper wick and no lower wick, the Gravestone Doji reveals that buyers pushed prices up, but sellers eventually regained control. Found in uptrends, it suggests that a bearish reversal could be near, as the upper shadow indicates buyer exhaustion. The Gravestone Doji often appears at market tops, making it a valuable indicator for those looking to anticipate shifts.
Understanding the psychology behind this pattern helps traders make informed decisions, especially in markets prone to overbought conditions.
Meaning:
Showing rejection of higher prices. Found in uptrends; signals potential bearish reversal if followed by selling activity.
BEARISH MARUBOZU
Bias: Bearish
What is the Bearish Marubozu pattern?
The Bearish Marubozu is a large, solid bearish candle without wicks, showing that sellers held control throughout the session. Found in downtrends, it signals strong bearish sentiment and suggests that the trend is likely to continue. The lack of wicks reflects consistent downward momentum without significant buyer support.
This pattern speaks about market psychology, offering traders insights into moments of intense selling pressure. Recognizing the Bearish Marubozu can help you align with prevailing trends and avoid buying into weakening markets
Meaning:
Showing strong selling pressure. Found in downtrends; signals continuation of the bearish trend or an intensifying sell-off.
👉 Up next: Double-candle formations – where price meets reaction.
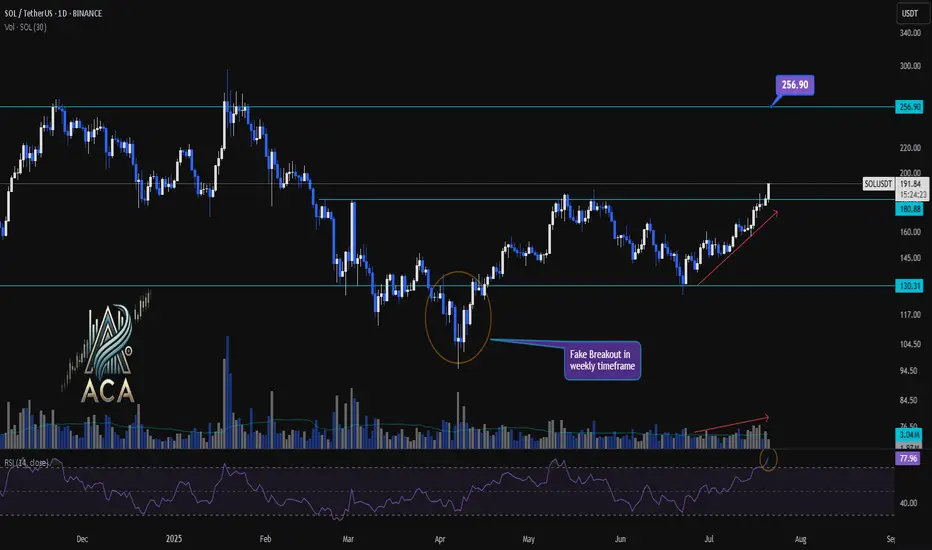
SOLUSDT 1D Chart Analysis | Accumulation Breakout Signals....SOLUSDT 1D Chart Analysis | Accumulation Breakout Signals Fresh Momentum
🔍 Let’s drill into the SOL/USDT daily chart, focusing on the recent breakout above the accumulation range, key support and resistance levels, RSI momentum, and volume confirmation for a robust bullish scenario.
⏳ Daily Overview
SOLUSDT has decisively broken out above a prolonged accumulation box, marking a significant shift in market structure. A daily close beyond this range now serves as a strong indicator for renewed bullish momentum. RSI is currently above 77, signaling that buyers are commanding momentum. Notably, volume has surged in tandem with price, confirming trader participation behind this breakout move.
📈 Technical Convergence and Trend Structure
- Accumulation Zone Break: After consolidating within a clear box for weeks, SOLUSDT closed above the upper boundary (around $180.88–$191.05), signaling a possible trend reversal or continuation.
- Daily Close Signal: A daily close outside the accumulation box offers high conviction for bullish continuation. This close acts as a potential entry signal for trend-followers.
- RSI Momentum: The RSI sits above 77—deep in the overbought territory. A close here not only confirms buyer strength but often precedes sustained uptrends when accompanied by price breakouts.
- Volume Surge: Volume has increased with the breakout, providing confirmation the move isn’t a false start, but likely fueled by real demand.
- Weekly Fake Breakout: There was a notable false breakout in the weekly timeframe, quickly reclaimed by bulls. This flip suggests buyers fended off downside attempts and now drive higher prices.
🔺 Bullish Setup & Targets
- First Target: $256.90 — marking the next major resistance on the chart and a logical upside objective for traders.
- Key Trigger: A confirmed daily (or weekly) close above the accumulation range with strong volume is essential for validating the upward trajectory.
📊 Key Highlights
- The breakdown of the accumulation box—now turned support—marks a pivotal structural change.
- RSI and price are making new local highs, solidifying the case for continued bullish momentum.
- Volume is climbing in sync with the move, offering real confirmation versus a potential fakeout.
- Recent fake breakout on the weekly chart, immediately negated, emphasizes that buyers are regaining—and likely maintaining—control.
🚨 Conclusion
SOLUSDT appears set for higher prices following the confirmed breakout above the accumulation range. Signs of trend health include an overbought RSI, volume confirmation, and the swift invalidation of a recent weekly fake breakout. As long as daily closes stay above the breakout level, the path remains clear for a rally toward $256.90. A strong daily close and continued volume will be your best signals for bullish continuation.
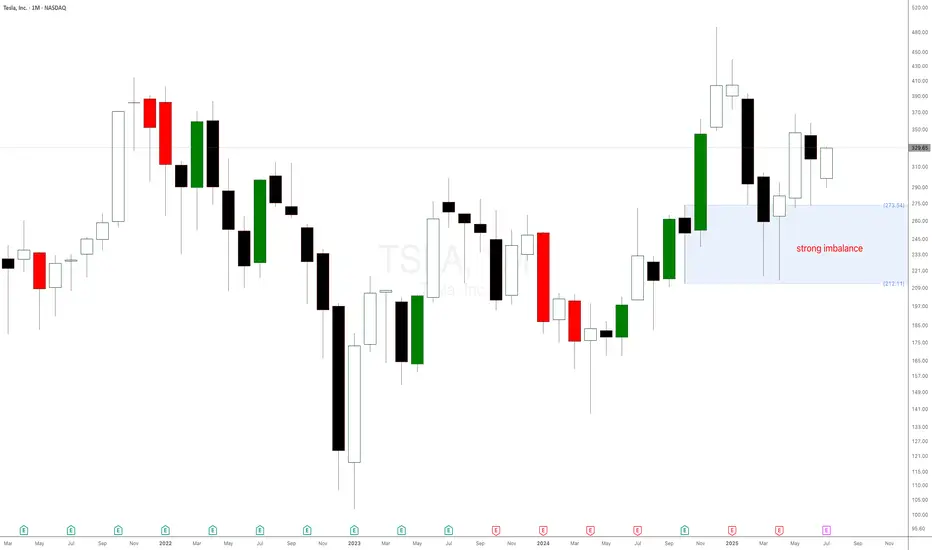
Don’t Listen to Elon Musk – Tesla Stock Chart Tells the REAL StoTesla Stock Set to Break Records: The Power of Monthly and Weekly Demand Imbalances at $273 and $298. Welcome back, traders! In today’s supply and demand breakdown, we’re diving deep into Tesla Inc. (NASDAQ: TSLA) — not from the noisy headlines or what Elon Musk just tweeted, but strictly from raw price action, demand imbalances, and the truth on the charts. Forget the fundamentals, forget the hype, because that’s already been priced in.
This is all about supply and demand, price action, and the power of patience.
The $273 Monthly Demand Imbalance: The Big Fish Made Their Move
A few weeks ago, Tesla stock pulled back to a significant monthly demand imbalance at $273. This level wasn’t just any zone—it was carved out by a strong impulsive move made of large-bodied bullish candlesticks, the kind that only institutions and whales create when they're loading up.
What happened next?
Boom. The market reacted exactly as expected, validating that monthly imbalance and setting the stage for higher prices. This is why we always trust the bigger timeframes—they hold the truth of what the smart money is doing.
Is This the Start of a New Gold Bull Run?News that must be paid attention to:
1. The Middle East region is in constant conflict and the situation is unstable, which may re-stimulate the market's risk aversion sentiment;
2. Trump strongly called for a rate cut, and many Fed directors agreed to the rate cut. Under the situation of internal and external troubles, can Powell withstand the pressure of rate cuts? In addition, the tense relationship between Trump and Powell, as well as the development of Powell's dismissal storm, have increased the market's risk aversion demand and enhanced the market's bullish sentiment;
3. The uncertainty brought about by the tariff issue may disrupt the market.
Technical aspects:
This week, the gold market is roughly a bottoming out and rebounding trend. We can clearly see from the recent candle chart that the recent trend line suppression is located near 3380, and this week gold has repeatedly encountered resistance and fallen in the 3375-3380 area, which has strengthened the suppression effect of resistance in this area to a certain extent; and gold has repeatedly tested the 3320-3310 area support during the retracement process. Gold has not fallen below the support of this area during multiple retracements, giving the market bulls great confidence.
On Friday, gold hit 3360 during the rebound and closed above 3350, which is strong in the short term. As gold continues to rebound, the current bull-bear dividing line is in the 3345-3335 area. If gold cannot even fall below the 3345-3335 area during the retracement next week, it will greatly boost buying power and is expected to hit the 3380 area again. Once gold breaks through the 3380 area during the rise, there will be a chance to further continue the rise and test 3400, or even the 3420 area.
Therefore, at the beginning of next week, if gold retreats to the 3345-3335 area for the first time, I think we must make an attempt to buy gold, first focusing on the target 3370-3380 area, and then bullish to the 3400-3420 area after a strong breakthrough.
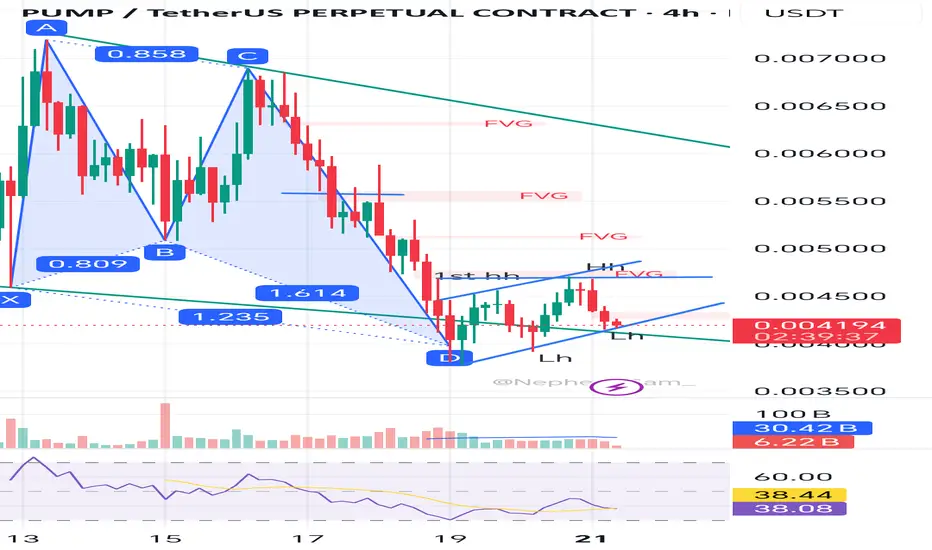
Bullish harmonic but with hidden rising flagThis is mine 2nd post this counter.
Pump just done a higher high and retest created a lower high.
But ytd higher high is not strong, it is in rising flag or rising wedge channel. Might have potential continuation pattern to go Down.. Currently it is still in downtrend anyway.
Still Not an A+ setup in this moment. He needs more times to prove himself.
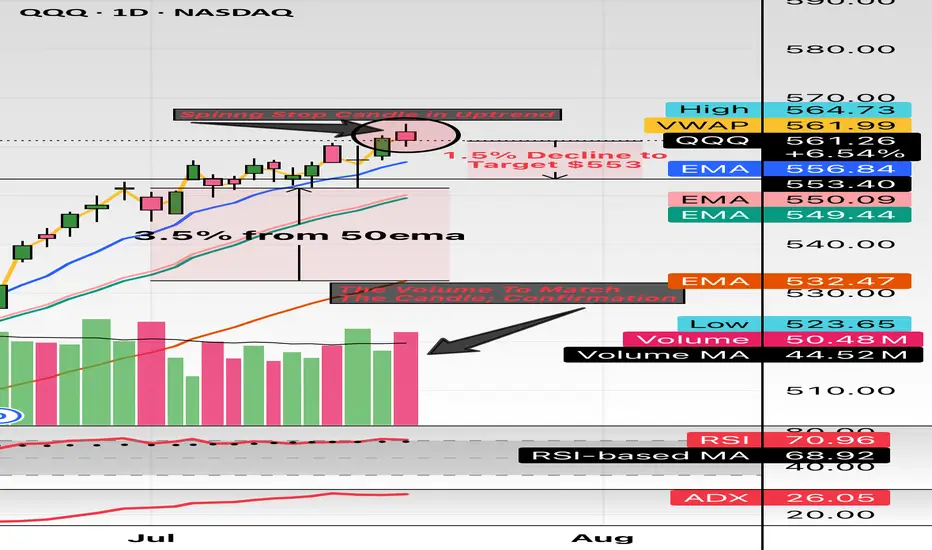
$QQQ this might the spot. Hello and good night, evening, afternoon, or morning wherever you may be. I have been looking at names all day and I wanted to check the indexes: NASDAQ:QQQ and $SPY.
Here we have the indexes up almost 30% from the April lows and sitting about 10% YTD. The candle highlighted is the spinning stop candle and has volume to match. These candles usually take place (green or red) in downtrends or uptrends and provide pivotal indication. The market has major earnings this week (07/21/2025 to 07/25/2025) with names like Google, Tesla, General Dynamics, Verizon, Domino’s And so forth.
This week could be a catalyst to see some great volatility. I believe staying 3% from moving averages so I have noted 3.5% from the 50EMA and revisiting the 20EMA and 21EMA in the low $550 area. My target is $553 which is only a 1.4% move which can happen in one session in this environment while staying 3.5% above the 50EMA.
My trade idea will be $553p for 07/25/2025. Good luck!
WSL
Monday market forecast, pay attention to the 3339 retracement📰 News information:
1. The Trump administration puts pressure on the Federal Reserve to cut interest rates
2. The continued impact of tariffs and the responses of various countries
📈 Technical Analysis:
This week's basic judgment and forecast on the gold market trend were consistent, but on Friday, the overall gold fluctuations were not large. The overall trend of the daily line fluctuated around 3345, and the 3345 line also became a short-term long-short watershed. Although prices are likely to rise more easily than fall in the short term, it should be noted that the three-month adjustment cycle is coming to an end while the fundamentals of the bull market have not changed. It is recommended that you focus on preventing risks from short position operations next week. At the same time, the overall strong shock pattern, the anti-pulling momentum has not reached the top suppression position, and the area around 3339 below is the previous intensive trading area, which constitutes a certain support in the short term. If the market fails to effectively break below next week, it will greatly boost the bullish momentum, and it is not ruled out that there will be a possibility of refreshing the high point near 3380 next week.
On the whole, the short-term focus next week is the 3345-3335 area below. If it falls back to this point, you can consider arranging long orders. The short-term target is 3355-3365, and the strong trend is expected to continue to touch 3375-3385.
🎯 Trading Points:
BUY 3345-3335
TP 3355-3365-3375-3385
In addition to investment, life also includes poetry, distant places, and Allen. Facing the market is actually facing yourself, correcting your shortcomings, confronting your mistakes, and strictly disciplining yourself. I hope my analysis can help you🌐.
TVC:GOLD PEPPERSTONE:XAUUSD FOREXCOM:XAUUSD FX:XAUUSD OANDA:XAUUSD FXOPEN:XAUUSD

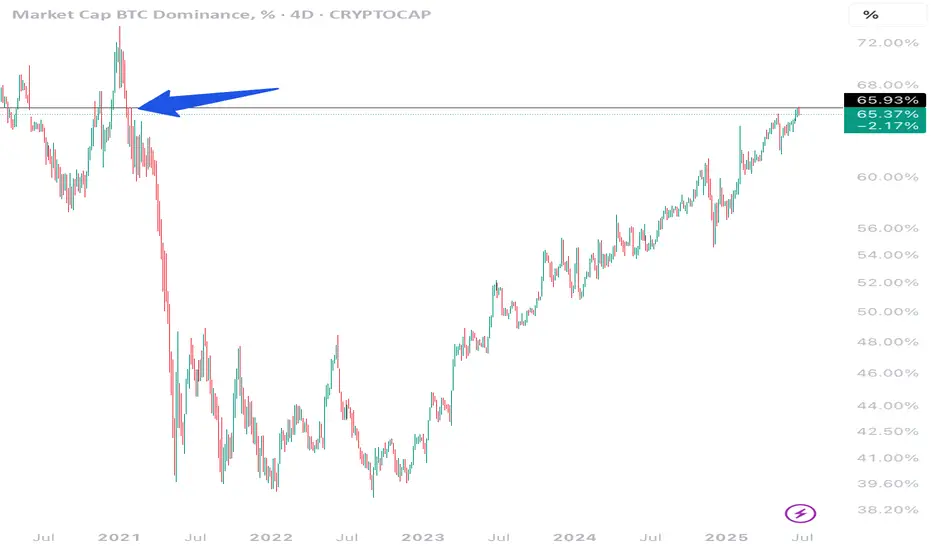
It's over for BTC Dominance, benjamin cowen is wrong hereAlt rally time :) . it will be incredibly hard to overcome this resistance on the chart. Don't listen to benjamin cowen at this point, he is too bullish on btc still. Cya in a few weeks when he changes his mind.
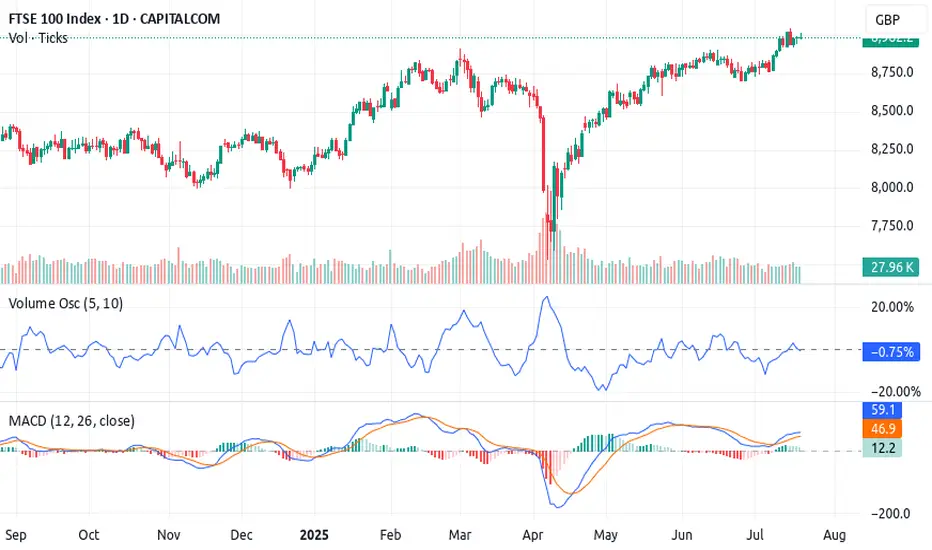
The 3-Step Rocket Booster Strategy – UK100 Bullish Breakout 🚀 The 3-Step Rocket Booster Strategy – UK100 Bullish Breakout Brewing
The UK100 Index is currently aligning perfectly with a high-probability setup I call the 3-Step Rocket Booster Strategy
— a momentum-based play designed to catch strong breakouts before the crowd reacts.
---
🔍 Strategy Breakdown:
✅ Step 1: Price above the 50 EMA
This signals short-term bullish momentum. The UK100 has cleared the 50 EMA decisively, with candles holding strong above it — suggesting buyers are stepping in aggressively.
✅ Step 2: Price above the 200 EMA
Now we’ve got long-term trend confirmation. The index is trending above the 200 EMA, meaning bulls have full control of the higher timeframe direction.
⚠️ Step 3: The Gap-Up with Volume Confirmation
Here’s the key — the "booster". We’re watching for a gap-up move , validated by a Volume Oscillator breakout . While
price has already lifted, the volume hasn’t exploded just yet — this is the final ignition phase before liftoff.
---
📈 Technical Indicators:
MACD: Bullish crossover active — momentum building
Volume Oscillator: Starting to curve upward, hinting at upcoming volume expansion
EMAs: 50 EMA > 200 EMA = confirmed bullish structure
Support Zones : Holding cleanly above recent resistance-turned-support, adding confluence
---
🟢 Trade Insight:
We are now sitting in the perfect entry zone — price is in the pocket before volume confirms . Once volume breaks out, we could see a parabolic move , especially if global market sentiment remains stable.
🎯 Potential Targets :
First target: Recent high (psychological + structural level)
Second target: Measured move based on gap range extension
Risk: A close below the 50 EMA invalidates the setup
---
🔁 Summary:
This setup ticks all three boxes of the 3-Step Rocket Booster Strategy .
The smart money is positioning before the volume shows up. The UK100 is a strong bullish candidate with low-risk entry and high reward potential — don’t ignore this one .
---
📌 Disclaimer: Always use proper risk management. Trade the setup, not the emotion.Use a simulation trading account before you trade with real money
Let me know if you’re tracking this setup too 👇
Bullish Daily Chore Strategy Entry on SilverFirst time I've spoken about this strategy here (as I don't personally trade it myself), but the "Daily Chore" is a very popular one amongst the traders I work with.
Essentially what we're looking for is for price action to be on the correct side of our 3 EMA's (8, 20 & 50), and for those EMA's to be running in the correct order.
If so, we are then looking for a pullback into the EMA's and for a pin bar rejection candles to give us a sign for entry.
This is a very difficult strategy to figure out as it requires a lot of testing and tweaks to optimize, but it also allows for a lot for freedom as it only requires a few minutes a day to check up on.
Please leave any questions or comments below and make sure to give me a follow so you don't miss my next shared trading idea.
Akil

Stock Index Weekly Analysis: ES, NQ, YMWeekly Targets (Gun to my head!)
- ES: Neutral
- NQ: Neutral
- YM: $44,186

US10Y & T-BONDS Weekly AnalysisWeekly Targets:
- US10Y: 4.412%, 4.395%, 4.375%
- T-BONDS: 113.10, 113.16, 113.23

BONKUSDT 1D Chart Analysis | Bullish Momentum is coming...BONKUSDT 1D Chart Analysis | Bullish Momentum Builds After 0.236 Fibo Pullback
🔍 Let’s break down the BONK/USDT daily chart, focusing on the latest price action, strategic moving averages, RSI convergence, and volume dynamics for a complete bullish scenario setup.
⏳ Daily Overview
BONK is showing strong upward momentum, printing consecutive higher highs (HH) in both candles and RSI—a clear bullish trend indicator. After an explosive move, price is currently staging a healthy pullback to the key 0.236 Fibonacci retracement level (0.00003142), which commonly acts as a support platform during aggressive uptrends.
📈 Technical Convergence and Trend Structure
- 3SMA Support: The 7, 25, and 99 SMAs are all trending upward and stacked correctly, with price sitting comfortably above them. The 7SMA acts as immediate dynamic support, reflecting trend strength and buyer interest at every dip.
- RSI Dynamics: RSI just bounced from the 69–70 zone, confirming convergence with price action. The indicator made its own higher high in tandem with the candles, and now, as price pulls back, RSI is reentering the overbought territory—which often precedes renewed momentum.
- Volume Confirmation: Notably, volume surged as the trend accelerated, and is now tapering off during this corrective phase. This is a classic bullish volume signature, showing profit-taking by early longs but no major selling pressure, suggesting trend continuation likely after consolidation.
🔺 Bullish Setup & Targets
- First target: 0.00005376 — retest of the last all-time high (ATH).
- Next resistance to watch: 0.00003920, followed by the ATH region.
- Long-term target: 0.00009710 — an upside of 170–180% from current levels, mapped by technical extension and price discovery zones.
📊 Key Highlights
- Price holding the 0.236 Fibo retracement signals a shallow, healthy correction.
- 3SMA alignment confirms long-term bullish bias—actively supporting every dip.
- RSI and price are convergent, reaffirming uptrend strength; RSI’s move back into overbought could ignite the next price surge.
- Volume decreasing on corrections and rising during rallies—bullish confirmation.
🚨 Conclusion
BONK/USDT remains technically poised for further upside. The blend of higher highs, support at the 0.236 Fibonacci retracement, positive 3SMA structure, and RSI convergence all point to bullish continuation. Watch for renewed momentum as RSI reenters overbought territory and volume confirms the next breakout. Next targets: 0.00005376 (ATH), with a long-term projection toward 0.00009710.

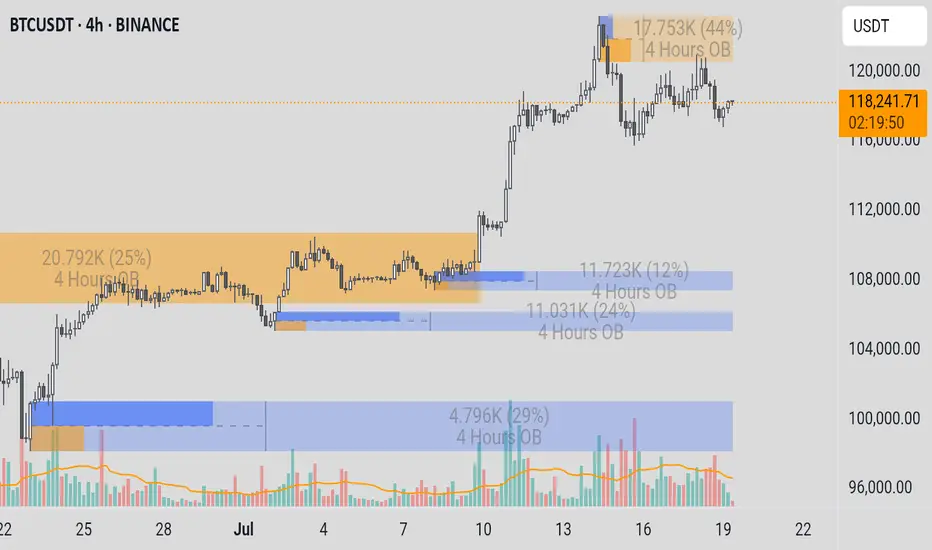
BTCUSDT BTC/USDT (Bitcoin):
Trend: Strong uptrend.
Current Conditions: Price is near key resistance around $117,000-$121,000 after a sharp rise.
Entry Recommendation: Entry is not recommended at this time. It is better to wait for a correction to the previous support area (e.g., $109,000-$111,000 or $105,000-$108,000) and look for confirmation of a bullish reversal. Entry at current levels is high risk due to the potential for a correction.
Cryptocurrency Futures Market Disclaimer 🚨🚨🚨
Trading cryptocurrency futures involves high risks and is not suitable for all investors.
Cryptocurrency prices are highly volatile, which can lead to significant gains or losses in a short period.
Before engaging in crypto futures trading, consider your risk tolerance, experience, and financial situation.
Risk of Loss: You may lose more than your initial capital due to the leveraged nature of futures. You are fully responsible for any losses incurred.
Market Volatility: Crypto prices can fluctuate significantly due to factors such as market sentiment, regulations, or unforeseen events.
Leverage Risk: The use of leverage can amplify profits but also increases the risk of total loss.
Regulatory Uncertainty: Regulations related to cryptocurrencies vary by jurisdiction and may change, affecting the value or legality of trading.
Technical Risks: Platform disruptions, hacking, or technical issues may result in losses.
This information is not financial, investment, or trading advice. Consult a professional financial advisor before making decisions. We are not liable for any losses or damages arising from cryptocurrency futures trading.
Note: Ensure compliance with local regulations regarding cryptocurrency trading in your region.
thanks for like and follow @ydnldn to have more information outlook and free signal.
About me :
"I am a passionate swing trader focused on analyzing financial markets to capture profit opportunities from medium-term price movements. With a disciplined approach and in-depth technical analysis, I concentrate on identifying trends, support-resistance levels, and price patterns to make informed trading decisions. I prioritize strict risk management to protect capital while maximizing profit potential. Always learning and adapting to market dynamics, I enjoy the process of refining strategies to achieve consistency in trading."
SOLUSDTSOL/USD (Solana):
○ Trend: Very strong uptrend (exponential increase).
○ Current Conditions: Price has reached a new high above $180 after a very rapid and significant rise.
○ Entry Recommendation: Entry is strongly discouraged at this time. The risk of a deep correction is very high. Ideally, wait for a significant correction to a strong support area (e.g., $158-$162 or $148-$152) and look for a bullish reversal signal.
Cryptocurrency Futures Market Disclaimer 🚨🚨🚨
Trading cryptocurrency futures involves high risks and is not suitable for all investors.
Cryptocurrency prices are highly volatile, which can lead to significant gains or losses in a short period.
Before engaging in crypto futures trading, consider your risk tolerance, experience, and financial situation.
Risk of Loss: You may lose more than your initial capital due to the leveraged nature of futures. You are fully responsible for any losses incurred.
Market Volatility: Crypto prices can fluctuate significantly due to factors such as market sentiment, regulations, or unforeseen events.
Leverage Risk: The use of leverage can amplify profits but also increases the risk of total loss.
Regulatory Uncertainty: Regulations related to cryptocurrencies vary by jurisdiction and may change, affecting the value or legality of trading.
Technical Risks: Platform disruptions, hacking, or technical issues may result in losses.
This information is not financial, investment, or trading advice. Consult a professional financial advisor before making decisions. We are not liable for any losses or damages arising from cryptocurrency futures trading.
Note: Ensure compliance with local regulations regarding cryptocurrency trading in your region.
thanks for like and follow @ydnldn to have more information outlook and free signal.
About me :
"I am a passionate swing trader focused on analyzing financial markets to capture profit opportunities from medium-term price movements. With a disciplined approach and in-depth technical analysis, I concentrate on identifying trends, support-resistance levels, and price patterns to make informed trading decisions. I prioritize strict risk management to protect capital while maximizing profit potential. Always learning and adapting to market dynamics, I enjoy the process of refining strategies to achieve consistency in trading."

SANDUSDTSAND/USDT (The Sandbox):
○ Trend: Strong uptrend.
○ Current Condition: Price is consolidating around $0.32-$0.33, after reaching a high of around $0.34-$0.35, and is below significant resistance at $0.39-$0.40. Volume is decreasing during the consolidation phase.
○ Entry Recommendation: Not optimal for entry at this time. It is better to wait for the price to correct to the nearest support area ($0.29-$0.30) and look for a bullish signal from there, or wait for a clear and confirmed breakout above the resistance at $0.39-$0.40 with supportive volume.
