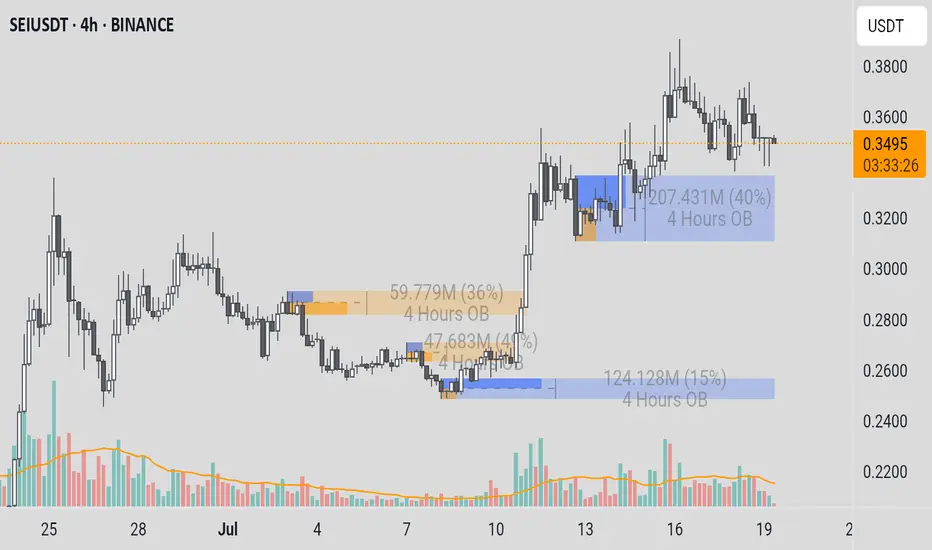
SEIUSDTSEI/USDT (SEI):
○ Trend: Strong uptrend.
○ Current Condition: Price is consolidating around $0.35, above strong Order Block support ($0.30-$0.32), but below the previous high ($0.37-$0.38). Volume appears to be decreasing during the consolidation phase.
○ Entry Recommendation: Not optimal for entry at this time. It is better to wait for a correction to Order Block support at $0.30-$0.32 and seek bullish confirmation for a safer entry, or wait for a clear breakout above $0.37-$0.38 with convincing volume.
Candlestick Analysis
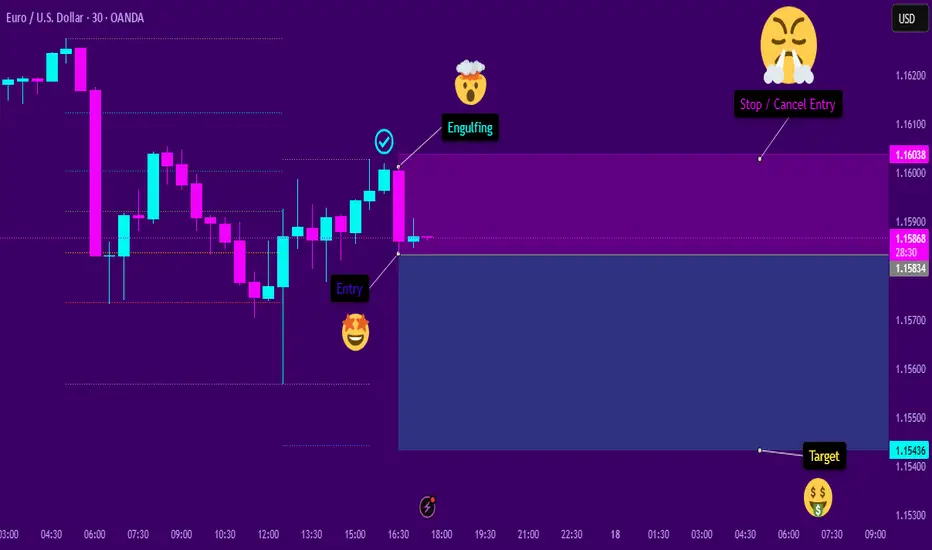
Engulfing SellThe asset shows signs of continuation in a downtrend. After a significant retracement at a favorable Fibonacci level, a bearish engulfing pattern appeared. This engulfing pattern resulted in a behavioral shift, causing the temporary pullback to resume its decline. I believe this will be the case, provided that the subsequent candlesticks confirm the entry signal.
ATM_GS : We are nearing...
Can Reliance and Banks turn Nifty around? do or die Monday. Nifty as of now has taken support at Mother line in daily chart. As expected in my Yesterday's message. So Hopefully if Big Banks Results are in line tomorrow we might see Nifty going upwards from Monday.
Mota Bhai just announced the results. EBITDA is slightly less than expected but Net Profit and Revenue is much better than Market expectation. In my view market should react positively to this result.
Supports For Nifty remain at 24932 (Mother line), 24759, 24503. As indicated earlier if we get a closing below 24503 we may see a Fall towards 24106 or 23929 (In unlikely circumstances).
Nifty Resistances remain at: 25035, 25248, 25400 and 25613 (Channel top Resistance).
Results for tomorrow
HDFC BANK
ICICIBANK
AUSMALL BANK
RBL BANK
UNION BANK
YES BANK
CENTR BANK
PUNJA BANK
CENTR BANK
So it seems like a Do or Die Monday on cards. Shadow of the candle looks neutral as of now.
Disclaimer: The above information is provided for educational purpose, analysis and paper trading only. Please don't treat this as a buy or sell recommendation for the stock or index. The Techno-Funda analysis is based on data that is more than 3 months old. Supports and Resistances are determined by historic past peaks and Valley in the chart. Many other indicators and patterns like EMA, RSI, MACD, Volumes, Fibonacci, parallel channel etc. use historic data which is 3 months or older cyclical points. There is no guarantee they will work in future as markets are highly volatile and swings in prices are also due to macro and micro factors based on actions taken by the company as well as region and global events. Equity investment is subject to risks. I or my clients or family members might have positions in the stocks that we mention in our educational posts. We will not be responsible for any Profit or loss that may occur due to any financial decision taken based on any data provided in this message. Do consult your investment advisor before taking any financial decisions. Stop losses should be an important part of any investment in equity.
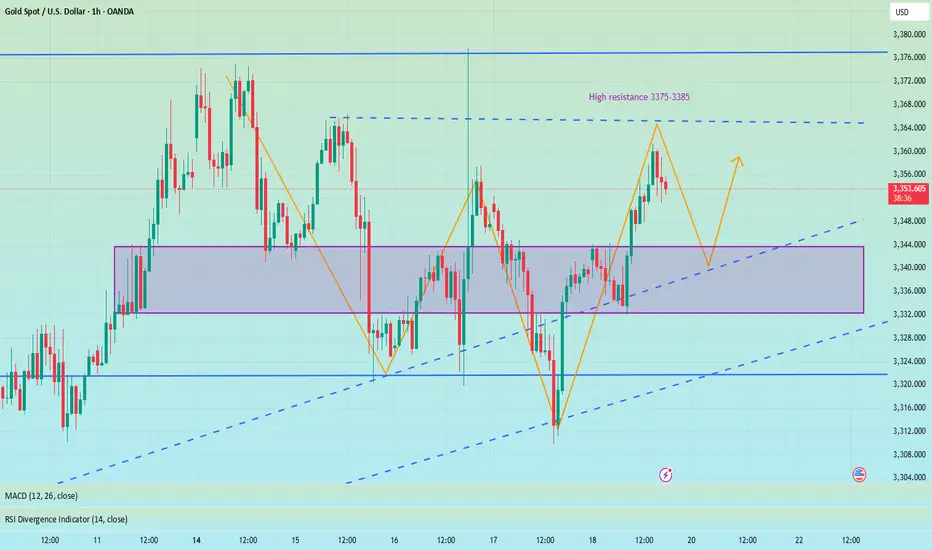
Long and short fluctuations, the market is waiting for a break📰 News information:
1. Powell responds to White House issues
2. Will other countries impose reciprocal sanctions on tariffs?
📈 Technical Analysis:
Although the MACD indicator of the gold hourly line formed a golden cross, the market reached a high of around 3361, and the RSI indicator was close to the overbought area, so we need to be cautious about corrections. From the 4H chart, the MACD second golden cross is on the zero axis. Currently, we are paying attention to the moving average SMA5 near 3343, and the SMA60 support line 3332. If the 4H upward trend falls back, we need to go long. At present, gold is still running above, and there is no good participation point in the short term, but on the whole, we should pay attention to the support of 3345-3332 below, and we can consider going long if it retreats and stabilizes. We continue to pay attention to the resistance pressure of 3375-3385 above, and we can try to go short if it does not break.
🎯 Trading Points:
SELL 3375-3385
TP 3365-3355
BUY 3345-3332
TP 3365-3375-3385
In addition to investment, life also includes poetry, distant places, and Allen. Facing the market is actually facing yourself, correcting your shortcomings, facing your mistakes, and exercising strict self-discipline. I share free trading strategies and analysis ideas every day for reference by brothers. I hope my analysis can help you.
FXOPEN:XAUUSD OANDA:XAUUSD FX:XAUUSD FOREXCOM:XAUUSD PEPPERSTONE:XAUUSD TVC:GOLD
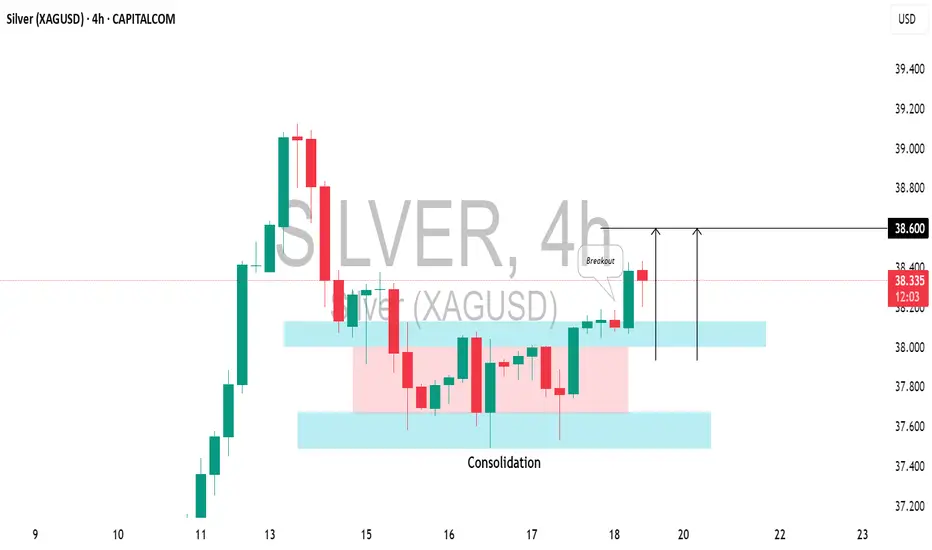
SILVER (XAGUSD): Bullish Move ConfirmedIt appears that the local correction on 📈SILVER has completed, and the pair is shifting back to a bullish trend.
Today's US economic data caused the pair to break through a resistance level within a narrow consolidation range on the 4-hour chart.
The price is expected to rise to the 38.60 level.
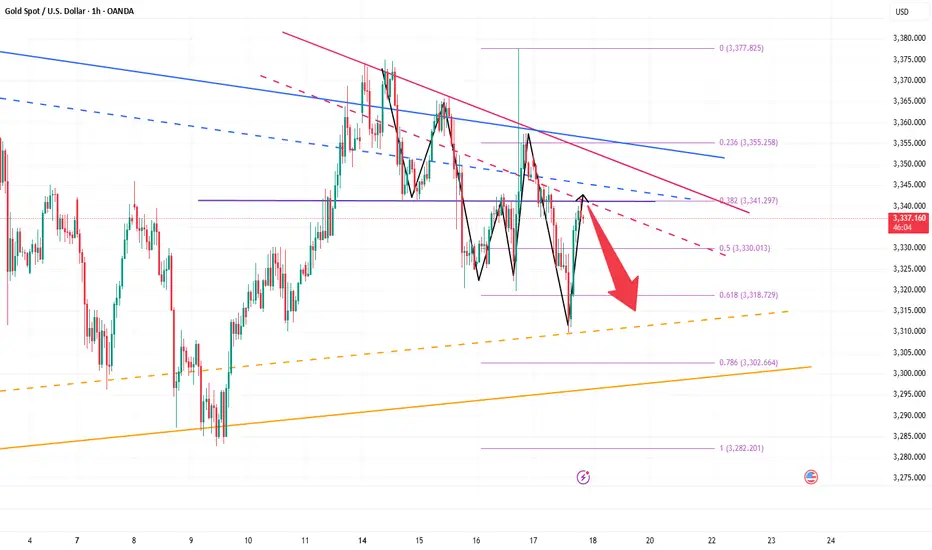
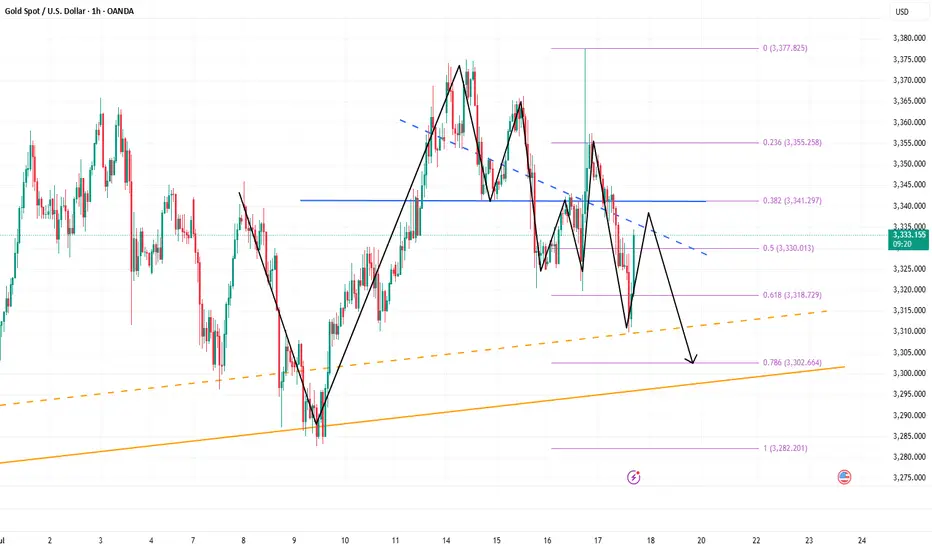
The short-selling idea remains unchanged, defend 3355📰 News information:
1. Powell responds to White House issues
2. Will other countries impose reciprocal sanctions on tariffs?
📈 Technical Analysis:
Gold closed with a long lower shadow on the daily line yesterday and closed with a doji on the hourly line. In the short term, gold may continue to rise and is expected to touch the 3355 line. If gold cannot break through and stabilize above 3355, then gold may fall back. We can still consider shorting, and the target can be 3330. If the trend is as expected, it may form the embryonic form of a head and shoulders bottom. On the contrary, if the gold price breaks through 3355, stop loss on short positions and pay attention to the high resistance of 3375-3385.
🎯 Trading Points:
SELL 3340-3355
TP 3330-3320
In addition to investment, life also includes poetry, distant places, and Allen. Facing the market is actually facing yourself, correcting your shortcomings, facing your mistakes, and exercising strict self-discipline. I share free trading strategies and analysis ideas every day for reference by brothers. I hope my analysis can help you.
TVC:GOLD PEPPERSTONE:XAUUSD FOREXCOM:XAUUSD FX:XAUUSD OANDA:XAUUSD FXOPEN:XAUUSD

Nifty Analysis EOD – July 18, 2025 – Friday🟢 Nifty Analysis EOD – July 18, 2025 – Friday 🔴
“Deep Dive Below 25K – Bounce or Breakdown Ahead?”
As we discussed yesterday, a big move was on the cards — and Nifty delivered.
The index started flat to negative, and from the opening tick, sellers took firm control. It sharply broke through multiple key supports: PDC, PDL, S1, the important 25,080–25,060 support zone, swing low, 25,000–24,980, and even 24,965.
Buyers finally showed up near 24,920, a crucial level, and pulled off a modest 86-point recovery. The session ended at 24,968.40, still below the psychological 25,000 mark and the fractal swing low of July 14.
🕯 5 Min Time Frame Chart with Intraday Levels
🔍 Mixed Signals:
✅ Positive: Today’s low aligns with the 0.618 Fib retracement from the June 13 low to June 30 high — potential support zone.
✅ Positive: RSI(3 of 3) shows bullish divergence — early reversal sign?
❌ Negative: Closed below July 14 swing low — weak structural signal.
❌ Negative: Below 25,000 — psychological breakdown.
❓Now the big question: Will this bearish move continue, or is it a fakeout before reversal?
You're still bullish on the overall daily trend, but tactically bearish for intraday until a close above 25,125 confirms strength.
🕯 Daily Time Frame Chart For Additional View
🕯 Daily Time Frame Chart with Intraday Levels
🕯 Daily Candle Breakdown
Open: 25,108.55
High: 25,144.60
Low: 24,918.65
Close: 24,968.40
Change: −143.05 (−0.57%)
📊 Candle Structure Breakdown
Real Body: 140.15 pts → Large red bearish body
Upper Wick: 36.05 pts → rejection near early highs
Lower Wick: 49.75 pts → dip buying near 24,920
🔍 Interpretation
Mildly negative open with early strength attempt near 25,140
Sharp decline through major support zones
Buyers stepped in at 24,920, but recovery lacked follow-through
Close below 25K and key swing low confirms steady intraday selling pressure
🕯 Candle Type
Strong Bearish Candle with both wicks — sellers dominated, but not without some resistance from buyers at the lows.
📌 Key Insight
Short-term bearish momentum confirmed
24,920–24,890 is next critical support; breakdown may extend to 24,882–24,825
Bulls need to close above 25,125+ to reclaim control
🛡 5 Min Intraday Chart
⚔️ Gladiator Strategy Update
ATR: 181.56
IB Range: 126.45 → Medium IB
Market Structure: 🔴 Imbalanced
🟢 Trades Triggered:
09:42 AM – Short Trade → ✅ Trailed SL Hit Profit (R:R = 1 : 3.87)
📌 Support & Resistance Levels
Resistance Levels:
24,980 ~ 25,000
25,080 ~ 25,060
25,125
25,168
25,180 ~ 25,212
Support Levels:
24,965
24,894 ~ 24,882
24,825
24,800 ~ 24,768
💭 Final Thoughts
“Sometimes markets fall not to reverse, but to recharge.”
Today’s drop pierced major support zones, but the bounce from 0.618 Fib hints at possible resilience.
Structure needs clarity — Monday’s session will reveal whether this was a trap or fuel for bears.
✏️ Disclaimer
This is just my personal viewpoint. Always consult your financial advisor before taking any action.

Pre-Market Prep 7.18.2025What it do, everyone! Here’s my pre-market prep for Friday, July 18th. Just to give you a quick overview, I'm using my prior value areas, the prior day's high and low, and the CVA levels from my market profile. I use all this history to help me plan my trades for the day.
So, starting with the S&P, as of now we’re green across the board. We’re in balance up from the prior day’s range, value area, and the CVA. My main plan is to look for acceptance and a pullback to a confluence area for longs. If we get rotational and break out of that area, I’m ready to go short.
For the NASDAQ, it's a similar story. We’re rotational in the prior value area and range, but we’re balanced up from the recent CVA. Right now, I’m waiting to see if we can confirm acceptance and then I’ll look for a short from that rotational area down to the prior value area low.
In the Russell, I’m seeing clear acceptance above all levels, so a pullback to the confluence area for a long would be ideal.
For Gold, I’m also seeing it in balance up on all fronts. My first move would be a long from the prior day’s high. If we drop a bit lower, I’ll be looking at that CVA and PVA area for another long.
The Euro is a bit more mixed. We’re rotational in the prior day’s range but balanced up in the value area and CVA. I want to clear the prior day’s high before taking any big moves.
The Yen is also rotational, so I’m looking to trade the extremes, maybe some scalps while we’re balanced in the prior value area.
For the Aussie Dollar, we’re in balance up from the PVA, but rotational in the prior day’s range and CVA. I’m looking for shorts near the top area and longs at the bottom, staying out of the middle for now.
And finally, Crude Oil is rotational on all fronts. My first plan is to look for shorts from the confluence area down to the prior day’s range.
That’s my pre-market prep for today. Let’s trade smart. Happy Friday, peace!

Bottom-out rebound, 3338 short orders enteredYesterday, the gold market was affected by Trump's remarks about firing Federal Reserve Chairman Powell. After briefly falling below 3320, the price quickly rose by nearly 60 points, reaching a high of 3377. Trump later clarified that the news was false, triggering a gold sell-off, and the market rose and fell. As of Thursday's European session, gold prices fell back to around 3320. After a rapid rise and fall in the US market on Wednesday, the downward trend continued on Thursday, with the US market hitting a low of 3310 before rebounding. Judging from the 4-hour chart, the Bollinger Bands failed to open downward, indicating that the current market lacks continuity and the overall market remains in a volatile pattern. In a volatile market, it is recommended to pay attention to key support and resistance levels for high-selling and low-buying operations. The upper resistance range is currently at 3343-3351, and the important watershed support level below is at 3310.
OANDA:XAUUSD

AUDCAD SHORTMarket structure bearish on HTFs 3
Entry at both Weekly and Daily AOi
Weekly Rejection at AOi
Weekly Previous Structure Point
Weekly Rejection at AOi
Daily Rejection at AOi
Daily Previous Structure Point
Around Psychological Level 0.89500
H4 EMA retest
H4 Candlestick rejection
Rejection from Previous structure
Levels 4.17
Entry 120%
REMEMBER : Trading is a Game Of Probability
: Manage Your Risk
: Be Patient
: Every Moment Is Unique
: Rinse, Wash, Repeat!
: Christ is King.


USDCAD: Bearish Move From Resistance 🇺🇸🇨🇦
USDCAD is going to retrace from a key daily resistance.
A bearish imbalance candle that the price formed after its test
during the Asian session provides a strong intraday bearish confirmation.
Goal - 1.3707
❤️Please, support my work with like, thank you!❤️
I am part of Trade Nation's Influencer program and receive a monthly fee for using their TradingView charts in my analysis.

BullsA new all time high 3500 is on the horizon. We have been on a trendline(1 Day) resistance region. A buy towards the target is the goal.
NB break below invalidates this analysis

GBPUSD ANALYSIS From the previous trading day we can see that the pair has been making random up and down movements without a clear direction and even though we rejected a key support area the higher timeframes like daily and weekly still show bearish sentiment right now the best move is to wait

5 Proven Tricks to Trade Without FOMO After Missing Your TriggerYo traders! In this video, I’m breaking down what to do if you miss a trading trigger , so you can stay calm , avoid FOMO , and still catch the next move. We’re diving into five solid strategies to re-enter the market without losing your cool:
Buy on the pullback zone.
Buy with an engulfing candle after a pullback.
Buy after breaking the resistance formed by the pullback.
Buy after the second wave with an indecision candle.
Buy after breaking a major resistance post-second wave, confirmed by RSI or momentum oscillators.
These tips are all about keeping your trades smart and your head in the game. For more on indecision candles, check out this lesson . Wanna master breakout trading? Here’s the breakout trading guide . Drop your thoughts in the comments, boost if you vibe with it, and let’s grow together! 😎

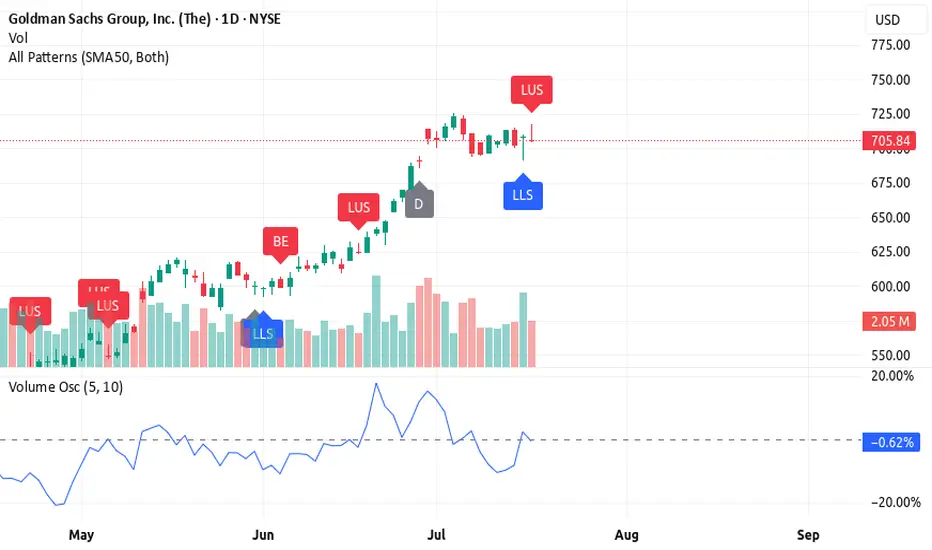
3 Reasons Why Goldman Sachs (GS) Still Looks Bullish🚀 3 Reasons Why Goldman Sachs (GS) Still Looks Bullish (Despite a Bearish Candle)
Goldman Sachs is in a bullish trend, but the latest candlestick is flashing a warning. Here's why GS still looks strong — and what to watch for next 📈
1️⃣ Candlestick pattern – long upper shadow
The long upper shadow shows sellers pushed the price down from the highs, signaling resistance. While bearish short-term, it often happens during strong trends as the market breathes before pushing higher.
2️⃣ High volume on a bearish candle
The negative volume shows resistance, but it may actually represent bear exhaustion. High volume without a breakdown
suggests bears tried to push it down — and failed. Classic fake-out.
3️⃣ Volume oscillator still rising
Despite the pullback candle, the volume oscillator is holding above zero and trending up, showing momentum is still on the bulls' side.
🔥 Rocket Booster Strategy still intact
✅ Price above 50 EMA
✅ Price above 200 EMA
⚠️ Just a temporary shakeout? If the next candle confirms support, GS may continue the bullish push.
⚠️ Disclaimer: Always use a simulation (demo) account before trading with real money. Learn proper risk management and profit-taking strategies to protect your capital.
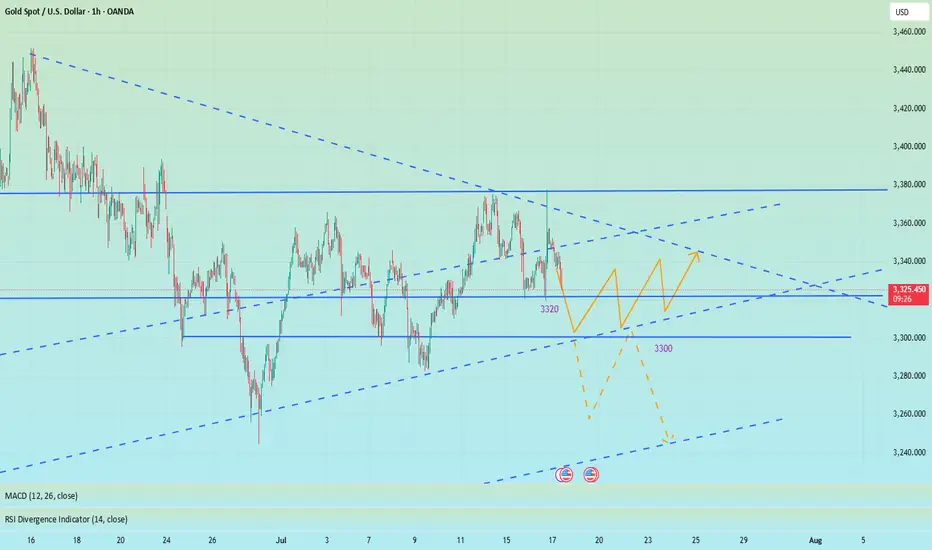
Gold’s Last Stand? Major Retest at 3310–3300 Under the influence of negative news, gold today fell below the recent low of 3320 and continued to fall to around 3310. The current gold structure looks particularly obvious, the center of gravity of gold gradually moves downward, and the short trend is extremely obvious; however, as gold repeatedly probes the 3320-3310 area, we can clearly see the resistance of gold to falling, and multiple structural supports are concentrated in the 3320-3300 area. So as long as gold does not fall below this area, gold bulls still have the potential to rebound.
However, for now, after experiencing discontinuous sharp rises and falls, gold needs to undergo a short-term technical repair, so it may be difficult for a unilateral trend to appear in the short term. So I have reason to believe that gold will focus on rectification and repair next. The important resistance area we have to pay attention to above is in the 3340-3350 area; and the important support below is in the 3310-3300 area.
Currently, gold is fluctuating in a narrow range around 3340, and the short-term rebound momentum is sufficient, but I still believe that gold will fall back again and test the support of 3320-3300 area after consuming the bullish energy. So for short-term trading, first of all, I advocate shorting gold in the 3340-3350 area, and expect gold to retreat to the 3320-3300 area during the consolidation process.
3340-3300: Lock in the buy high and sell low in this area!Under the influence of unemployment benefits and zero monthly sales data, gold fell sharply in the short term, but it did not effectively fall below 3310 during multiple tests, effectively curbing the further downward space of the shorts. Multiple structural supports are also concentrated in the 3310-3300 area, so as long as gold does not fall below this area, gold bulls still have the potential to rebound.
However, for the current gold market, it may be difficult to see a unilateral trend in the short term. After experiencing discontinuous surges and plunges, gold may focus on consolidation and repair, and the consolidation range may be limited to the 3340-3300 area.
So for short-term trading, first of all, I advocate going long on gold in the 3320-3310 area, and expect gold to rebound and reach the 3330-3340 area;
If gold reaches the 3335-3345 area as expected, we can start to consider shorting gold, and expect gold to step back to the 3320-3310 area during the shock and rectification process.
Nifty Analysis EOD – July 17, 2025 – Thursday🟢 Nifty Analysis EOD – July 17, 2025 – Thursday 🔴
📉 Sellers Grip Expiry Day — Big Move Loading?
Nifty started again with an OH (Open = High) formation and slipped down 94 points before 10:30 AM, marking the day’s low at 25,144. During this fall, it broke the support zone of 25,212 ~ 25,180. Although a retracement followed, it couldn’t sustain above the mean and eventually broke below the previous day’s low (PDL), closing at 25,111.45.
The weekly expiry was wild and volatile — especially from 12:30 to 2:30 PM. Interestingly, if we consider the total range of the last three sessions, it is just 166 points — well below average. This suggests a phase of consolidation. A significant move may emerge once Nifty decisively breaks the broader zone of 25,000 to 25,255.
🕯 5 Min Time Frame Chart with Intraday Levels
🕯 Daily Time Frame Chart with Intraday Levels
📊 Daily Candle Breakdown
Open: 25,230.75
High: 25,238.35
Low: 25,101.00
Close: 25,111.45
Change: −100.60 (−0.40%)
Candle structure breakdown:
Real body:
Red candle (Close < Open): 25,230.75 − 25,111.45 = 119.30 points → Decent-sized bearish body
Upper wick:
25,238.35 − 25,230.75 = 7.60 points → Very small
Lower wick:
25,111.45 − 25,101.00 = 10.45 points → Small
Interpretation:
Nifty opened slightly lower, made a weak attempt upward, then saw consistent selling throughout the day, closing near the session’s low. The negligible wicks indicate that sellers were in full control, and buyers had little room to fight back.
Candle Type:
A strong bearish candle (almost Marubozu) with very small wicks → Clear dominance by sellers.
Key Insight:
The test of the 25,100 zone again shows weakening bullish strength.
If the next session breaks below 25,100, the fall may extend toward 25,000–25,050.
For bulls to regain short-term momentum, a close above 25,200–25,220 is necessary.
🛡 5 Min Intraday Chart
⚔️ Gladiator Strategy Update
ATR: 176.62
IB Range: 60.85 → Medium IB
Market Structure: Balanced
Trades Triggered:
🕒 10:53 AM – Long Trade → Trailed SL Hit Profit (R:R = 1:0.42)
🧭 What’s Next? / Bias Direction
The market is coiling within a narrow range across multiple sessions, hinting at a potential breakout move.
📌 Watch Zone: 25,000 to 25,255
🔻 A break below 25,000 may open 24,950–24,900
🔺 A close above 25,260 could drive price toward 25,350+
Bias remains neutral-to-bearish unless bulls reclaim 25,220 decisively.
🧱 Support & Resistance Levels
Resistance Levels
25,168
25,180 ~ 25,212
25,260
25,295 ~ 25,315
Support Levels
25,125
25,080 ~ 25,060
25,000 ~ 24,980
24,965
🧠 Final Thoughts
"Structure is key. When levels work, respect them. When they break, adapt."
Three sessions of compression hint at expansion soon — stay alert and trade level-to-level with discipline.
✏️ Disclaimer
This is just my personal viewpoint. Always consult your financial advisor before taking any action.

Treat it as a long-short wash-out shock, and go long on pullback📰 News information:
1. Initial jobless claims data
2. June retail data
3. Beware of Trump's remarks about firing Powell
📈 Technical Analysis:
Last night, the daily line closed at around 3347. The current short-term daily line range is 3355-3300. The short-term support below is still 3320. Once it falls below 3320, it will look to 3310-3300. Short-term trading is still volatile. If the intraday retracement reaches 3320-3310, consider going long, and the defense is 3300, with the target at 3340-3350. Under the current rhythm of long and short wash, don't chase the rise and sell the fall, look at it rationally, and brothers who trade independently must bring SL.
🎯 Trading Points:
BUY 3320-3310
TP 3340-3350
In addition to investment, life also includes poetry, distant places, and Allen. Facing the market is actually facing yourself, correcting your shortcomings, facing your mistakes, and exercising strict self-discipline. I share free trading strategies and analysis ideas every day for reference by brothers. I hope my analysis can help you.
FXOPEN:XAUUSD OANDA:XAUUSD FX:XAUUSD FOREXCOM:XAUUSD PEPPERSTONE:XAUUSD TVC:GOLD
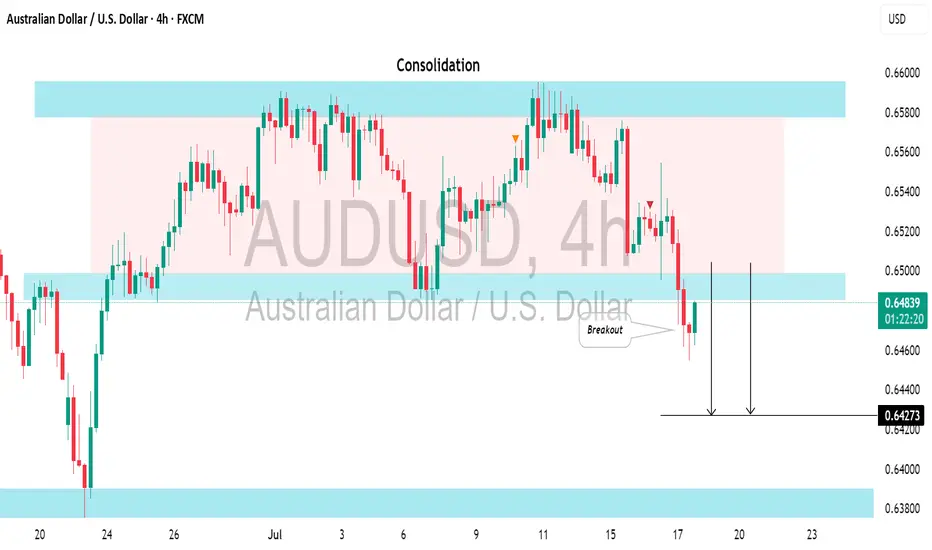
AUDUSD: Strong Bearish Signal?!The AUDUSD appears to be bearish following a few weeks of consolidation.
And a bearish breakout from the support of a sideways range serves as a strong confirmation signal.
We can anticipate a decline to at least the 0.6427 level.
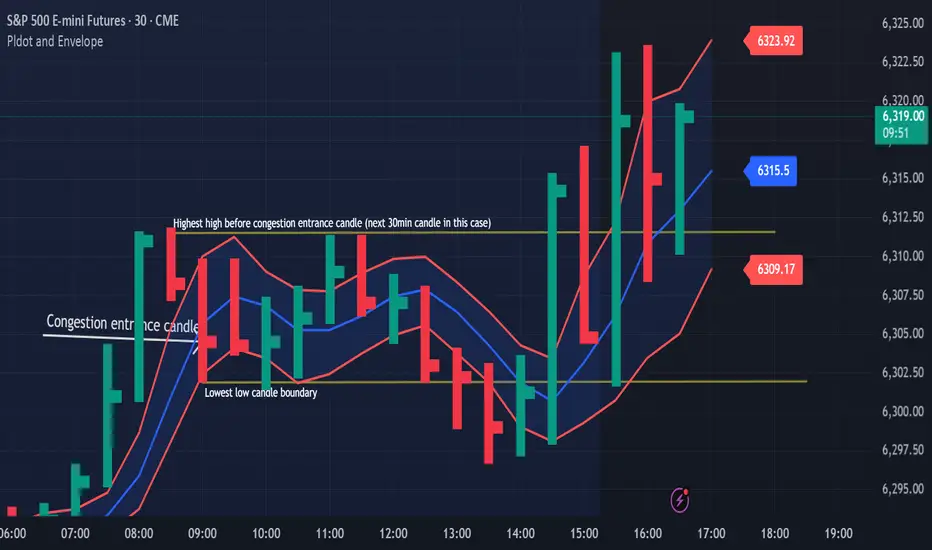
Congestion Action vs Congestion Exit – Mastering the TransitionWhen markets go quiet and churn sideways, it’s easy to get lost in the noise. But inside that congestion lies opportunity — if you understand the difference between "Congestion Action" and "Congestion Exit." Here’s how to apply Drummond Geometry to trade these phases with precision:
🔹 Congestion Action
Congestion action is when the market is not ready to trend — it's swinging back and forth within a defined range, between a strong block level and a well-established dotted line. Think of it as a "resting zone" before the next directional move.
📏 Original Confines: Highest high and lowest low after a congestion entrance as shown on the chart
🚧 Expanded Confines: Price temporarily breaks out of the range but doesn’t establish a trend (3 closes on the came side of the PLdot (blue line)).
🧲 This is where scalpers and range traders thrive. Look for setups near envelope confines and use nearby energy fields.
✅ Trade Plan: Play the range — buy support, sell resistance — until proven otherwise.
🔸 Congestion Exit
This is when the market transitions from ranging to trending — a trend run begins from within the congestion zone.
🚀 First bar of a new trend closes outside the congestion confines (either the block level (highest high on the chart) or the dotted line (the low on the chart)).
📊 The next bar must confirm with a trend run close — if not, it’s a failed breakout. You can see on the chart that price tried to trend lower but the trend was not confirmed!
⚡ Patterns to watch:
Energy pushing in the direction of the exit (PL Dot push, c-wave continuation).
6-1 lines against the breakout direction disappear.(Not visible in this version)
Resistance/support against the exit breaks.
✅ Trade Plan: Enter on breakout confirmation, not just the breakout bar. Measure energy and watch the follow-through.
🧭 Tip:
Don't get faked out. If price re-enters congestion after a breakout, re-draw the boundaries — the old congestion is no longer valid.
🔥 Bottom Line:
Congestion Action is where the market breathes. Congestion Exit is where it moves. Mastering the handoff between the two gives you a decisive edge.
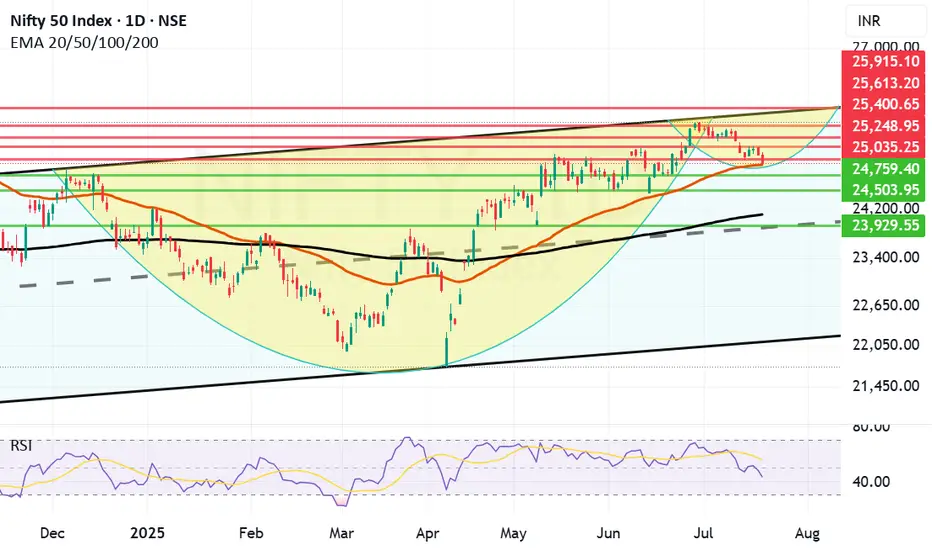
If Mother Line Support will hold, we might see a C&H formation. Although we saw a negative closing today, the chart suggests that if Mother line support will hold we might see a reversal and a Cup and Handle Formation in the near future. Cup and Handle formation is a great pattern which can help us reach the previous high and surpass it. If it happens or not only time can tell.
Supports For Nifty right now remain at: 25035, 24930 (Important Mother Line Support of Daily chart), 24759 and 24503. If 24503 is broken then there will be overall weakness in the market and we can see Nifty plummeting to 24097 (Father Line Support of Daily chart). Just below 24907 there will also be the mid channel support of 23929. (Just in case we reach there).
Resistances For Nifty Remain at: 25248, 25400, 25613 and 25915 seems to be the channel top as of now.
Nifty is delicately placed and the support of 24930 and Resistance of 25248 are the key levels to be watched. Above 25248 Bulls become strong. Below 24930 Bears become strong. Right now we are in no man's land with shadow of the candle slightly negative. If we see a bounce tomorrow or from the Mother line the shadow will has potential to turn positive later in the day tomorrow or next week.
Short term Outlook: Neutral to negative.
Medium Term Outlook: Neutral to Positive.
Long Term Outlook: Positive.
Disclaimer: The above information is provided for educational purpose, analysis and paper trading only. Please don't treat this as a buy or sell recommendation for the stock or index. The Techno-Funda analysis is based on data that is more than 3 months old. Supports and Resistances are determined by historic past peaks and Valley in the chart. Many other indicators and patterns like EMA, RSI, MACD, Volumes, Fibonacci, parallel channel etc. use historic data which is 3 months or older cyclical points. There is no guarantee they will work in future as markets are highly volatile and swings in prices are also due to macro and micro factors based on actions taken by the company as well as region and global events. Equity investment is subject to risks. I or my clients or family members might have positions in the stocks that we mention in our educational posts. We will not be responsible for any Profit or loss that may occur due to any financial decision taken based on any data provided in this message. Do consult your investment advisor before taking any financial decisions. Stop losses should be an important part of any investment in equity.
