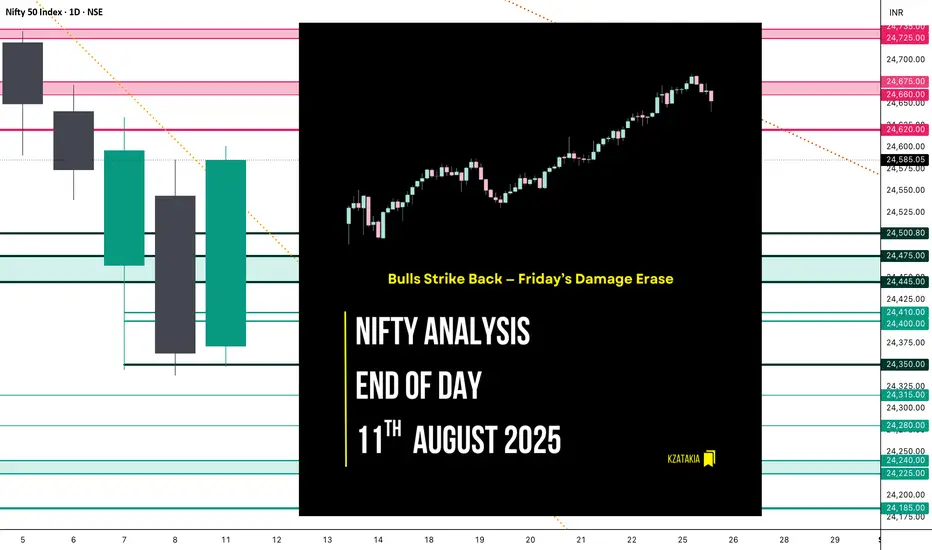
Nifty Analysis EOD – August 11, 2025 – Monday🟢 Nifty Analysis EOD – August 11, 2025 – Monday 🔴
Bulls Strike Back — Friday’s Damage Erase
📝 Nifty Summary
Nifty opened 29 points higher and quickly filled the gap. At the previous day’s close, it took support and marked the day’s low at 24,347.45 — which remained untouched for the rest of the session. From there, it fought through each resistance level, climbed to the previous day’s high, and marked a day high of 24,600.85.
A mild 40-point dip followed, but the index still closed strong at 24,560.45, reclaiming all of Friday’s losses and nearly matching Thursday’s close (just 11 points short).
The question now:
a) Was this just a dead cat bounce?
b) Or the start of a base-building phase after oversold conditions?
c) Or was it fueled by some positive news? (No major news tracked today)
Whatever the cause, bulls are back in the zone. To maintain positive momentum, tomorrow’s close needs to be above 24,650.
🛡 5 Min Intraday Chart with Levels
📉 Daily Time Frame Chart with Intraday Levels
📉 Daily Candle Breakdown
Open: 24,371.50
High: 24,600.85
Low: 24,347.45
Close: 24,585.05
Change: +221.75 (+0.91%)
Structure Breakdown
Candle Type: Green (Close > Open)
Body Size: 213.55 points (near-full body)
Upper Wick: 15.80 points (tiny)
Lower Wick: 24.05 points (small)
Interpretation
Strong bullish control: Open near the low, close near the high.
Minimal wicks show decisive directional movement with little intraday rejection.
Fully recovered from Friday’s sell-off — almost engulfing it.
Candle Pattern: Bullish Marubozu (near-full body) — often a sign of potential upside continuation if volume supports the move.
📊 Short-Term View (from August 8, 2025 reference)
Price reclaimed the 24,460 resistance zone and closed above it.
Momentum shifted from bearish to bullish.
Next watch: 24,620-24,675 supply zone, and 24,700 psychological mark.
Range & Bias
Support Zone: 24,475 – 24,445
Resistance Zone: 24,660, 24,725
Bias: Bullish above 24,460
Trading Insight
If buyers hold above 24,460, next target is 24,725.
Rejection there may trigger a quick pullback toward 24,500.
🛡 5 Min Intraday Chart
⚔ Gladiator Strategy Update
ATR: 214.75
IB Range: 80.95 → Medium
Market Structure: Balanced
Trade Summary:
10:20 AM: Long Entry → Target Hit (R:R = 1:2.65)
🗺 Support & Resistance Levels
Resistance Zones:
24,620
24,660 ~ 24,675
24,725 ~ 24,735
24,780
Support Zones:
24,500
24,475 ~ 24,445
24,410 ~ 24,400
24,350
💭 Final Thoughts
Strong comeback by the bulls today, erasing Friday’s weakness in one swift move. Whether it’s a one-off bounce or the start of something bigger will be clearer after tomorrow’s close.
"Structure is key. When levels hold, momentum follows — when they break, so does conviction."
✏️ Disclaimer
This is just my personal viewpoint. Always consult your financial advisor before taking any action.
Candlestick Analysis
After Many Full Moons Have PassedAs subject, finally BTPS out from bearish structure.
Long
Target as fibo
DYOR
Trade with your own decision

AMRT.. Looks GoodSimple and to the point, as subject...
Based TA : fibo, trendlines, candles
DYOR
Trade with your own decision

ETH season or Altseason ?In this article, we’ll review what the market has done so far and where the money flow has been leaning—toward altcoins or toward Ethereum.
As you can see, Ethereum has turned into a kind of black hole: whenever Bitcoin takes a breather, ETH pulls in most of the capital, and only a small trickle reaches altcoins.
What we see across most other altcoins isn’t much—at best, they snap back to prior levels. Think of SOL or those alts tied to “centralization/compliance” narratives. Otherwise, for now, the market is largely defined by Bitcoin and Ethereum’s moves.
Disclaimer
This is market commentary and reflects my personal opinion. It is not investment advice, a recommendation, or a solicitation to buy or sell any asset. Crypto markets are highly volatile and you can lose part or all of your capital. Always conduct your own research, make independent decisions, and use strict risk management (position sizing, stop-losses, scenario planning). Past performance is not indicative of future results. For guidance tailored to your situation, consult a licensed financial advisor.
#ETH #BTC.D #ETHBTC #BTCUSDT #Crypto #Candlestick #MarketStructure #Momentum #RiskManagement #PsychologicalLevel

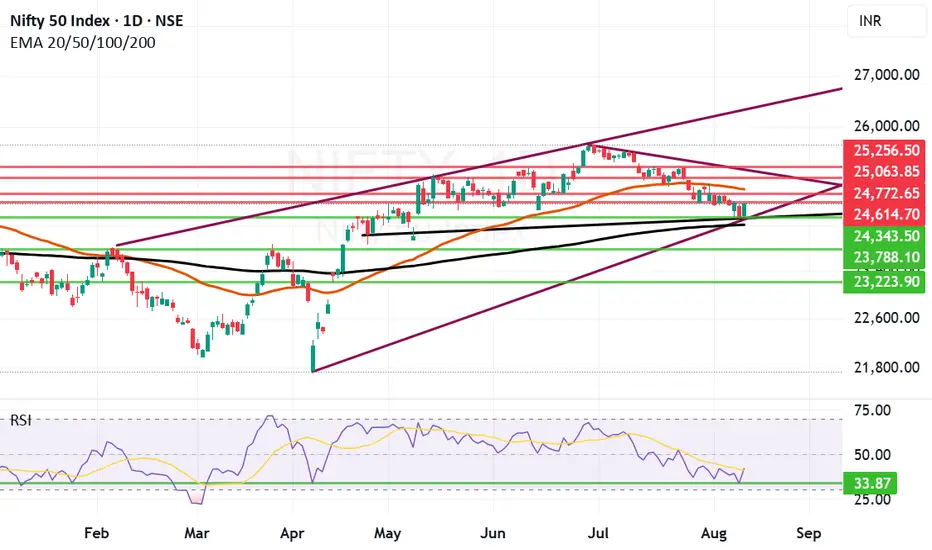
Good Bounce by Nifty from Technical RSI Support zone. We saw a good comeback and bounce by Nifty from a Technical RSI support zone which is around 33. We can by no means call this start of a Bull rally as of now. For Bull Rally to sustain we need a closing on Nifty above 24842. In such a scenario if we get a closing above 24842 the Bulls will feel comfortable. Bulls can breath easy only after we get a closing above 25256 zone. Above 25256 the Bulls can take control of the market. With Nuclear threats flowing around and still Tariff related issues prevailing it looks difficult for Bulls to take proper control of the market. The bounce we saw today can be credited to few reasons mentioned below:
1) Government announcement to support the sectors that will be most affected by Tariffs.
2) Some noises from within the Government to increase the spending to compensate for the GDP loss due to Tariff situation.
3) Silver lining in the clouds which are showing due to the upcoming Trump-Putin talks, Indian PM's proposed China visit.
4) RBI has allowed Indian banks to open special Vostro accounts to facilitate international trade settlements. (However if this has built positive sentiment is something which is yet to be fully understood). Also I am not an expert to understand the framework under which these accounts will work or how it will benefit our companies is a matter of economic experts to study.
With all this buildup the supports for Nifty remain at: 24343 and 24204. Below 24204 closing or weekly closing the Bears will take total control of the market and drag Nifty below 24K towards 23788 or 23223. Most important support remains at 24204 (Father line Support of Daily charts).
Nifty Resistances remain at: 24614, 24772, 25063 and finally 25256. Above 25256 Bulls can take control of the market and we will comment above further levels when we get there.
Disclaimer: The above information is provided for educational purpose, analysis and paper trading only. Please don't treat this as a buy or sell recommendation for the stock or index. The Techno-Funda analysis is based on data that is more than 3 months old. Supports and Resistances are determined by historic past peaks and Valley in the chart. Many other indicators and patterns like EMA, RSI, MACD, Volumes, Fibonacci, parallel channel etc. use historic data which is 3 months or older cyclical points. There is no guarantee they will work in future as markets are highly volatile and swings in prices are also due to macro and micro factors based on actions taken by the company as well as region and global events. Equity investment is subject to risks. I or my clients or family members might have positions in the stocks that we mention in our educational posts. We will not be responsible for any Profit or loss that may occur due to any financial decision taken based on any data provided in this message. Do consult your investment advisor before taking any financial decisions. Stop losses should be an important part of any investment in equity.
BTC perfectly hits $120K, latest BTC analysis and operations#BTCUSD
After nearly a week of volatile consolidation, BTC once again touched around 120,000. I have already made it clear to everyone before that once BTC stabilizes above 116,500, it may first touch 118,000 and then challenge the macro resistance level of 120,000. I think anyone who had carefully reviewed the strategy and thought seriously about the ideas behind it would have made substantial profits. Currently, BTC maintains an overall upward trend, but may face the risk of an overbought pullback in the short term. Those with sufficient funds in their accounts can consider shorting with a light position. BTC may reach 118,000-117,000 and stabilize before rebounding.

Gold Sell At the Daily TF- Gold has reached a previous order block.
- plenty wick rejections
- engulfing candle down for a sell
- previous liquidity is pulling it down a little

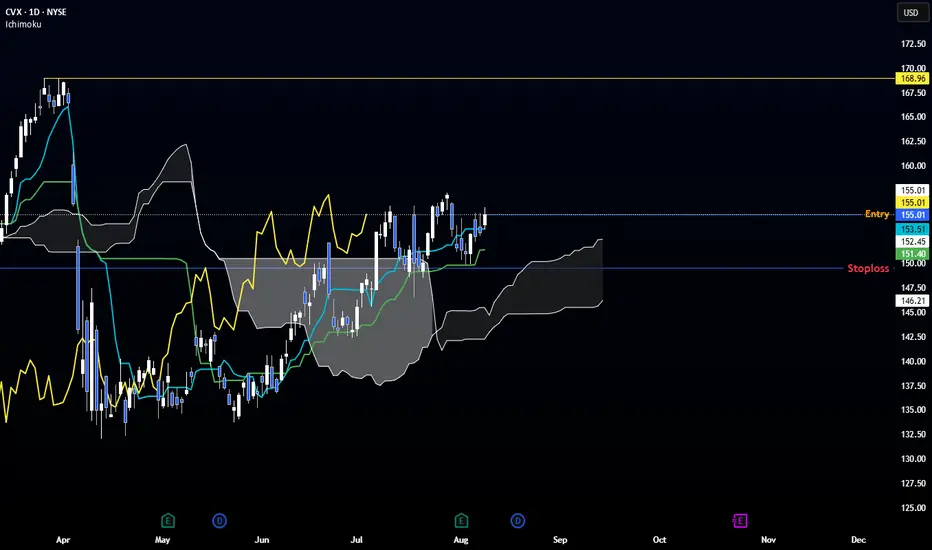
CVX – Ichimoku Bullish Setup
📈 Technical Outlook
☁ Kumo: Large & supportive. Span A flat (pause), Span B bullish.
🔹 Tekan-sen: Broken to downside.
🔹 Kijun-sen: Bounce & pointing up → trend strength.
📍 Chikou Span: Above price → bullish confirmation.
💡 Bias → High probability of upside continuation.
📊 Trade Plan
Entry: 155.01
Stop Loss: 149.55 (below last swing low)
Take Profit: None – trail SL at each new swing low
🎯 Potential Target Zone: 168.96 (major resistance)
⚠ Risk Management
This setup follows Ichimoku principles—let winners run, cut losses early.
Not financial advice. Trade at your own risk.
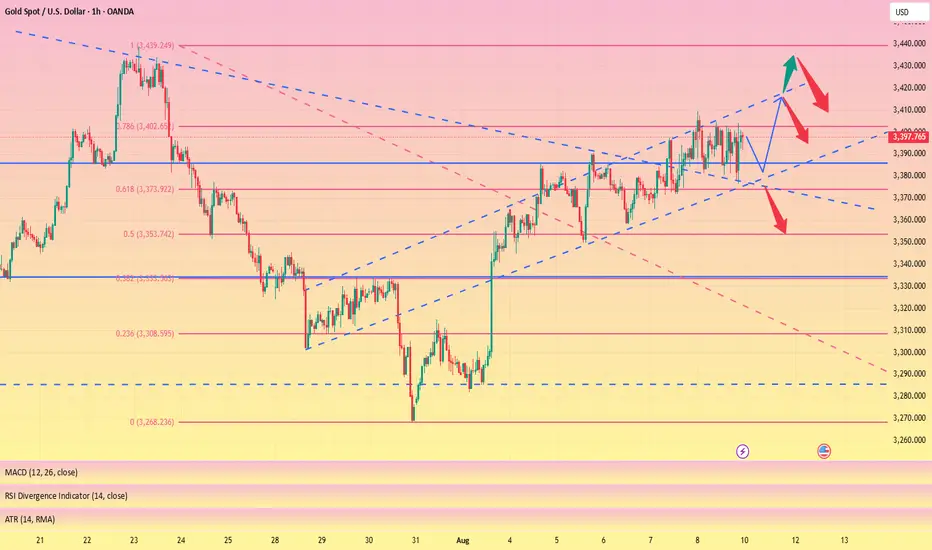
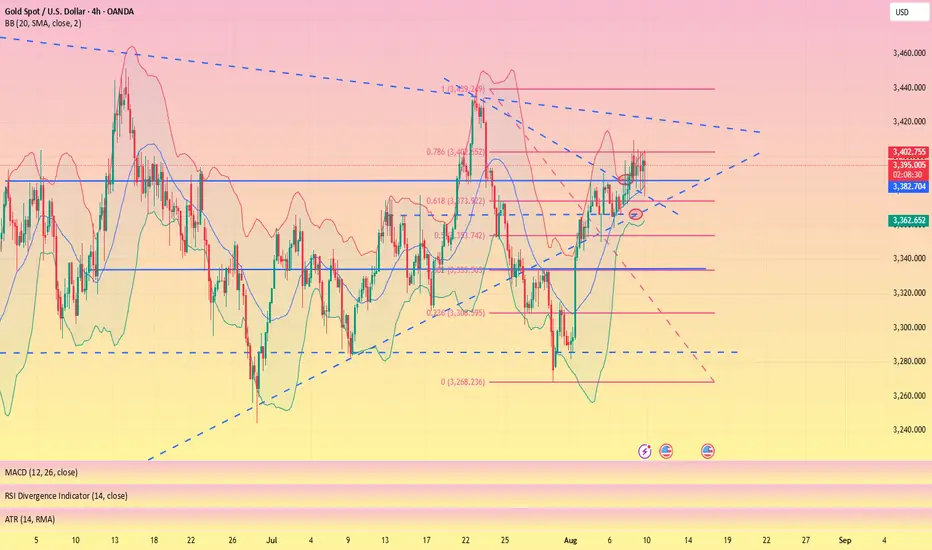
Market trend forecast and layout at the beginning of the week#XAUUSD
On Friday night, gold prices fluctuated rapidly before closing due to news, and finally closed near 3397. Currently, gold is fluctuating and consolidating in the 3400-3380 range. This pattern not only reflects the fierce game between bulls and bears, but also suggests that the market may be brewing a new breakthrough direction. Therefore, we need to be particularly vigilant about potential breakouts next week.
Judging from the market alone, gold is still in an upward trend channel, so at the beginning of the week we can focus on the effectiveness of the support between 3390-3380. If the support level of 3390-3380 below remains solid and the hourly line breaks through and stabilizes above 3400, then the gold price may test the key resistance level of 3410 again. Once it breaks through, it is expected to reach 3420-3430.
EURGBP 1 H longOnly chart I'm interested in next week, IF the price falls down like I want. otherwise I happy to skip this setup :)
What do I want to see? Like the start of the downtrend long red candles rushing to the support line. No consolidation. When that happens my buy orders are waiting at he the support line all the way down till the trend starts bullish again.

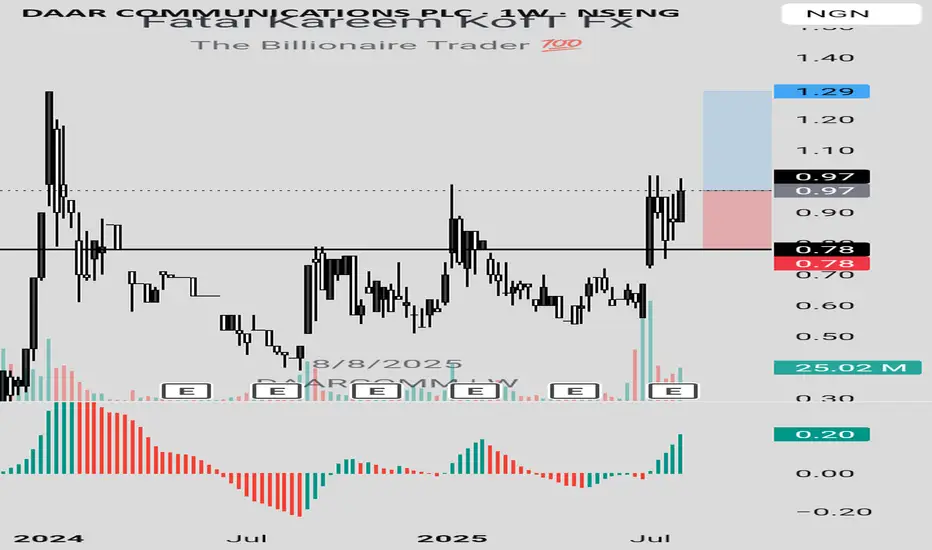
DAARCOMM LONG IDEA DAARCOMM stock, after breaking out of a trendline and retesting a support level, a bullish engulfing candlestick was formed. This is an indication that price is ready to go higher.
To take advantage of this long opportunity, you can buy at the current market price. The stop can be at N0.78 (-19.59%) while the target can be at N1.29 (32.99%).
Confluences for the long idea:
1. Trendline breakout
2. Support level
3. Bullish engulfing candlestick
Disclaimer: This is not a financial advice. The outcome maybe different from the projection. Don't take the signal if you're not willing to accept the risk.
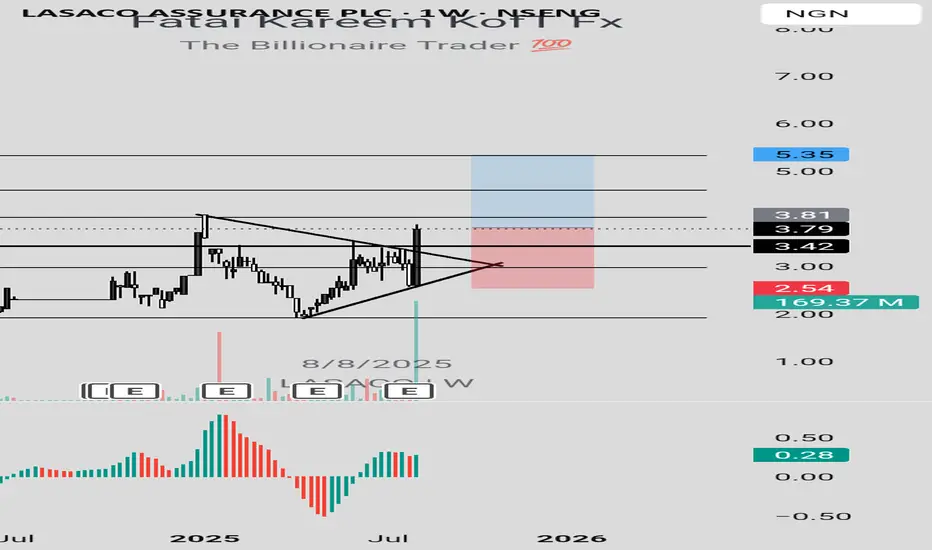
LASACO LONG IDEALASACO stock just broke out of a trendline with a strong bullish engulfing candlestick. In addition to the trendline breakout, the candle also broke a resistance level, respecting the uptrend.
To take advantage of this long opportunity, you can buy at the current market price or wait for price to drop to the resistance turned support level at N3.42. the stop can be at N2.54 (-33.33%) while the target can be at N5.35 (40.16%).
Confluences for the long idea:
1. Trendline breakout
2. Bullish engulfing candlestick
3. Strong volume momentum
4. Uptrend
Disclaimer: This is not a financial advice. The outcome maybe different from the projection. Don't take the signal if you're not willing to accept the risk.
DEAPCAP LONG IDEADEAPCAP stock, after breaking out of a trendline and retesting the trendline and support level, it formed a bullish engulfing candlestick, confirming that it's ready to continue the rally.
To advantage of this long signal, you can buy at the current market price. The stop can be at N1.10 (-19.12%) while the targets are N1.60 (17.65%), N1.94 (42.65%) and 2.36 (73.53%).
Confluences for the long idea:
1. Breakout and retest of a trendline
2. Bullish engulfing candlestick confirmation
3. Support level
Disclaimer: This is not a financial advice. The outcome maybe different from the projection. Don't take the signal if you're not willing to accept the risk.

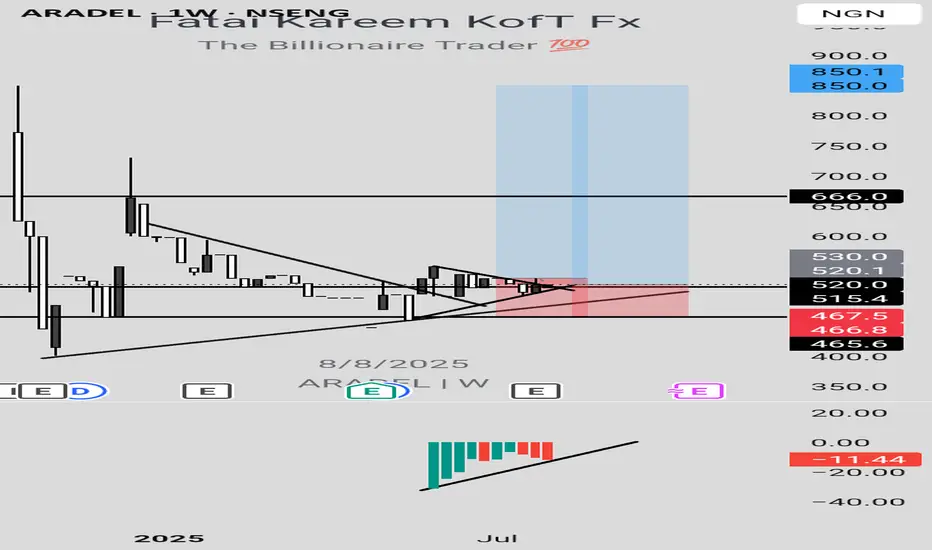
ARADEL LONG IDEAARADEL stock is giving a long signal by having bullish divergence on awesome oscillator using the weekly timeframe. Last week candle closed as a bullish candle after a bullish engulfing candlestick formed in the previous week. This happened at a support level which also has a trendline. In addition, there was a breakout of a down trendline. Confirming that buyers are ready to push the price higher.
To take advantage of this long signal, you can buy at the current market price. Stop can be at N467.5 (-10.11%) while the targets are N666 (27.92%) and 850 (63.43%).
Confluences for the long idea:
1. Awesome oscillator bullish divergence
2. Bullish engulfing candlestick confirmation
3. Support
4. Trendline breakout
Disclaimer: This is not a financial advice. The outcome maybe different from the projection. Don't take the signal if you're not willing to accept the risk.
GER40 – Testing 24,300.00 Resistance ZoneGER40 has been pushing higher after reclaiming the 24,100.00 level, with price now consolidating just below the 24,300.00 resistance. Bulls are attempting to break through this zone to target the 24,652.29 high.
Support at: 24,100.00 🔽 | 23,950.00 | 23,800.00 | 23,400.00
Resistance at: 24,300.00 🔼 | 24,652.29 (ATH)
🔎 Bias:
🔼 Bullish: A breakout and close above 24,300.00 could trigger a rally toward the ATH at 24,652.29.
🔽 Bearish: Rejection at 24,300.00 with a drop below 24,100.00 may send price back toward 23,950.00.
📛 Disclaimer: This is not financial advice. Trade at your own risk.

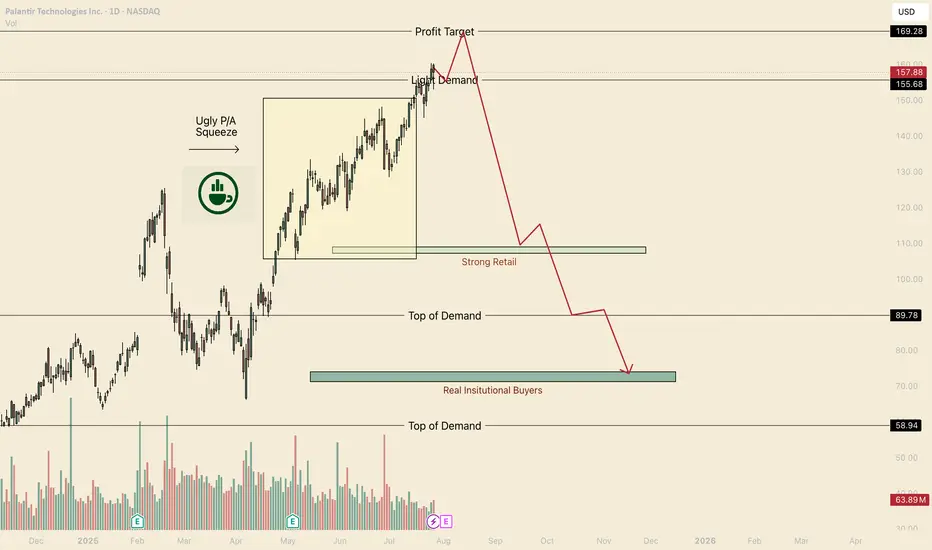
Hot Take, PLTR is a BubbleHello I am the Cafe Trader.
Price Action suggest we haven't had a proper buyer since $90.
Now I know that this can sound a bit off putting (especially if you bought above $90).
Even if this crashed, I am not suggesting you sell your long term position. I would instead look into hedging your position, giving yourself some exposure to the downside.
Consider these 2 non-biased reasons before writing me off.
Point 1
Price action suggests we have been in a short squeeze since April. Although in the short term I do see current retail buyers taking this to 169.
Point 2
If we do not land new Strong Buyer (someone that can support the price) all of this squeeze will come crashing back down to where they can support the price.
Conclusion
If we close below 152.50 on the day, this would suggest that bears have or are in control. This would expose many to tons of risk.
Here are my long Term prices for PLTR
Aggressive = 120
Fair = 107.50 - 108.50
Good = 89
Steal = 71-74.50
That's all for PLTR take a look at my other articles if you are interested in more!
Happy Trading!
@thecafetrader
ETH Critical Next Few Days.Hello I am the Cafe Trader.
Today we are taking a close look at Ethereum.
After the Tariff news and the Jobs report, The market as a whole seems very bearish suddenly to many. Even though we do have aggressive sellers in the short term, The market is still bullish in the mid to long term. Let's take a look.
Sentiment has changed
A major catalyst (like the Tariffs news) can cause a change of terrain. Buyers may become more bashful, taking their foot off the gas (where the put it before). Reactions to kry levels (like "top of demand") will give us clues into how strong are they still.
Short Term
ETH had a huge rally, Whats does a healthy rally need for a continuation?
Consolidation
This brings us to the charts
Top of demand gives us evidence of how convicted these current buyers still are in a market. A hot reaction = Aggressive Demand. Cold Reaction = Hesitant or lack of Demand.
Todays close was a touch cold, but considering the recent bearish news and data, not terrible. Buyers are still active in this area, but since the terrain might have changed, I have given you two scenarios.
Green Scenario
For this to play out, we need to see buyers step in immediately. The longer ETH stays in this demand, the heavier they will become (and it's a long way down)
Wait for a second test minimum. Best to get a hot reaction. If it presses into the demand zone, Cut it early. (always good to wait for a close)
Entry 3,518
Stop 3,360
TP 1 3,990
TP 2 Breakout? Trailing stop?
Red Scenario
If we can't close above top of demand (Like tomorrow...) This is the likely scenario. I would be hard pressed to try and catch a knife this overextended. So until we identify where the new sellers are sitting, I can't give you any trades on this scenario. If you are short biased this could run all the way down to the bottom of demand.
I'll keep a close eye this over the weekend and keep updates.
Long Term
These prices should be according to your personal sentiment on ETH.
Aggressive = 3,500
Good price = on the trend roughly 2,900 - 3k
STEAL = 2,200 - 2,400
That's all for ETH! Enjoy your weekend, and Happy Trading!
@thecafetrader

Learning#05 : Decoding Highs and Lows📚 Learning#05 : Decoding Highs and Lows
- A Trader’s Guide to Reading the Market - Simple Yet Important
If the market were a book, the trend would be its storyline — and as traders, our job is to read that story without skipping pages. Trading with the trend puts the odds in your favor because you’re flowing with the market’s natural momentum, not fighting it.
Whether it’s an uptrend, downtrend, or a sideways grind, spotting it early gives you a big edge in deciding when to enter, when to exit, and when to simply step aside.
One of the simplest yet most reliable ways to read that story?
👉 Story of Highs and Lows
Let’s break it down.
📚 Understanding Highs and Lows in Trading
In technical analysis, highs and lows are the market’s way of leaving breadcrumbs.
A high is a peak before the market pulls back.
A low is a trough before the market bounces.
Track these points over time and you start to see patterns that reveal the market’s mood — bullish, bearish, or indecisive.
This isn’t about guessing; it’s about observing price action as it is.
📌 The Four Key Building Blocks of Market Structure
1️⃣ Higher Highs (HH)
Each new high is higher than the one before.Paired with higher lows, this signals an uptrend. Buyers are in control, and demand is pushing price upward.
Example: Nifty rallies from 22,000 to 22,200, pulls back to 22,100, and then rallies to 22,350. That second high (22,350) is higher than the first, confirming bullish momentum.
2️⃣ Higher Lows (HL)
Each pullback low is higher than the last.This tells you that sellers tried to push the market down — but buyers stepped in sooner this time, showing strength.
HLs often precede trend continuation and give great spots for entering long positions with tight risk.
3️⃣ Lower Lows (LL)
Each new low is lower than the previous one.Paired with lower highs, this marks a downtrend. Selling pressure is in charge, and rallies are being sold into.
4️⃣ Lower Highs (LH)
Each bounce high is lower than the last.This shows weakening buying pressure and often leads to another push lower.
Think of it like climbing stairs vs. walking down a hill:
📌 HH + HL = Stairs up → Bull trend.
📌 LL + LH = Hill down → Bear trend.
📈 HH+HL : Bullish Setup :
📉 LL+LH : Bearish Setup :
📌 Why It Matters for Traders
Price action is the most honest information in the market — no lag, no magic, no guesswork.
HH/HL → Bulls in control → Look for long setups.
LL/LH → Bears in control → Look for short setups.
Spotting these patterns on the fly means you can align with the dominant side instead of fighting it.
🧩 Combining HH & LL With Other Tools
📏 Fibonacci Retracements
Once you’ve identified the trend:
In an uptrend, draw Fibonacci from the latest HL to HH for pullback buying zones.
In a downtrend, draw from the latest LH to LL to find shorting opportunities.
⛰️ Fractals for Clarity
Fractals help pinpoint swing highs and lows without guesswork. I personally track HH/HL/LL/LH on a 1-minute chart for intraday trading — this keeps me in sync with the micro-trend while avoiding sideways traps.
🔀 Trendlines & VWAP
Trendlines show the bigger path, VWAP confirms intraday balance. When HH or LL aligns with these, you’ve got high-confluence setups.
🥷 Kiran’s Approach
For intraday, I start by mapping the structure: HH, HL, LL, LH. This gives me the immediate trend bias and alerts me to potential reversals early. I track them on a 1-min chart, combine with Fibonacci and trendlines, and trail stops as the structure unfolds.
It’s simple, visual, and keeps me out of bad trades and warns me to stay out of a sideways market situation, too.
🔑 Key Takeaway
Market structure is like a language — HH, HL, LL, and LH are its alphabet. Once you learn to read it, you’ll never trade blind again.
💡 “Trade what you see, not what you think. The chart always whispers first — you just have to listen.”
Start marking highs and lows on your chart tomorrow. Watch the story unfold. Trade in sync, and you’ll notice your entries become sharper, your exits cleaner, and your confidence higher.
See you in the next one — and until then:
Keep it simple. Trade with structure. Trust the levels.
— Kiran Zatakia
Ethereum (ETHUSD): All Time High Ahead📈Ethereum has successfully broke above an important daily resistance level today.
The next major resistance is base on the All Time High.
I anticipate the market will continue to rise towards the 4800 level, but I prefer to wait for a pullback to buy on a retest of the broken structure.

True or false? How to Decide Between Long and ShortInfluenced by the news related to tariffs, gold has just completed a fluctuation of nearly $20 in a very short period of time, breaking the silence of the gold market in one fell swoop. Separately, news indicates that the White House is planning to clarify the misinformation surrounding gold bar tariffs.
If there were traders who had rashly entered the market before, in the absence of strict trading system constraints and strict trading discipline, they would inevitably suffer certain losses regardless of whether they chose to go long or short.
This is also the reason why after giving my daily trading strategies, I will repeatedly emphasize the importance of strictly adhering to trading planning and discipline.
For ordinary traders, it's difficult to discern the authenticity of this news. After all, the Trump administration has a history of denying its own statements. Therefore, sometimes it's wise to remain on the sidelines.
This is also what I specifically reminded you to do when publishing my trading strategy this morning: be sure to trade with a small position today and be vigilant to potential unforeseen circumstances.
Next Stop 3420? Gold Bulls Push the Limit!Gold has shown a step-by-step rise in the short term, and has stood above 3,400 many times, and the bullish force is relatively strong. However, correspondingly, after gold stood above 3400, it fell under pressure several times, so the shape was not particularly good, which increased the risk of pullback in the short term.
However, we do not need to worry. Gold is still running in an ascending wedge structure. Although it has been under pressure and fallen back several times during the attack on 3400, the bullish structure has not been effectively destroyed so far. Moreover, with the sharp increase in gold buying, the 3380-3370 area below has become an obvious intensive trading area, which has greatly limited the gold retracement space.
In addition, after gold broke through 3340, market sentiment tended to be optimistic. If gold experiences a short-term pullback, more funds will flow into the gold market, especially for those who have missed out on long trades before, who will rush into the gold market even more frantically. Under the resonance of the current technical structure and market optimism, gold still has the potential to hit 3400, and bulls are even expected to stand firm at 3400 and make further efforts.
So in terms of short-term trading, I still advocate that gold pullbacks are buying opportunities. And I cherish the opportunity to enter the market and go long in the 3385-3375 area, and am optimistic that gold will hit 3400 again, and may even continue the bull trend to the 3420-3430 area.
OANDA:XAUUSD FOREXCOM:XAUUSD TVC:GOLD FX:XAUUSD CAPITALCOM:GOLD

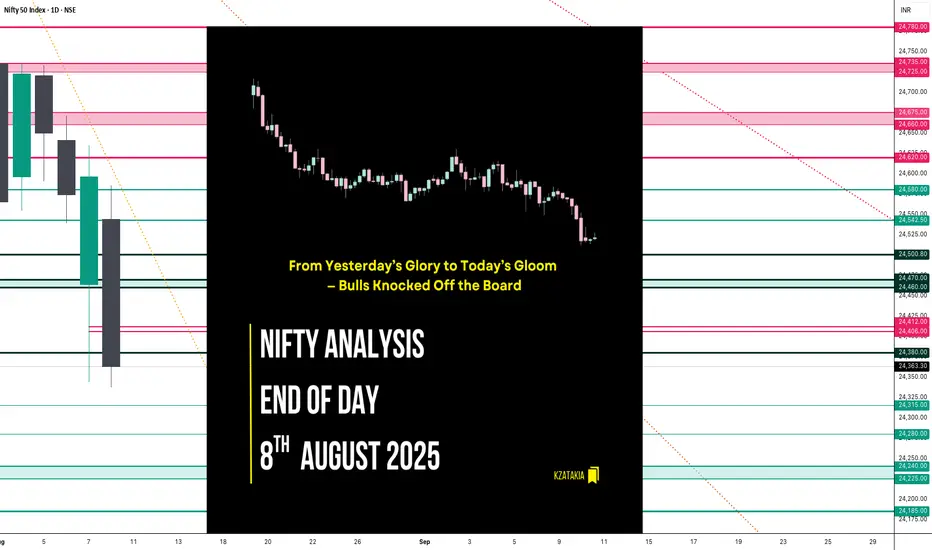
Nifty Analysis EOD – August 8, 2025 – Friday🟢 Nifty Analysis EOD – August 8, 2025 – Friday 🔴
From Yesterday’s Glory to Today’s Gloom — Bulls Knocked Off the Board
Today’s market was a textbook case of how quickly momentum can flip. Yesterday’s 289-point bullish surge was completely erased, with Nifty ending deep in the red and closing at the day’s low. Sellers clearly had the upper hand, leaving little room for bulls to breathe.
🗞 Nifty Summary
Friday opened with a 65-point gap-down — right below the crucial 24,580 support zone — and that level instantly showed rejection.
In the first 45 minutes, Nifty slipped 150 points from the day high and 200 points from the previous day high. The key Fibonacci retracement level from yesterday’s range — 24,406 ~ 24,412 — played the role of intraday savior multiple times, offering support and holding the market within a narrow zone for most of the day.
However, the bulls’ defense cracked after 3:00 PM. The support broke, triggering a sharp slide below 24,380 and even the Previous Day Low (PDL).
The upside was capped by 24,470 ~ 24,460, while 24,406 ~ 24,412 remained the battleground for most of the day until the breakdown.
In a single session, yesterday’s dramatic 289-point recovery rally was completely erased — with Nifty closing at the bottom of the PDL and CDL.
Today’s close is now below the low of 12th May, marking a 64-session (88-day) low.
Now the question for Monday: will bearish momentum extend, or will some positive news bring bulls back into play?
🛡 5 Min Intraday Chart with Levels
Intraday Walk
🔻 Gap-down open below major support at 24580.
⏳ First 45 minutes: Steep drop of 150 points from the day high.
🛡️ Fib support at 24406–24412 holds multiple times… until the late break.
🔻 Post 3 PM: Support collapse leads to fresh lows below PDL.
📉 Close near day’s low — erasing yesterday’s bullish rally.
📉 Daily Time Frame Chart with Intraday Levels
🕯 Daily Candle Breakdown
Open: 24,544.25
High: 24,585.50
Low: 24,337.50
Close: 24,363.30
Change: −232.85 (−0.95%)
Structure:
Real Body: 180.95 pts (Red Candle — Close < Open)
Upper Wick: 41.25 pts
Lower Wick: 25.80 pts
Interpretation:
Strong bearish sentiment — sellers maintained control from open to close.
Very small lower wick — indicates conviction from sellers in closing near the low.
Wiped out prior day’s gains — buyers have lost the short-term edge.
Candle Type:
Bearish Marubozu (near-full body) — signals decisive selling pressure, often a continuation pattern after weakness.
🛡 5 Min Intraday Chart
🥷 Gladiator Strategy Update
ATR: 210.45
IB Range: 134.05 → Medium
Market Structure: Balanced
Trade Summary:
10:35 AM – Short Entry → SL Hit
📌 What’s Next? / Bias Direction
Below 24,400: Bearish momentum likely to extend toward 24,250–24,200.
Above 24,470: Only a strong reclaim can shift bias back to neutral.
Gap-down/weak open on Monday may accelerate selling; bounce attempts will face resistance at 24,400–24,470.
🔍 Support & Resistance Levels
Resistance Zones:
24,406 ~ 24,412
24,460 ~ 24,470
24,500
24,580
Support Zones:
24,315
24,280
24,240 ~ 24,225
24,185
💬 Final Thoughts
"Markets don’t turn on hope — they turn on price. Respect the levels, and let price lead the story."
Bulls had the glory on Thursday, but Friday flipped the script completely. The market now sits at a multi-month low — momentum favors bears, but Monday’s open will decide if we see follow-through selling or a sharp dead-cat bounce.
✏️ Disclaimer
This is just my personal viewpoint. Always consult your financial advisor before taking any action.
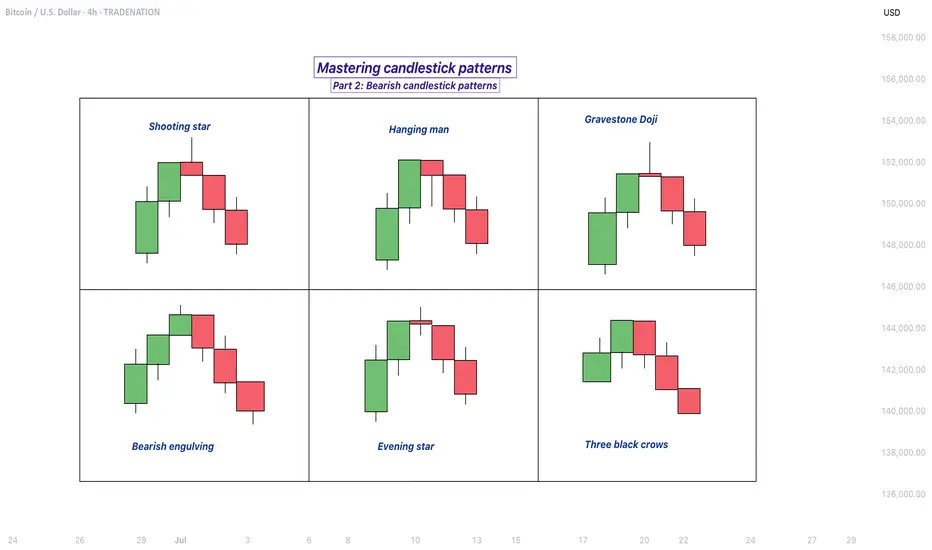
Mastering bearish candlestick patterns - How to use it!Bearish candlestick patterns are a cornerstone of technical analysis, relied upon by traders across financial markets to assess the likelihood of price reversals or continued downward trends. At their core, these patterns are visual representations of shifts in market sentiment, formed by the open, high, low, and close prices over one or several trading sessions. When recognized accurately and interpreted in context, bearish candlestick setups can alert market participants to the fading strength of buyers and the increasing presence of sellers, which often precedes downward price movements. Expanding on this, a comprehensive understanding of each pattern’s nuances, psychological underpinnings, and optimal trading applications can significantly enhance a trader’s analytical toolkit.
What will be discussed?
- What is a shooting star?
- What is a hanging man?
- What is a gravestone dojo?
- What is an evening star?
- What are the three black crows?
- How to trade the bearish candlestick patterns?
Shooting star
The shooting star pattern stands as a prominent candlestick configuration foreshadowing potential bearish reversals after an uptrend. This single-candle pattern is distinguished by a small real body situated near the lower end of the price range, a long upper shadow that is at least twice the length of the body, and little to no lower shadow. The psychological narrative implied by the shooting star is compelling: buyers initially control the session, pushing prices sharply higher, but by the close, sellers have overwhelmed this optimism, pulling the price back down to near or below the opening point. This abrupt shift in control suggests that the bullish momentum is waning, priming the market for a price correction or reversal.
Hanging man
The hanging man, while visually similar to the hammer pattern of bullish reversals, is distinctly bearish because of its position at the top of an established uptrend. This single-candle pattern features a small body at the upper part of the trading range and a markedly long lower shadow, again with minimal or absent upper shadow. During the session, substantial selling pressure drives prices down, accounting for the extended lower shadow, yet buyers temporarily regain some control, recovering much of the loss by the close. Despite this late-session recovery, the appearance of the hanging man warns traders that sellers are growing more aggressive – especially if the next candle confirms the weakness with a lower close.
Gravestone doji
A classic and somewhat ominous formation, the gravestone doji is a specialized form of doji candlestick that carries even greater weight when it appears after a rising market. Here, the open, close, and low are all clustered near the session’s low, forming a long upper shadow with no lower shadow. This structure vividly illustrates a dramatic shift in sentiment: buyers propel prices higher during the session, only to be met by intense selling which pushes prices back to the opening level by the close. This failed rally, marked by the upper wick, reflects the exhaustion of buying interest and the potential onset of bearish dominance.
Bearish engulfing
Turning to multi-candle setups, the bearish engulfing pattern is a powerful, two-bar reversal pattern. The initial candle is bullish and typically a continuation of the prevailing uptrend, but the second candle is bearish and must open above and close below the body of the first candle, “engulfing” it completely. The transition from a relatively small upward move to a much larger downward move highlights a rapid escalation in sell-side enthusiasm. Importantly, the larger the second candle and the greater the volume accompanying it, the more reliable the signal.
Evening star
The evening star expands the analysis further into a three-candlestick formation, representing a storyline of shifting market dynamics. The pattern commences with a long bullish candle, followed by an indecisive small candle (the star) that gaps above the previous close, and concludes with a large bearish candle that closes deep into the first candle’s body. The evening star is especially meaningful because it narrates a transition from bullish exhaustion to bearish control over three sessions, making it a robust signal of a pending trend reversal. The reliability of the evening star increases if the bearish candle is accompanied by high volume, confirming a surge in selling pressure.
Three black crows
Among the most striking bearish signals is the three black crows pattern. It comprises three consecutive large bearish candles, each opening within the body of the previous candle and closing successively lower. This pattern demonstrates relentless selling over several sessions, erasing prior gains and indicating that bearish sentiment is in full swing. Collectively, the three black crows can shift market psychology significantly when they appear after a lengthy uptrend, especially if accompanied by increased trading volume.
How to trade the bearish candlestick patterns?
Effectively using bearish candlestick patterns in a trading strategy requires more than mere recognition of shapes. The context in which these patterns emerge matters greatly; traders should analyze preceding price action, the scope of the trend, and any converging signals from other technical tools such as momentum oscillators or volume indicators. Confirmation is a best practice, waiting for a subsequent session that continues in the bearish direction can filter out false signals and decrease the chances of whipsaw trades.
In practice, traders may use these patterns to identify short-selling opportunities, define entry and exit points, or adjust stop-loss levels to protect profits as a trend appears to reverse. Risk management is crucial, as no pattern is infallible. Position sizing, stop-loss placement, and ongoing evaluation of the broader market environment all contribute to the prudent use of candlestick analysis. By integrating these patterns into a comprehensive market analysis framework, traders are better positioned to interpret crowd psychology, anticipate significant reversals, and navigate the complexities of price movement with a higher degree of confidence and skill.
-------------------------
Disclosure: I am part of Trade Nation's Influencer program and receive a monthly fee for using their TradingView charts in my analysis.
Thanks for your support. If you enjoyed this analysis, make sure to follow me so you don't miss the next one. And if you found it helpful, feel free to drop a like 👍 and leave a comment 💬, I’d love to hear your thoughts!