USDJPY: More Growth Ahead! 🇺🇸🇯🇵
USDJPY broke and closed above a minor daily resistance
with a confirmed BoS.
The next strong resistance is 148.0
It is going to be the next goal for bulls.
❤️Please, support my work with like, thank you!❤️
I am part of Trade Nation's Influencer program and receive a monthly fee for using their TradingView charts in my analysis.
Candlestick Analysis

The 3-Method Framework: Simplifying Technical AnalysisMost traders get caught up in complex indicator setups, thinking that more tools equal better results. We rely on moving averages to tell us if prices are trending up or down, and we depend on support and resistance levels to predict market movement. But what if I told you there's a simpler, more powerful way to read the market using pure price action?
Today, I want to share my experience and understanding of bias and expectations for the next candle formation. This approach is refreshingly simple because we don't need to understand every single price movement - we just need to focus on what matters most.
Method 1: Opening Price Comparison
The first method is beautifully straightforward. For a bullish bias, the current opening price should be above the previous opening price. That's it. Sounds almost too simple, right? But simplicity often holds the greatest power in trading.
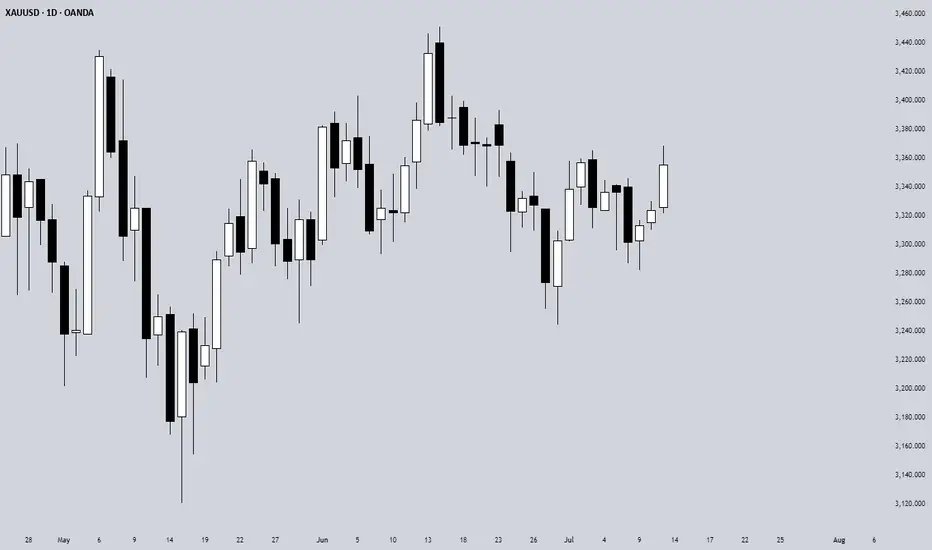
For Gold yesterday, we simply needed to compare the latest opening price on the Daily timeframe with the previous opening price. It's that simple.
Method 2: Mid-Level Analysis
The second approach involves comparing mid-levels between candles. We compare the mid-level of the previous candle with the mid-level of the candle before that. I know it might sound a bit complicated when explained this way, but once you visualize it on your chart, the concept becomes crystal clear.
Still on Gold, we just compare the 50% or mid-level of the previous candle with the candle two periods back from the latest candle on the daily chart.
Method 3: Expansion Expectations
The third method helps us anticipate expansion in price. Traditional complex methods require analyzing numerous factors, but this simplified approach only needs two candles before the current one. Here's how it works: we use the high and low of the candle two periods back, and the open and close (body) of the previous candle. If the previous candle's body sits within the high-low range of the two-candle-back formation, we can expect price expansion.
The beauty of this method is that we don't care whether the price is bullish or bearish - we simply expect expansion to occur. Think of it like a compressed spring: when price gets squeezed within a previous range, it often seeks to break out in either direction. We're not predicting the direction, just the likelihood of significant movement.
Still on Gold, I randomly selected all inside candles on the Daily timeframe. Remember, the purpose is only to expect expansion, not direction. If you want to use this for directional bias, make sure you apply the additional analysis required.
Remember, there are no guarantees in trading, but this method provides valuable insight into potential market expansion.
Advanced Combinations for Enhanced Analysis
Combining Methods 1 and 2 creates our most accessible approach since you only need two candles. When both the opening price and mid-point from two candles ago indicate bullish conditions, we can expect the current candle to follow an OLHC bullish pattern.
You can see the 3 examples I've provided in the image, and all of these are applicable across all timeframes, both daily and 4-hour.
Combining all three methods offers a more sophisticated analysis, particularly useful for anticipating market reversals. This involves marking the current and previous opening prices, comparing mid-levels from the last two candles, and identifying the high/low range from two to three candles back.
Now I'm adding Inside Candles from 2-3 periods back (My personal rule is maximum 3 candles before the current candle, or this analysis will lead to analysis paralysis).
The Bullish and Bearish Rules
Bullish Rule 1:
Opening price above the previous opening price
Mid-level of the previous candle above the mid-level of the previous candle before that.
Inside candle formation (optional)
Bearish Rule 1:
Opening price below the previous opening price
Mid-level of the previous candle below the mid-level of the previous candle before that.
Inside candle formation (optional)
The Secret Sauce: Timeframe Harmony
Here's where the "devil is in the details" comes into play. You might find perfect bullish conditions on your chart, but the market still reverses. The secret lies in using this method on Daily and 4-hour timeframes simultaneously.
Simply understand it from the chart.
Simply understand it from the chart.
If Rule 1 conditions are met on the daily chart, they must also align on the 4-hour chart. When the 4-hour contradicts the daily, follow the 4-hour signal as it might indicate a "sell on strength" or "buy on weakness" scenario.
The formula is simple: must align with
I've never tested this on 1-hour charts because the Daily and 4-hour combination provides sufficient accuracy for my trading approach.
Enhanced Rules for Precision
Rule 2 makes the inside candle formation mandatory rather than optional. Sometimes you'll encounter mixed signals where the mid-level suggests one direction while the opening price suggests another. The solution? Drop down to a lower timeframe for additional confirmation.
I don't recommend using this method below the 4-hour timeframe, but you can certainly apply it to Monthly or Weekly charts for long-term bias determination. The key is analyzing both Daily AND 4-hour timeframes together, not just one or the other.
When timeframes conflict, often just one key level provides the confirmation you need - typically a previous Monthly or Weekly high or low.
Final Thoughts
Pure price action mastery isn't about having the most sophisticated setup or the most indicators on your chart. It's about understanding the fundamental relationship between opening prices, mid-levels, and candle formations across meaningful timeframes.
This approach has served me well because it cuts through market noise and focuses on what price is actually telling us. Start with these three methods, practice identifying the patterns, and gradually build your confidence in reading pure price action.
Remember, consistent profitability comes from mastering simple, reliable methods rather than chasing complex strategies. Keep practicing, stay disciplined, and let price action guide your trading decisions.
Good Luck! :)
OIL IDEA /30 06 25So we are looking for this Short position, but first we need a better Premium position

POPCAT IDEA 29/06/25Any retracement to the 1D FVG could be a nice entry if you are not in yet
Let´s see how it respond to Premium Zone and we could expect go for mayor liquidity

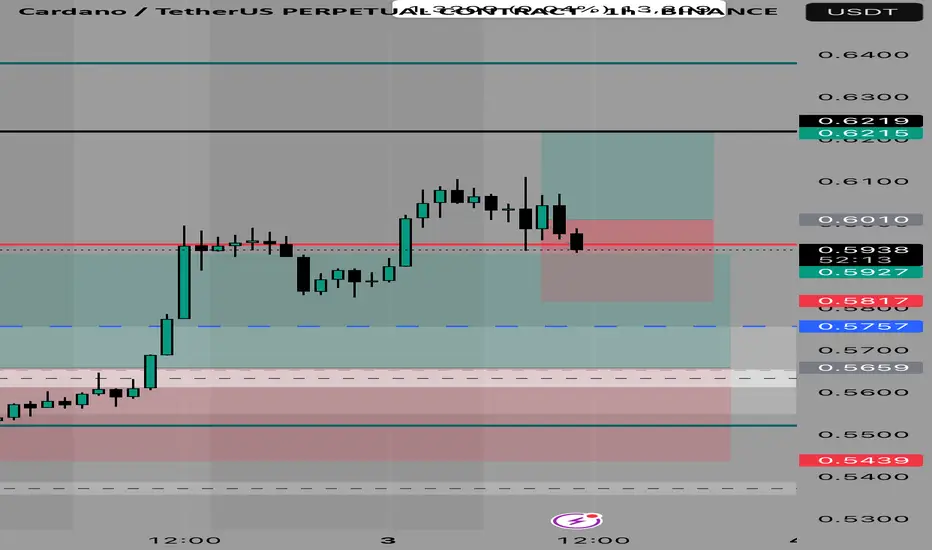
ADA idea 03 07 25Grids can it’s a great way to deal with volatility and timming within a range with clear PD Arrays

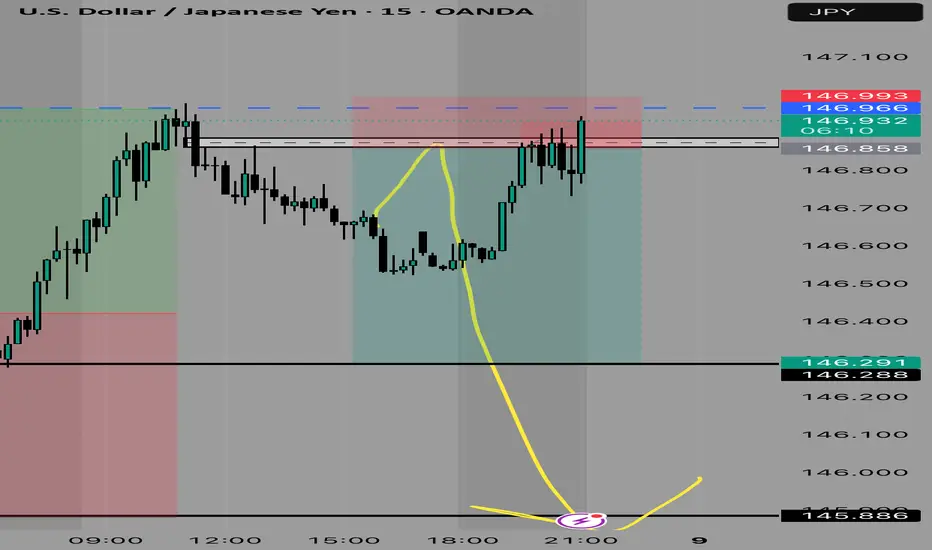
USDJPY IDEA 08/07/25So we are looking for a Discount Zone with this one. Since we are in a Premium PD Array, we are expecting a short term reversal
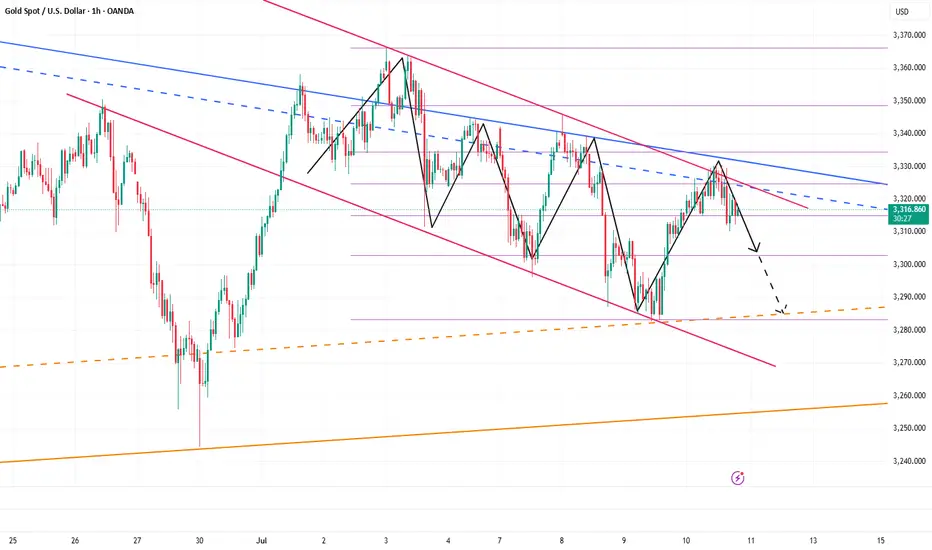
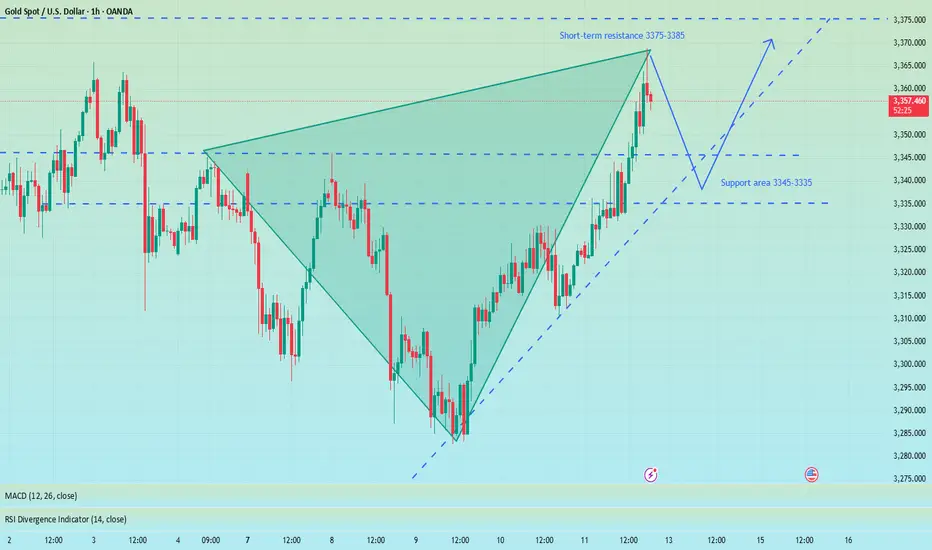
Precisely look at 3365 and pay attention to the pullback chanceAt present, gold has risen as expected and reached the highest level near 3368. The upper 3375-3385 constitutes a short-term resistance level. At present, the bullish momentum is still relatively strong, and the short-term support structure below has been formed. I still maintain the views of the previous transaction and wait for a second trading opportunity when it pulls back below. Although the 1H chart shows that the current trend remains strong and the retracement is small, it is necessary to remain cautious - even if the market is strong, it is not recommended to chase long easily, and the risk of a deep correction in the gold price must be guarded against. First, pay attention to the support area of 3345-3335 below. If it falls back to this level, you can consider going long with a light position.
OANDA:XAUUSD
Continue to try to find the top of the band to short goldGold maintained a slow and volatile rise structure during the day. The highest has reached 3348, and it is only a step away from 3350. Will gold continue its upward momentum as usual?
In fact, it was beyond my expectation that gold could break through 3345 in the short term. According to my original expectation, the intraday high of gold was almost around 3345. Although the rebound of gold exceeded expectations, it is currently located near the resistance of 3348-3350, so I will definitely not give priority to chasing gold at high levels in short-term transactions.
Moreover, gold is currently in the resistance area of 3348-3350. The volatility of gold has converged, and the upward momentum has declined. As gold continues to rebound and faces the key resistance area again, the bulls are relatively more cautious. In this context, this resistance area may act as a catalyst, and the bears will react, leading the decline in gold. However, as gold rebounds and the support below gradually stabilizes, we can appropriately reduce the expectation of gold's decline and adjust the decline target to the 3330-3320 area.
So for short-term trading, I will still short gold based on the resistance area, trying to find a swing top in the 3340-3350 area, and look at the target area of 3330-3320.

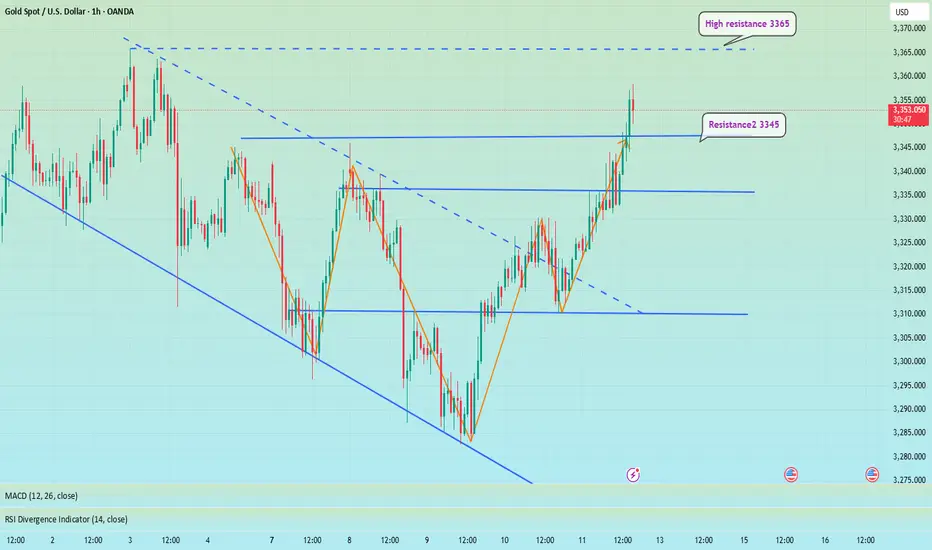
The idea remains unchanged, NY3360-3365 is emptyThe idea remains unchanged during the NY period. Although gold has currently reached a high of around 3348, it has not stabilized above it. If gold successfully breaks through 3350 in the short term, it may reach 3360 or 3365. In the 4H cycle, it presents a step-by-step upward pattern. The K-line is temporarily fluctuating sideways near the upper track. At the same time, 3345 has formed a double top pattern. Combined with Thursday's low of 3310, an inverted triangle oscillation range of 3345-3310 is formed in the short term. This week's trend needs to pay close attention to the breakthrough direction of this range. Short-term long positions can be taken after the trend is confirmed.
XAUUSD@3330-3320 long TP 3345-3365
OANDA:XAUUSD

Breaking through 3350, the bullish trend remains unchanged📰 News information:
1. Pay attention to the impact of Trump administration tariffs
📈 Technical Analysis:
Possible interest rate cuts and tariffs in the fall continue to stimulate risk aversion. Currently, the 3300-3285-3310 points form a head and shoulders bottom pattern. The bullish momentum is relatively strong in the short term. Our short trade near 41 has hit the stop loss. As I wrote before, gold may continue to rise to 3360 or 3365 after breaking through 3350. The current RSI indicator is seriously oversold, so be cautious when operating in a unilateral trend in the short term. The safe way is to wait for a pullback to 3345-3340 to go long
🎯 Trading Points:
BUY 3345-3340
TP 3360-3370-3400
In addition to investment, life also includes poetry, distant places, and Allen. Facing the market is actually facing yourself, correcting your shortcomings, facing your mistakes, and exercising strict self-discipline. I share free trading strategies and analysis ideas every day for reference by brothers. I hope my analysis can help you.
TVC:GOLD FXOPEN:XAUUSD
Bulls rise, beware of Friday's black swan📰 News information:
1. Pay attention to the impact of Trump administration tariffs
📈 Technical Analysis:
Gold rose as expected and touched around 3344, which was in line with our judgment last night. However, from the market point of view, the K-line entity did not stand firmly above 3335. There are only two possible scenarios for the subsequent trend of gold. One is to stand directly above and test the 3345 resistance again, and the other is to fall in the European and American markets due to timeliness and retest the key support of 3310. At present, the upper positions are 3345 and 3365 respectively. If 3345 is repeatedly not broken and the European market falls with acceleration, then the 3310 area will still need to take back the long positions, which can be defined as a long wide-range wash. 3330-3320 is a very critical support position, and 3310 is a strong support. Therefore, the best position for shorting during the day is around 3335-3345, with the target at 3330-3320. Consider long positions after falling back and getting support here.
🎯 Trading Points:
SELL 3335-3345
TP 3330-3320
BUY 3330-3320
TP 3345-3365
In addition to investment, life also includes poetry, distant places, and Allen. Facing the market is actually facing yourself, correcting your shortcomings, facing your mistakes, and exercising strict self-discipline. I share free trading strategies and analysis ideas every day for reference by brothers. I hope my analysis can help you.
OANDA:XAUUSD PEPPERSTONE:XAUUSD FOREXCOM:XAUUSD FX:XAUUSD FXOPEN:XAUUSD TVC:GOLD

DXY (USD Basket) - 3 Month - Short Squeeze In Play?Technicals:
The last 3-month candle closed above the major resistance that tends to hold according to historic levels going back to the year 1967.
Golden Cross is almost complete (50 MA crossing the 200 MA).
Fundamentals:
The dollar has only been more shorted once in history (2018), setting things up for a potential "Short Squeeze" and triggering a "Risk Off" scenario. Tends to hurt risk assets quite hard—for example, tech stocks, crypto, and other leverage plays.
A rise in the DXY could potentially trigger a "Short Squeeze" for foreign countries, companies, and investors that borrow in USD, creating "economic panic" in other countries that get their currency devalued relative to their obligations.
Countries that need USD to service their debt. With the current tariffs, the flow of dollars in the world will change. The question is: what will the effect look like in August when these tariffs start to go live? Like I mentioned before, other countries need the dollars in order to service their debt. If it gets more expensive for US consumers to import (caused by the tariffs), the exporting countries won’t get those dollars—setting it up for a buying cycle that could potentially drive the USD (DXY) higher, even to all-time highs.
Current narrative:
The narrative right now is that the USD will get "worthless," setting the stage to take more risk and use more leverage, maybe without even hedging. A surprise variable to this narrative could be devastating to the financial markets—not just in the US, but even to the world. IF/When this happens, everyone will hunt the USD once again, creating a new bullish narrative for the USD, and everyone will be forced to return to the reserve currency.
Nothing in this post should be considered financial advice. Always do your own research and analysis before investing.

TON/USDT.P (LONG OPPORTUNITY)It seems to be will take the breakout from that marked point and start the bulish trend upto marked zone. but need to keep in touch before taking the entry for the trade. we need a confirmation to take entry. So, please copy and watch the market along with the BTC also.
#btc #TON #viral

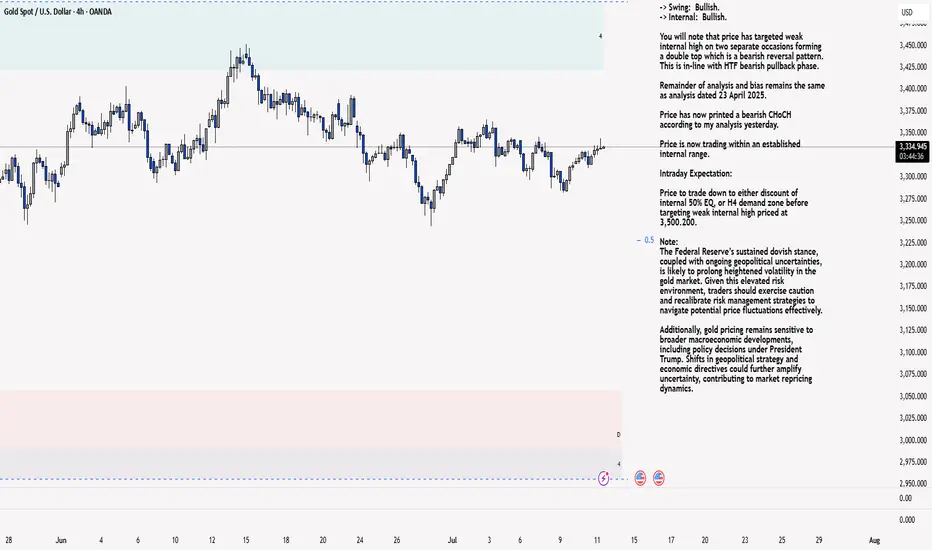
XAU/USD 11 June 2025 Intraday AnalysisH4 Analysis:
-> Swing: Bullish.
-> Internal: Bullish.
You will note that price has targeted weak internal high on two separate occasions forming a double top which is a bearish reversal pattern. This is in-line with HTF bearish pullback phase.
Remainder of analysis and bias remains the same as analysis dated 23 April 2025.
Price has now printed a bearish CHoCH according to my analysis yesterday.
Price is now trading within an established internal range.
Intraday Expectation:
Price to trade down to either discount of internal 50% EQ, or H4 demand zone before targeting weak internal high priced at 3,500.200.
Note:
The Federal Reserve’s sustained dovish stance, coupled with ongoing geopolitical uncertainties, is likely to prolong heightened volatility in the gold market. Given this elevated risk environment, traders should exercise caution and recalibrate risk management strategies to navigate potential price fluctuations effectively.
Additionally, gold pricing remains sensitive to broader macroeconomic developments, including policy decisions under President Trump. Shifts in geopolitical strategy and economic directives could further amplify uncertainty, contributing to market repricing dynamics.
H4 Chart:
M15 Analysis:
-> Swing: Bullish.
-> Internal: Bullish.
H4 Timeframe - Price has failed to target weak internal high, therefore, it would not be unrealistic if price printed a bearish iBOS.
The remainder of my analysis shall remain the same as analysis dated 13 June 2025, apart from target price.
As per my analysis dated 22 May 2025 whereby I mentioned price can be seen to be reacting at discount of 50% EQ on H4 timeframe, therefore, it is a viable alternative that price could potentially print a bullish iBOS on M15 timeframe despite internal structure being bearish.
Price has printed a bullish iBOS followed by a bearish CHoCH, which indicates, but does not confirm, bearish pullback phase initiation. I will however continue to monitor, with respect to depth of pullback.
Intraday Expectation:
Price to continue bearish, react at either M15 supply zone, or discount of 50% internal EQ before targeting weak internal high priced at 3,451.375.
Note:
Gold remains highly volatile amid the Federal Reserve's continued dovish stance, persistent and escalating geopolitical uncertainties. Traders should implement robust risk management strategies and remain vigilant, as price swings may become more pronounced in this elevated volatility environment.
Additionally, President Trump’s recent tariff announcements are expected to further amplify market turbulence, potentially triggering sharp price fluctuations and whipsaws.
M15 Chart:
Gold fluctuates, consolidation in the 3330-3310 range📰 News information:
1. Waller meeting on interest rate cuts
2. Trump tariff issues
📈 Technical Analysis:
Waller will participate in the meeting in more than two hours and pay attention to whether there is any news of interest rate cut. The key is to operate around the 3330-3310 range. Continue to pay attention to the support of 3310-3305 at night. If gold falls below 3310,-3305 again, the downward trend will continue, and it is expected to touch 3280 again, or even 3250. If it rebounds above 3330, it is likely to continue to rise.
In addition to investment, life also includes poetry, distant places, and Allen. Facing the market is actually facing yourself, correcting your shortcomings, facing your mistakes, and exercising strict self-discipline. I share free trading strategies and analysis ideas every day for reference by brothers. I hope my analysis can help you.
TVC:GOLD FXOPEN:XAUUSD FX:XAUUSD FOREXCOM:XAUUSD PEPPERSTONE:XAUUSD OANDA:XAUUSD

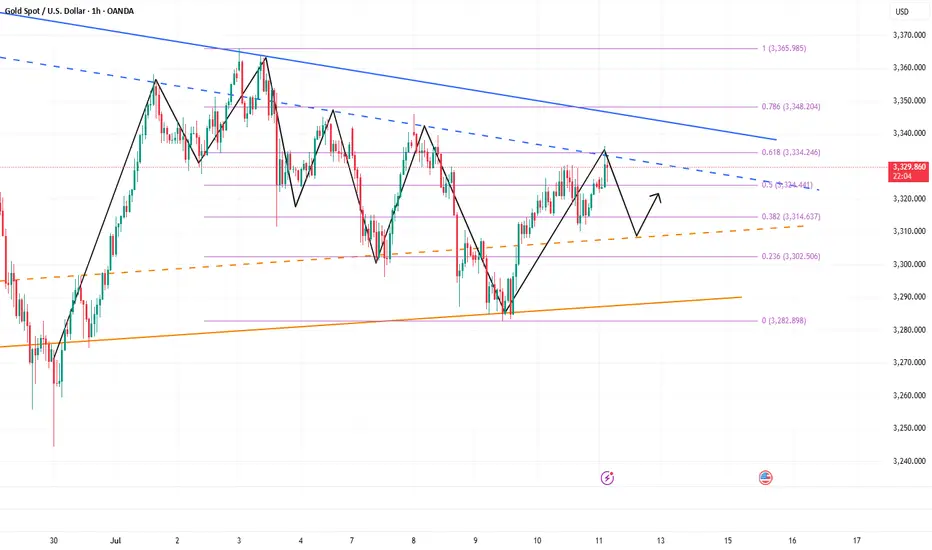
Go long when the trend reverses, beware of black swansYesterday's pullback to 3313-3310 confirmed the upward trend of gold. As I expected, it broke through the resistance of 3330 and touched around 3345. Currently, the short-term strong resistance is at 3345. Only by breaking through this resistance can gold maintain its upward trend. If it is blocked near the 3345 line in the short term, there is a possibility of a pullback. If 3345 breaks, there will be 3365 and 3400 above. Once the direction is clear, it will be easier to act. If there is a pullback during the day, it will give us a trading opportunity to enter the long position.
OANDA:XAUUSD

Hindustan Unilever Ltd. – Bullish Breakout with Strong MomentumHindustan Unilever opened the session with a gap-up accompanied by above-average volume, signaling strong buying interest right from the start. While the stock saw some early profit-booking, it quickly regained momentum and is currently trading near the day’s high—an encouraging sign of sustained demand.
Weekly Chart: The formation of a large bullish candle this week suggests aggressive buying and a potential shift in sentiment. This pattern indicates that the bullish momentum is likely to continue into the coming week.
Daily Chart: The stock has successfully broken out above multiple resistance levels, confirming a bullish breakout structure. The breakout is backed by volume, adding credibility to the move.
Trading Strategy:
Given the alignment of bullish signals on both the daily and weekly timeframes, a swing long position is warranted for the upcoming week. Traders may consider the following approach:
Entry: On a minor intraday pullback or a break above the current day’s high for confirmation
Stop-loss: Below the breakout level or this week’s low
Target: Next key resistance or a measured move based on the breakout range , approximately 10% from current levels
The technical setup reflects strong bullish momentum and suggests further upside potential in the near term.

GBPNZD: One More Pullback Trade I notice another potentially profitable pullback trade opportunity on 📉GBPNZD.
The price formed a double top pattern after testing a significant daily/intraday resistance and has broken through its neckline.
Currently, we are witnessing a retest, and the pair could pull back to the 2.2391 level.

BTC Roadmap Still Intact Bullish Momentum Building Toward 120KBitcoin Price action continues to validate the bullish roadmap shared in our last BTC post. The market respected the Immediate Buy Back Zone, springing from a demand backed structure into a fresh impulsive leg.
Notably, price has carved a clean 5-wave structure supported by recurring bullish pennants and continuation patterns each breakout driving momentum higher. Our target at 120,151 remains firmly intact, with price action showing healthy structure and controlled pullbacks.
The current setup remains valid as long as price holds above 106,655 and especially 100,941, which now act as structural pivot zones. Any deeper correction into the Demand Area would only serve as a re-accumulation window before the next leg.
Let’s see how price behaves into June. Momentum is aligning with structure.
Share your thoughts, like the post, and drop your setup confirmations on the comment section.

Gold’s Uptrend Is a Mirage,Bears Are Lurking Beneath!Gold has rebounded to around 3336, and seems to have tried to stand above 3335, but it has not stood firm. Therefore, it cannot be considered that the bulls have an advantage just because gold has tried to break through 3335. Recently, I have been reminding everyone that before gold stands above 3335, the bears still have the spare power to dominate the market, so I fully believe that the gold bulls and bears will fight fiercely for control around 3335!
Why do I think it is difficult for gold bulls to have a good performance in the short term? Because since gold fell and touched 3285, it has fallen below many key supports. The market is short-selling. The previous support has become a key resistance under the effect of technical top and bottom conversion, and multiple resistances are concentrated in the 3335-3345-3355 area. Under the suppression of multiple resistances, it is difficult for gold bulls to make any progress in the short term.
So before the resistance is effectively broken, I think any rebound may be an opportunity to short gold, so I will try to find the band top and short gold based on the resistance area, and now I think it is still worth a try to short gold in the 3330-3340 area as originally planned! And look at the target area of 3320-3310
Long trade
ETHUSDT 4H Chart Analysis
Date: Sat 05th July 2025, 4:00 PM
Session: London to NY AM
Key Trade Details
Entry: 2,515.17
Profit Target: 2,864.44 (+13.89%)
Stop Loss: 2,479.01 (−1.43%)
Risk-Reward: 9.66
Key Reasons for the Trade:
Bullish Breakout above 2,515, supported by strong volume surge.
Price Above EMA & WMA: Clear trend confirmation.
Strong Momentum: The RSI is overbought, indicating bullish strength, but watch for a potential short-term pullback as the price approaches resistance.
Target Zone: Prior resistance cluster at 2,820–2,860.
Current RR in Play: Trade already moving

Golden Trap: Bulls Exhausted, Bears Ready to StrikeToday, the gold market is in a stalemate between long and short positions, with the market fluctuating sideways for a long time and maintaining an overall volatile trend. Although the rebound of gold has won a respite for the bulls, the rebound of gold during the day is not enough to completely reverse the decline. I think that before the 3325-3335 area is stabilized, the bears still have spare power to dominate the market!
According to the current structure, although gold rebounded again after touching 3310 during the retracement, it has retreated many times during the rebound. The candle chart is interspersed with obvious negative candle charts, indicating that the rebound strength is weak. In the short term, it is under pressure in the 3330-3340 area, and it is difficult to break through in a short time.
So I think the role of the gold rebound may be to trap more buyers, so we try not to chase gold after the rebound. The area near 3310 is not a key support in the short term. 3305-3300 is the current key support area. Once the bears regain control of the situation, gold may test the 3305-3300 area again. Once it falls below the reformed area, it may test 3280 again, or even refresh the recent low to around 3270.
So the downward potential of gold is not over yet. We can still look for opportunities to short gold in the 3325-3335 area and look at the target 3305-3295 area.