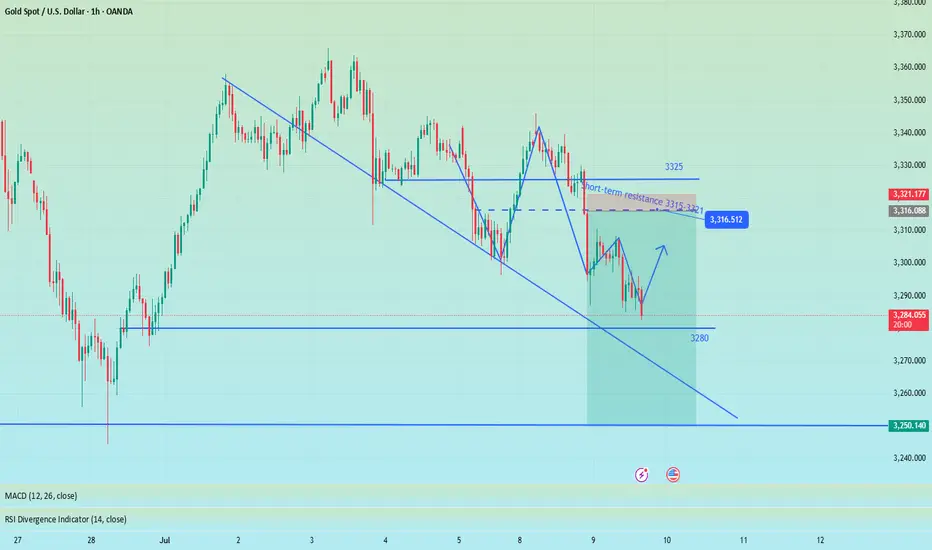
Short gold ,the downside potential is far from over.After we waited patiently for a long time, the gold bears finally showed signs of strength and began to fall as expected. Why do I insist on being optimistic about the gold retracement and wait patiently for it to retrace? !
In fact, it is very simple. Gold started to rebound from around 3283 and touched around 3330, which only recovered 50% of the decline. When facing the 50% retracement level, the bulls were unable to do so and could not stand above 3335, and could not even stabilize above 3330. The bulls' willingness was obviously insufficient. Then it can be determined that the gold rebound is only a technical repair of the sharp drop, and it cannot be completely regarded as a reversal of the trend. Then after a certain degree of repair, the gold bears will counterattack again.
Moreover, from the perspective of market psychology, the recent gold bull and bear markets have been discontinuous, and Trump often stirs up the gold market, making it difficult for the market to stand unilaterally on the bull side. Therefore, before gold stabilizes in the 3330-3340 area, there is limited room for rebound in the short term. Once gold falls below the 3310-3305 area again during the retracement, gold may test the area around 3280 again, or even around 3270.
So the above is why I insist on shorting gold, and I have shorted gold at 3320-3330 as planned, and patiently hold the position to see its performance in the 3310-3305 area, which is also the target area of our short-term short position.
Candlestick Analysis

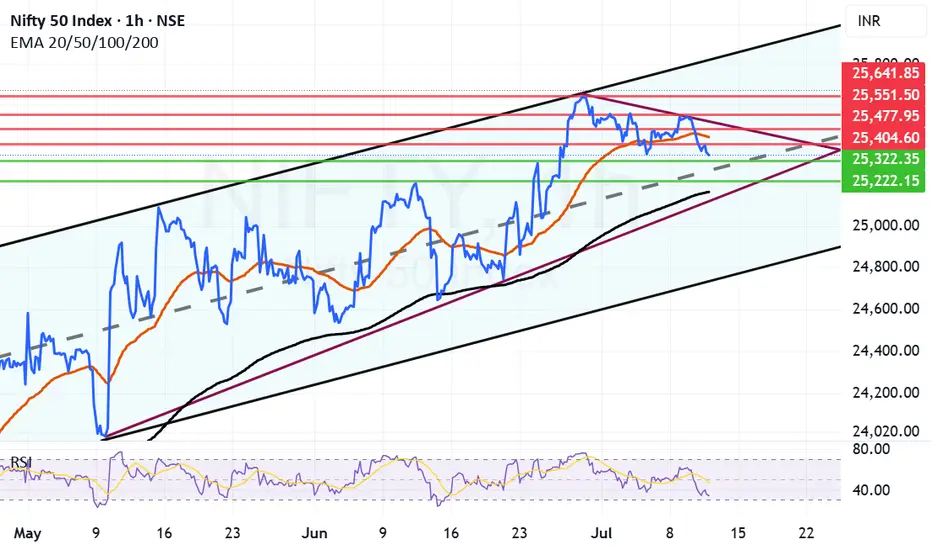
Nifty approaching Mid-channel support zone now. Nifty after a 120 point negative closing is entering an important support zone. This support zone has 3 layers. The First of the support lies at 25322 which is just above the mid-channel. The second for Nifty is near 25222 which is just below the mid channel support.
There is a possibility of bounce either from the current level or either of these 2 levels. If we get a closing below 25322 then there is a possibility that bears might try to pull Nifty down towards 25167 which is the Father line or 200 Hours EMA.
The resistances for Nifty remain at 25404, 25437 which is the Mother line or 50 hours EMA. Post that there are resistances at 25477, 25551 and 25641. Closing above 25641 is required for Nifty to fly towards 26K levels.
Disclaimer: The above information is provided for educational purpose, analysis and paper trading only. Please don't treat this as a buy or sell recommendation for the stock or index. The Techno-Funda analysis is based on data that is more than 3 months old. Supports and Resistances are determined by historic past peaks and Valley in the chart. Many other indicators and patterns like EMA, RSI, MACD, Volumes, Fibonacci, parallel channel etc. use historic data which is 3 months or older cyclical points. There is no guarantee they will work in future as markets are highly volatile and swings in prices are also due to macro and micro factors based on actions taken by the company as well as region and global events. Equity investment is subject to risks. I or my clients or family members might have positions in the stocks that we mention in our educational posts. We will not be responsible for any Profit or loss that may occur due to any financial decision taken based on any data provided in this message. Do consult your investment advisor before taking any financial decisions. Stop losses should be an important part of any investment in equity.
Nifty Analysis EOD – July 10, 2025 – Thursday🟢 Nifty Analysis EOD – July 10, 2025 – Thursday 🔴
"False Hopes, True Drop – Bears Tighten Their Grip"
Nifty opened with a mild 50-point gap-up, but within the very first minute, that optimism was crushed. It dropped nearly 100 points, breaching the previous day’s low, and entered the key support zone of 25405–25418, which held briefly for about half an hour.
But this wasn’t a day for bulls.
After a weak attempt to recover from the 25360 support (which held twice intraday), sellers regained momentum, dragged the index further down, and finally closed at the lowest point of the day – 25348.
🔸 Expiry volatility played its part — trapping option buyers and luring them into false reversals.
🔸 However, quick scalpers and intraday short-sellers likely capitalized well.
🔸 The structure was decisively bearish, with no meaningful intraday bounce.
Tomorrow becomes crucial.
Bulls have one last stronghold at the 25300 level.
Bears, already in charge, may extend the damage further if this breaks.
⚠️ Bias Levels:
🟢 Bullish above: 25420
🔴 Bearish below: 25290
⚪ Between = Neutral / Watch Mode
🕯 5 Min Time Frame Chart with Intraday Levels
🕯 Daily Time Frame Chart with Intraday Levels
🕯 Daily Candle Breakdown
Open: 25,511.65
High: 25,524.05
Low: 25,340.45
Close: 25,355.25
Change: −120.85 (−0.47%)
📊 Candle Structure Breakdown
Real Body: 156.40 points – large red candle
Upper Wick: 12.40 points – minimal bullish push
Lower Wick: 14.80 points – bears kept pressure till close
🔍 Interpretation
Bears took over early and never let go
The close at day low shows strong conviction from sellers
Lack of significant wicks → no real fight from bulls
🕯 Candle Type
Bearish Marubozu-style candle – clear sign of dominance by sellers, and potential for continuation if no quick reversal
📌 Key Insight
Market is in a critical zone — hovering above the edge of deeper correction
25300–25290 is the line in the sand
A breakdown below can target 25,200–25,250
Bulls can only regain momentum above 25,420
🛡 5 Min Intraday Chart
⚔️ Gladiator Strategy Update
ATR: 189.49
IB Range: 113.75 → Medium IB
Market Structure: 🟡 Balanced
Trades Triggered
10:52 AM – Short Trade → 🎯 Trail SL Hit (R:R 1:0.38)
📌 Support & Resistance Zones
Resistance Levels
25,380
25,405 ~ 25,418
25,470 ~ 25,480
25,530
25,545 ~ 25,550
Support Levels
25,315 ~ 25,295
25,260
25,212 ~ 25,180
25,125
💭 Final Thoughts
"Expiry days often blur the picture, but today’s price action was sharp. Unless bulls step up quickly, the breakdown may just be getting started."
✏️ Disclaimer
This is just my personal viewpoint. Always consult your financial advisor before taking any action.

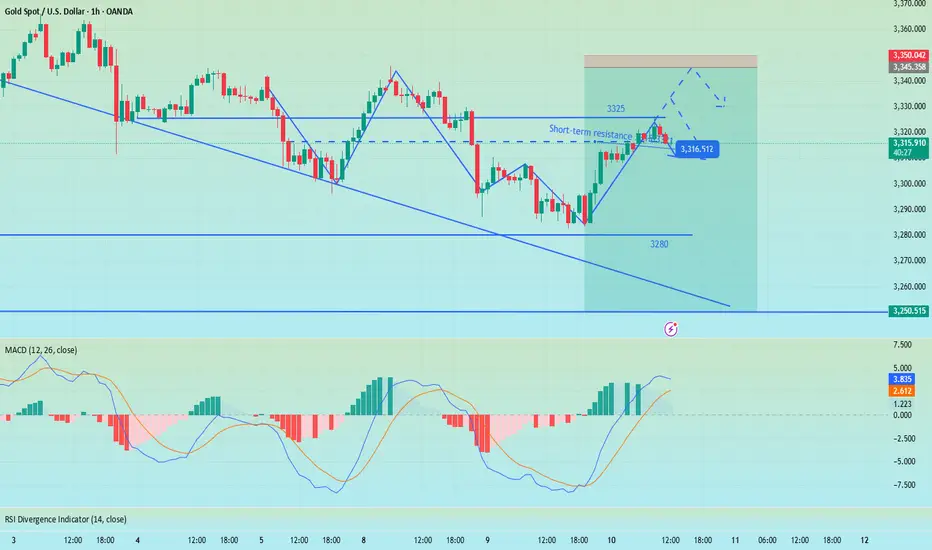
Bearish is still the main trend, first test 3250 supportYesterday, as the market expected a trade agreement to be reached between the US and its trading partners, risk sentiment was boosted. The strengthening of DXY and the rise in US Treasury yields put some pressure on gold.
On Monday, gold rebounded to 3320, and on Tuesday it touched above 3320 and began to fall sharply. In the short term, 3320 is a key trading position that we need to pay attention to. From the daily chart, the support line of 3320 has been completely broken, and the two major support points below are 3250 and 3200 respectively. Judging from the 4H chart, the decline may have just begun. Next, we may first face a test of the 3250 support line. If the 3250 support can be maintained, gold will maintain a volatile consolidation in the short term. Otherwise, if it falls below 3250, it will test the 3200 mark.
OANDA:XAUUSD
Gold fluctuates, continue to short at 3345 during the dayTrump's trade policy continues to stimulate risk aversion. Although the Federal Reserve's meeting minutes are neutral, they can potentially provide support for gold. Yesterday we gave the short positions of 3321 and 3333, which have generated profits so far. At the same time, it should be noted that the 4H MACD indicator has the potential demand to form a golden cross. In the short term, there is a certain suppression force at 3330-3335. If the Asian and European sessions repeatedly test this position but fail to break through effectively, you can go short without hesitation. If you want to go short again during the day, you can consider 3340-3345 and defend 3350. The lower 3310-3305 is a relatively strong support area during the day. If the Asian session retreats to this point, you can consider going long, with the target looking at 3330-3335.
OANDA:XAUUSD
Perfect prediction, pay attention to the high short entry pointTrump extended the tariff agreement to August 1 and began to collect tariffs again. Although it eased market tensions, his remarks will not be extended after the expiration, and he issued a tariff threat, which increased global trade uncertainty and pushed up risk aversion. There was no clear direction coming out of the Fed's meeting minutes last night, but the potential bias was bullish.
At the beginning of the Asian session this morning, I also indicated that gold would rise and then fall. At present, it has reached the highest point near 3325 and then began to retreat, but the 4H golden cross has just been formed. There is still a certain pressure above 3333. If the gold price repeatedly competes for this position, we can continue to short without hesitation. The second short position today is near 3340-3345. There is potential momentum for the bulls in the short term. If the European session continues to fluctuate below 3333, then the entry of short positions will be slightly more stable. Yesterday, short orders were given at the key points of 3321 and 3333, and TP looked at 3310. If the bulls re-emerge below 3310-3305, you can consider short-term long positions and target 3330-3335.

Gold rebounds as expected, NY focuses on the Fed meeting📰 News information:
1. Federal Reserve meeting minutes
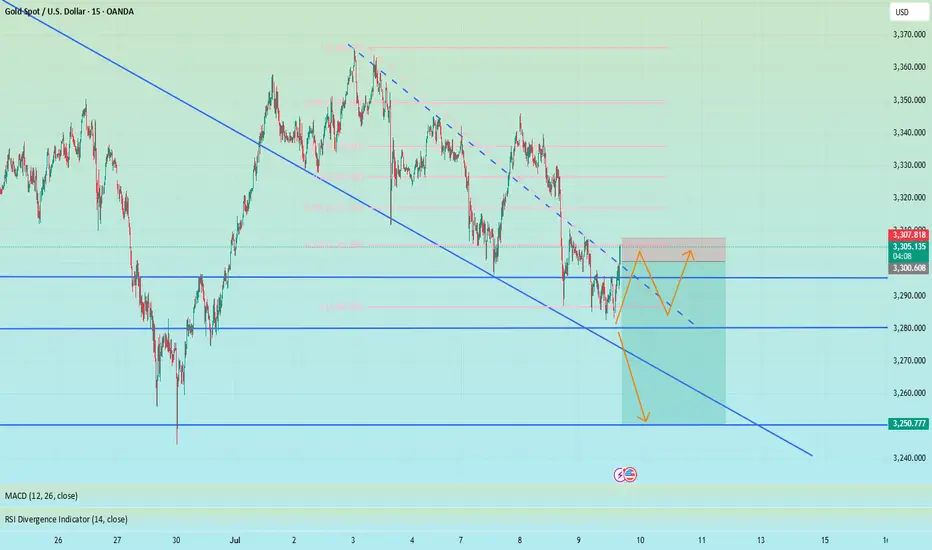
📈 Technical Analysis:
Gold fell into a narrow range of fluctuations during the European trading session. As I said this morning, gold is expected to rebound in the short term and the bullish momentum needs to be released. From a technical perspective, the overall market is still in a volatile pattern. The support at the 3280 level below is still a key point that needs attention in the short term. The European session has repeatedly tested this area. If it falls below this support, it is expected to touch the 3250 level as I said. While guarding against gold diving during the NY session, the upper resistance of 3315-3321 cannot be ignored to prevent bullish retaliation.
🎯 Trading Points:
SELL 3315-3321-3333
TP 3300-3290-3280-3250
In addition to investment, life also includes poetry, distant places, and Allen. Facing the market is actually facing yourself, correcting your shortcomings, facing your mistakes, and exercising strict self-discipline. I share free trading strategies and analysis ideas every day for reference by brothers. I hope my analysis can help you.
OANDA:XAUUSD PEPPERSTONE:XAUUSD FOREXCOM:XAUUSD FX:XAUUSD FXOPEN:XAUUSD TVC:GOLD
CHAINLINK (LINKUSD): Very Bullish Outlook
I see 2 strong bullish confirmations on LinkUSD on a daily time frame.
The price violated 2 significant structures: a vertical falling resistance - a trend line
and a neckline of an inverted head & shoulders pattern.
With a high probability, the market will rise more.
Next resistance - 15.38
❤️Please, support my work with like, thank you!❤️

CROUSDT trading ideaCROUSDT is holding above the Immediate Demand Zone near $0.068. A successful defense here could trigger a bullish recovery targeting $0.166, $0.232, and possibly $0.881 if price breaks the long-term descending trendline and reclaims the Internal Supply Zone. However, a breakdown below this level could send price toward the Crucial Demand Area around $0.039.

VRAUSDT correction is done time to flyVRAUSDT is presenting a clear completion of a WXY corrective structure into the defined Area of Interest, offering a potential re-accumulation opportunity. Price is currently reacting from the major demand zone with initial upside targets around 0.005284 and a secondary target aligning with the Supply Zone of Interest near 0.015081. The overall structure suggests a corrective phase conclusion with prospects of a new bullish impulse. Future validation will depend on sustained bullish momentum from the current demand area.

Forex Weekly Round-Up: DXY, GBPUSD, EURUSDKey Price Zones (DXY): 97.422 - 97.685
🟦 DXY (Dollar Index):
On paper, USD had a strong week:
🔹 Durable Goods smashed expectations (+8.6% vs 0.5%)
🔹 PMIs, GDP Price Index, and Jobless Claims came in solid
But the market ignored it:
🔻 Consumer Confidence disappointed (93.0 vs 99.4)
🏠 New Home Sales missed
🕊️ Fed Chair Powell stayed soft — no aggressive tightening talk
Result?
Despite strong fundamentals, DXY broke down, sweeping daily lows and printing fresh bearish structure.
It’s now down ~10% YTD — the worst first half in over 50 years.
📈 EURUSD & GBPUSD: Holding Strong Despite Weak Data
EURUSD
German Retail Sales: –1.6%
Import Prices: –0.7%
ECB tone: muted
Still, EURUSD held daily support and gained — thanks to broad USD weakness.
GBPUSD
Current Account widened (–£23.5B), GDP unchanged
No standout UK catalyst
Yet GBPUSD held its ground and edged higher as DXY continued to fall.
🧠 What This Tells Us
Strong data isn’t always enough.
When price action, market sentiment, and liquidity targets align — they override the numbers.

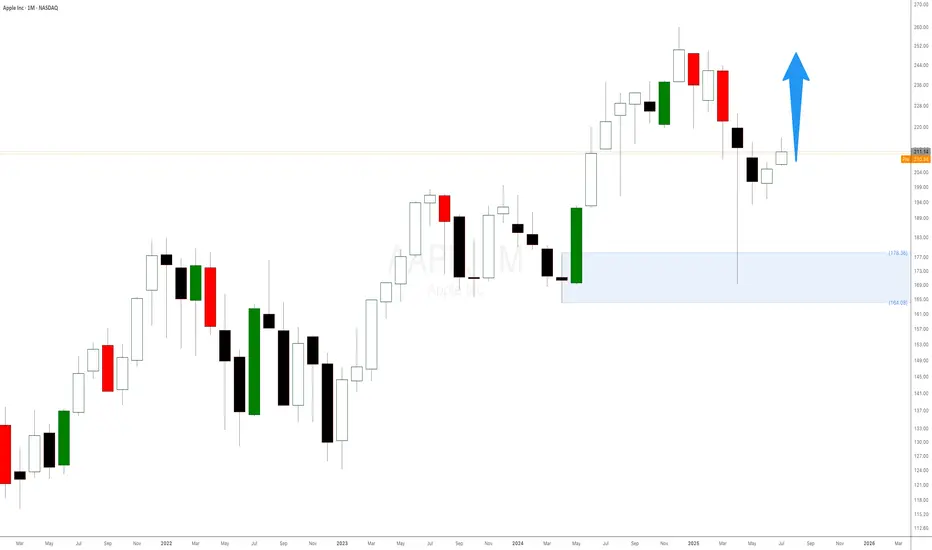
Apple Stock Is Surging! Here’s What Most People MissWhen it comes to trading, we don’t care about the latest news headlines or whether some analyst has upgraded or downgraded Apple stock. We focus on one thing and one thing only: the undeniable forces of supply and demand imbalances on higher timeframes.
Right now, Apple’s monthly chart is a textbook example of how waiting for a strong demand imbalance pays off. That $178 monthly level is no random number. It’s the exact origin of a massive bullish impulse that happened in June 2024 — the kind of move that only happens when smart money and big institutions step in, creating an imbalance that pushes the price away rapidly.
📈 It’s Not About Fundamentals. It’s About Imbalances.
Most retail traders waste time chasing news, earnings, or rumours about iPhone sales. But if you think about it, all those factors are already priced in once a strong imbalance is formed. Institutions don’t wait for tomorrow’s news — they plan their positions weeks or months ahead, and those footprints are visible right on your chart.
The $178 level indicates a significant drop in supply and a surge in demand large enough to propel Apple higher, marked by consecutive large bullish candlesticks. That’s our signal — nothing more, nothing less.
Sell GC based on 15M bearish unicorn breakerGC swept previous day high, 4h high during London open. It reversed sharply making 15M bearish change in state of delivery (CISD) and moving through 15M breaker and forming 15M FVG. Nice ICT unicorn breaker!
I have my sell limit placed at the low of 15m FVG. Will be targeting RR 1:2.

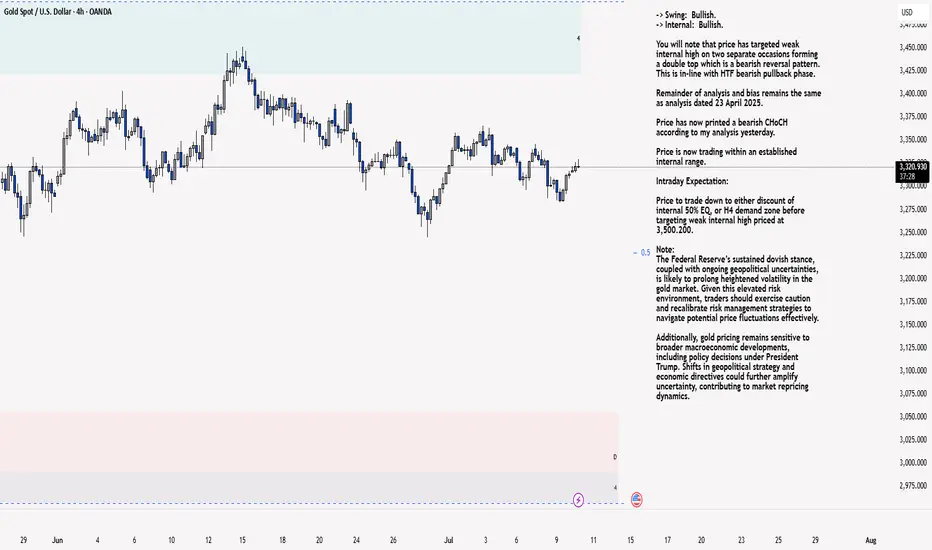
XAU/USD 10 July 2025 Intraday AnalysisH4 Analysis:
-> Swing: Bullish.
-> Internal: Bullish.
You will note that price has targeted weak internal high on two separate occasions forming a double top which is a bearish reversal pattern. This is in-line with HTF bearish pullback phase.
Remainder of analysis and bias remains the same as analysis dated 23 April 2025.
Price has now printed a bearish CHoCH according to my analysis yesterday.
Price is now trading within an established internal range.
Intraday Expectation:
Price to trade down to either discount of internal 50% EQ, or H4 demand zone before targeting weak internal high priced at 3,500.200.
Note:
The Federal Reserve’s sustained dovish stance, coupled with ongoing geopolitical uncertainties, is likely to prolong heightened volatility in the gold market. Given this elevated risk environment, traders should exercise caution and recalibrate risk management strategies to navigate potential price fluctuations effectively.
Additionally, gold pricing remains sensitive to broader macroeconomic developments, including policy decisions under President Trump. Shifts in geopolitical strategy and economic directives could further amplify uncertainty, contributing to market repricing dynamics.
H4 Chart:
M15 Analysis:
-> Swing: Bullish.
-> Internal: Bullish.
H4 Timeframe - Price has failed to target weak internal high, therefore, it would not be unrealistic if price printed a bearish iBOS.
The remainder of my analysis shall remain the same as analysis dated 13 June 2025, apart from target price.
As per my analysis dated 22 May 2025 whereby I mentioned price can be seen to be reacting at discount of 50% EQ on H4 timeframe, therefore, it is a viable alternative that price could potentially print a bullish iBOS on M15 timeframe despite internal structure being bearish.
Price has printed a bullish iBOS followed by a bearish CHoCH, which indicates, but does not confirm, bearish pullback phase initiation. I will however continue to monitor, with respect to depth of pullback.
Intraday Expectation:
Price to continue bearish, react at either M15 supply zone, or discount of 50% internal EQ before targeting weak internal high priced at 3,451.375.
Note:
Gold remains highly volatile amid the Federal Reserve's continued dovish stance, persistent and escalating geopolitical uncertainties. Traders should implement robust risk management strategies and remain vigilant, as price swings may become more pronounced in this elevated volatility environment.
Additionally, President Trump’s recent tariff announcements are expected to further amplify market turbulence, potentially triggering sharp price fluctuations and whipsaws.
M15 Chart:
Don’t be too optimistic, gold may change its face at any time!Gold continued to rebound to around 3320, and it seems to have completely stood above 3300. The bulls are recovering. Should we chase gold in a big way? In fact, due to the disruption of news such as the Federal Reserve's interest rate decision and tariffs, the gold market has clearly shown the characteristics of frequent switching between long and short positions and discontinuity between long and short positions. Therefore, even if gold rebounds to a certain extent, it is difficult for the market to stand unilaterally on the bull side.
In the short term, gold began to retreat from around 3366, reaching a minimum of around 3283, with a retracement of $83; and currently it has only rebounded from the low of 3283 to around 3320, and the rebound is even less than 50%. Gold bulls are not as strong as imagined; although gold continues to rebound, before regaining the 3325-3335 area, it can only be regarded as a technical repair of the sharp drop, and cannot be completely regarded as a reversal of the trend. So after the rebound of gold, gold bears may counterattack strongly at any time.
Therefore, in short-term trading, after gold rebounds, you can consider shorting gold with the 3325-3335 area as resistance, and the first entry area worth paying attention to is 3320-3330.

GBPJPY: Bullish Move From SupportGBPJPY may continue rising from the highlighted blue horizontal support level.
A brief liquidity spike below that, followed by a bullish imbalance candle on the 4-hour chart, supports this.
I anticipate a rise to 199.94.

Short gold, the bears will still counterattack after the reboundGold rebounded to the 3305-3315 area as expected, and our gold long position successfully won 360pips profit. So after standing above 3,300 again, will gold resume its bullish trend?
I think that although gold has stood above 3300 again, it cannot be confirmed that the decline has been completely reversed for the time being. Relatively speaking, gold bears still have the upper hand. In the short term, gold is under pressure in the 3325-3335 area, so before recovering this area, gold bears still have repeated fluctuations, and may even test the 3305-3295 area again. So we can't blindly chase gold in trading.
Before gold recovers the 3325-3335 area, gold can only be regarded as a rebound, not a reversal. So gold bears may counterattack at any time, so in short-term trading, we can consider shorting gold with the 3325-3335 area as resistance after gold rebounds. The first entry area that must be paid attention to is 3320-3330.

Start buying gold, a rebound may come at any time!Gold is undoubtedly weak at present, and bears have the upper hand. However, since gold touched the 3290-3280 area, gold bears have made more tentative moves, but have never really fallen below the 3290-3280 area, proving that as gold continues to fall, bears have become more cautious.
From the perspective of gold structure, multiple technical structural supports are concentrated in the 3285-3275 area, which makes it difficult for gold to fall below this area easily. After gold has failed to fall below this area, gold is expected to build a short-term bottom structure with the help of multiple supports in this area, thereby stimulating bulls to exert their strength and a rebound may come at any time.
Therefore, in the short term, I do not advocate chasing short gold; instead, I prefer to try to find the bottom and go long gold in the 3290-3280 area; but we should note that because gold is currently in an obvious short trend, we should appropriately reduce the expectation of gold rebound, so we can appropriately look at the rebound target: 3305-3315 area.

$BTC Daily Outlook BYBIT:BTCUSDT.P
Macro Picture
Weekly Chart
Both Bias & Momentum aligned bullish
Moving towards 111968.0 vLevel (HH) - ATH
Be careful with Weekly FA from that Level
More upside room from here
vLevels Range between 111968.0 - 77083.5
Daily Chart
Both Bias & Momentum aligned Bullish
Failed Auction at 102000.0
Validated from Volume Footprint Charts - Selling Delta trapped on this Failed Auction - POC & Value Area at Wick Lows
vLevels Range between 111968.0 - 102000.0
More Upside room from here, but overall consolidation for now as we are inside a High Volume Node
A pullback would be ideal to look for entries
10-Hour Chart
Price is currently inside an Inside Bar Range between 109740.9 - 107134.7
Overall momentum from the Intraweek Chart (10-Hour) is bearish due to a Failed Auction around 109740.9
Need to wait for confirmation for New Failed Auction Today.
vLevels zone around 105335.0 - 104567.0
Would be nice to have a pullback towards this zone, in which we can start looking for rejections for Intra-Week Longs
Nice zone to look for longs is also IB Range Low 107134.7
Intraday Picture
1-Hour Chart
No outlook for now, waiting for Intra-Week Chart Confirmation
No shorts from here, as HTF bias & momentum remain bullish
Patience - Overall range, don't want to get chopped here.
10-Minute Chart
No Outlook for now, waiting for MTFs and HTFs confirmation
Bitcoin Outlook — Narrative Recap
On the higher time-frames the picture is straightforward: both weekly and daily bias and momentum are in sync to the upside. Price is grinding toward the prior all-time high vLevel at 111 968 USD. Treat that level with respect, if a weekly failed auction (FA) forms there, it could mark the next inflection, but for now there is still air between price and that resistance. The broader weekly value range spans from 111 968 USD down to 77 083 USD.
The daily chart reinforces the bullish thesis. A failed auction printed at 102 000 USD, and volume-footprint data show sell-side delta trapped at those wick lows; the point of control and value area also sit there. 102 k is now strong support. Price is chopping inside a high-volume node, so a healthy pullback toward 102 k (or at least into value) would be the ideal place to reload longs before the next push higher.
Drop to the 10-hour “intra-week” view and momentum tilts short-term bearish. Price is boxed inside an inside-bar range between 109 741 USD and 107 135 USD after a failed auction at the range high. The preferred play is patience: let price drift into either the IB low at 107 135 USD or, even better, the deeper vLevel cluster at 105 335 USD – 104 567 USD. There we’ll watch for a fresh failed auction or obvious seller exhaustion to trigger new longs targeting the ATH zone.
On the 1-hour and 10-minute intraday charts there is no edge yet, conditions are choppy and hostage to the intra-week setup to align with the Higher Timeframes. With higher-time-frame bias still firmly bullish, fading strength makes little sense; stand aside until the 10-hour chart confirms a pullback and reversal.
Bottom line: stay bullish, stalk a pullback, and look to join strength from 107 k or 105–104 k. A decisive daily close back below 102 k would force a rethink; until then, patience is the edge.

NZDUSD LONGMarket structure bullish on HTFs DW
Entry at both Daily and Weekly AOi
Weekly rejection at AOi
Weekly Previous Structure Point
Daily Rejection at AOi
Previous Daily Structure Point
Daily EMA retest
Around Psychological Level 0.60000
H4 Candlestick rejection
Levels 4.93
Entry 100%
REMEMBER : Trading is a Game Of Probability
: Manage Your Risk
: Be Patient
: Every Moment Is Unique
: Rinse, Wash, Repeat!
: Christ is King.

7.9 Latest gold trend analysis and operation layout📰 News information:
1. Federal Reserve meeting minutes
📈 Technical Analysis:
Our decision to close our positions at 3305 yesterday was undoubtedly a very strategic one. After reaching a high of around 3310 last night, it began to fall. At the same time, I also gave VIP members the news that it might fall back to around 3300. Since the opening, the lowest point has reached around 3285. The overall trend is still under our control.
At present, gold will still usher in technical corrections in the short term. The current price of 3293-3290 support can be considered for long positions. If the European session continues to fall below the low, you can try to go short during the NY session. If the European session continues to maintain sideways consolidation, you can consider retreating and going long during the NY session. As long as the key support of 3250 below is held, gold will maintain its consolidation trend in short-term trading. On the contrary, once it falls below 3250, gold may directly touch the 3200 mark. Focus on the minutes of the Federal Reserve meeting, which may further influence the trend of gold.
🎯 Trading Points:
BUY 3293-3290-3285
TP 3305-3310-3320
In addition to investment, life also includes poetry, distant places, and Allen. Facing the market is actually facing yourself, correcting your shortcomings, facing your mistakes, and exercising strict self-discipline. I share free trading strategies and analysis ideas every day for reference by brothers. I hope my analysis can help you.


GBPUSD: Bullish Move After Liquidity Grab 🇬🇧🇺🇸
GBPUSD formed a bullish high range candle with a long lower wick going
below a key horizontal demand zone on a 4H.
A consequent recovery and a bullish London session opening suggest
a highly probable rise today.
Goal - 1.363
❤️Please, support my work with like, thank you!❤️
I am part of Trade Nation's Influencer program and receive a monthly fee for using their TradingView charts in my analysis.
