US10Y & T-BOND Weekly UpdateWeekly Target: 4.432% - 4.412%
- Yield drifted down to ~4.23% despite strong data.
- Market still pricing in rate cuts later this year.
- Divergence: Durable Goods, GDP, and PMI were solid — but yields faded → risk-on demand + safe haven unwind.
Candlestick Analysis

The intraday low has already appeared, so go long on gold boldlyGold unexpectedly fell sharply to around 3287. To be honest, the short position is relatively strong. However, since gold fell below 3000, we can clearly see that gold has shown strong resistance to falling during the decline, and the volatility tends to converge around 3287, proving that the buying support below is strong; and as gold continues to retreat, the off-market wait-and-see funds will be more willing to go long on gold; and some short positions will be more willing to go long on gold after profit taking;
In addition, although the short position is strong, it is difficult to continue in the short term. The intraday decline is basically in place. It is estimated that 3287 is the intraday low, so at this stage, it is inconvenient for us to continue to chase short gold. On the contrary, we can boldly go long on gold in the 3305-3295 area and look at the target area: 3320-3330.

Copper LongsBullish Bias for copper. Looking for daily BPR target, then possibly relative equal highs.
Ideally would like to pair a bullish weekly profile with longs. If the week opens lower first and delivers to a key level, thats favoring longs. So looking for Monday, Tuesday or Wednesday to create the low of the week.
I see a daily MMBM in play. Price expanded off the breaker block. If bsl is the dol, price should expand hard of EQ of the range.

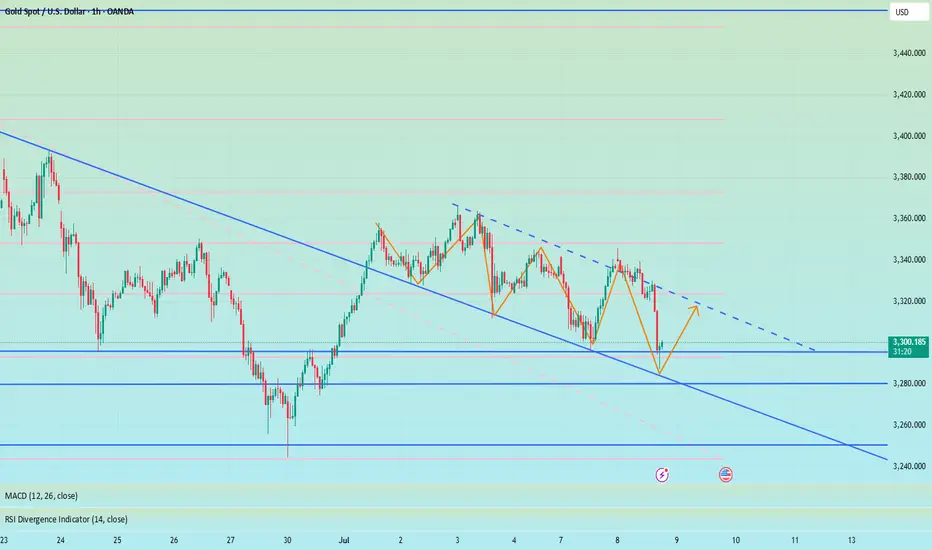
Short-term gold bulls and bears are anxious,3330 becomes the keyAt present, the market has been fluctuating narrowly in the range of 3330-3320, and both bulls and bears are in a stalemate. However, gold has formed a double-layer head and shoulders bottom pattern, so the short-term bullish trend is definitely unchanged. In the previous post, I also mentioned that if the rebound in the European session is weak and gold continues to be below 3345, then the short-term NY session may usher in a retracement and a second bottom. Therefore, I still hold a long order of 3325-3315, and temporarily modify the TP to the 3335 line. I expect that there may be a retracement here, but there may also be a direct retracement. No matter what the situation is, we need to stabilize before entering the market.
In addition to investment, life also includes poetry, distant places, and Allen. Facing the market is actually facing yourself, correcting your shortcomings, facing your mistakes, and exercising strict self-discipline. I share free trading strategies and analysis ideas every day for reference by brothers. I hope my analysis can help you.
PEPPERSTONE:XAUUSD FOREXCOM:XAUUSD FX:XAUUSD FXOPEN:XAUUSD OANDA:XAUUSD TVC:GOLD

How to solve the problem of order being trapped in a loop📊 Gold Day Trading Strategy (Recommendation index ⭐️⭐️⭐️⭐️⭐️)
📰 News information:
1. The lasting impact of new tariffs
2. The impact of geopolitical conflicts
3. The Fed’s interest rate cut
📈 Technical Analysis:
The recent market conditions have been volatile. Many brothers have reported that they have been trapped recently. They have just been released from short positions, but have fallen into the situation of being trapped by long orders again. I have also encountered such a situation recently. Brothers who follow me must know that I have been trapped, but in the process of being trapped, I still share my trading ideas for the brothers who are trapped to check, so that we can all get out of the trap.
Gold fell as expected and hit the lowest point of 3287 before rebounding. The current 3300-3290 range given at the bottom has certain support. At present, I have answered it. As long as it does not fall below 3285, we can still go long and look for rebound correction. TP can temporarily look at 3305-3310. At present, the short-term upper watershed is near the 3321 line. As time goes by, the medium-term point can be seen at 3345. Only when the price stands above 3345 can the upward momentum continue to touch the 3380 line, or even 3400. In the short term, you can go long if you look at the support below. In the short term, pay attention to the resistance above 3315-3320. If it encounters resistance under pressure, it will fall back. On the contrary, after breaking through the first level of resistance, the upward trend will continue.
🎯 Trading Points:
BUY 3300-3290-3285
TP 3305-3315-3320-3345
SELL 3315-3321
TP 3300-3290
In addition to investment, life also includes poetry, distant places, and Allen. Facing the market is actually facing yourself, correcting your shortcomings, facing your mistakes, and exercising strict self-discipline. I share free trading strategies and analysis ideas every day for reference by brothers. I hope my analysis can help you.
TVC:GOLD OANDA:XAUUSD FXOPEN:XAUUSD FX:XAUUSD FOREXCOM:XAUUSD PEPPERSTONE:XAUUSD
The shock continues, and the retracement continues to go long📊 Gold Day Trading Strategy (Recommendation index ⭐️⭐️⭐️⭐️⭐️)
📰 News information:
1. The lasting impact of new tariffs
2. The impact of geopolitical conflicts
3. The Fed’s interest rate cut
📈 Technical Analysis:
From the hourly chart, gold has formed a head and shoulders bottom. At present, 3320 below has formed a certain support in the short term. For now, the daily line still cannot close below 3320. If the daily line closes below 3320, the decline may open further. On the contrary, the current upper suppression position of gold is near 3350. If the daily line stands above 3350 again, it will be a bull-dominated trend and may test 3380-3390 above. In the short term, pay attention to the support line of 3325-3315 below. If it retreats to the support level, you can consider going long. Look to the resistance range of 3340-3350 above, and pay special attention to the suppression line of 3365-3370. At the same time, if the European session is always suppressed below 3345 and sideways, there is no performance, so you should consider selling it, and there may be further retreat in the evening.
🎯 Trading Points:
BUY 3330-3325-3315
TP 3340-3350-3365
In addition to investment, life also includes poetry, distant places, and Allen. Facing the market is actually facing yourself, correcting your shortcomings, facing your mistakes, and exercising strict self-discipline. I share free trading strategies and analysis ideas every day for reference by brothers. I hope my analysis can help you.
TVC:GOLD OANDA:XAUUSD FXOPEN:XAUUSD FX:XAUUSD FOREXCOM:XAUUSD PEPPERSTONE:XAUUSD

Bear signalsLooking for 22500 Im thinking. Banks trade the round numbers and the round numbers for nas are 125 point increments

WTI CRUDE OIL (USOIL): More Growth Ahead
Crude Oil broke and closed above a significant resistance.
The price is now retesting that.
I think that the market is going to rise.
Next resistance - 68.5
❤️Please, support my work with like, thank you!❤️

AUDCAD 15min ICT 1:2 bullish trade 1. Daily
• Sell-side liquidity swept below previous low.
• Price bounced from a bullish order block.
• Bias: Bullish, targeting draw on liquidity above.
2. 4H
• Bullish FVG respected.
• Break of structure (BOS) to upside.
• Retracement into OB + FVG → continuation expected.
3. 1H
• Strong displacement candle.
• Price returned to 1H FVG + OB.
• MSS confirms shift in bullish momentum.
15M
• Liquidity sweep + market structure shift.
• Entry on return to OB or FVG.
• Target: Equal highs / 4HR.

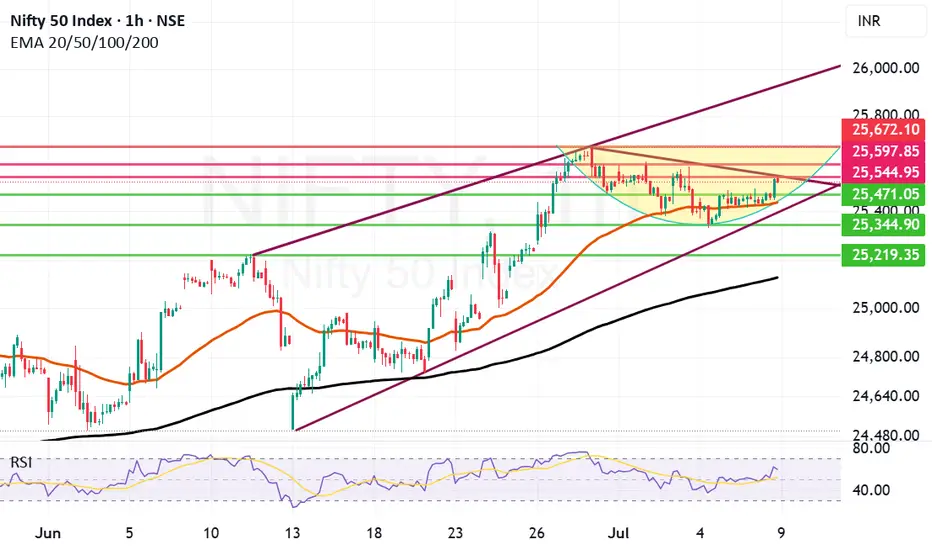
Closing above 25544 should be first step for Nifty to break freeNifty today closed in positive but still it might not be free enough to crate further bull run. the first step that Nifty needs to take to get out of this range bound trade zone or consolidation is to get a closing above 25544.
Further to this step it my find resistances at 25597, 25672. Once we close above 25672 the possibility that Bulls can regaining 26K levels and go even higher becomes stronger.
The Supports for Nifty currently remain at 25471, 25437 which is Mother line or 50 Hours EMA, 25344, 25219 and finally 25125. 25125 is the Father line support or 200 hours EMA. Closing below 25215 will empower Bears to drag Nifty further down wards.
Disclaimer: The above information is provided for educational purpose, analysis and paper trading only. Please don't treat this as a buy or sell recommendation for the stock or index. The Techno-Funda analysis is based on data that is more than 3 months old. Supports and Resistances are determined by historic past peaks and Valley in the chart. Many other indicators and patterns like EMA, RSI, MACD, Volumes, Fibonacci, parallel channel etc. use historic data which is 3 months or older cyclical points. There is no guarantee they will work in future as markets are highly volatile and swings in prices are also due to macro and micro factors based on actions taken by the company as well as region and global events. Equity investment is subject to risks. I or my clients or family members might have positions in the stocks that we mention in our educational posts. We will not be responsible for any Profit or loss that may occur due to any financial decision taken based on any data provided in this message. Do consult your investment advisor before taking any financial decisions. Stop losses should be an important part of any investment in equity.
Gold is expected to regain bullish momentum and continue to 3360Yesterday, gold rebounded from 3296 and was able to reach around 3345. Although the process was rather painful, we have to admit that gold bulls still have the energy to wrestle with bears, and the gold market is not one-sidedly dominated by bears. As gold gradually tested and confirmed the effectiveness of support during the retracement process and then rebounded effectively, the short-term structure of gold gradually changed and began to favor bulls.
After gold hit bottom and rebounded yesterday, we can clearly see from the short-term structure that gold has successfully constructed a head and shoulders bottom structure in the three areas of 3295-3244-3296 in the short term, thus playing an absolute supporting role in the structure; and in the process of repeated testing of gold, there are signs of constructing a head and shoulders bottom structure in the three areas of 3310-3296-3325 locally again. Under the effect of the structural support resonance of the head and shoulders bottom, gold may not go below 3320 again, and may even regain the bullish trend and continue to the 3345-3355 area.
So I think there is a lot of profit potential in going long on gold. We can go long on gold with the 3330-3320 area as support and look towards the target area: 3340-3350-3360
EURUSD Short, 08 JulyHTF Bearish Continuation & Intraday Confirmation
HTF bias remains bearish, reacting from W/D OB and completing the daily imbalance left from yesterday. Now looking for continuation lower, supported by a clean 4H OB.
📉 Confluence:
15m Decisional OB in play
5m OB entry zone with a clean 1m BOS
DXY gap + imbalance still open in our favor + Correlation between EU and DXY
Asia session structure aligned
🎯 Entry: Retest of 5m OB after 1m BOS
🛡️ SL: Above recent high, ~10 pips
📌 TP: Asia low – 1:3 RR
⚠️ Risk: OB is mid-Asia (less ideal), and DXY Daily imbalance not filled yet
Still a solid setup with structure + HTF narrative backing it.

TIAUSDT Monitoring Completion of Bearish 5-Wave FormationTIAUSDT remains in a structured downtrend, nearing completion of a potential 5-wave bearish pattern similar to a previous setup that led to an upside breakout before resuming the decline. A similar scenario is anticipated this time, with plans to go long if price action confirms a strong rejection around Wave 5.
A projected ABC corrective move outlines the near-term bullish targets. The $4.648 level will act as a key pivot; a breakout above it could shift momentum bullishly, opening the path toward $9.144. However, failure at that level may trigger renewed downside toward the $1.30–$1.55 demand zone.

GBPCAD: Bullish Continuation Ahead?! 🇬🇧🇨🇦
One of the pairs that we discussed on the today's live stream
is GBPCAD.
The price nicely respected a key daily/intraday horizontal support.
A double bottom pattern on that and a bullish violation of its neckline
provide strong bullish confirmations.
I expect up move to 1.8666
❤️Please, support my work with like, thank you!❤️
I am part of Trade Nation's Influencer program and receive a monthly fee for using their TradingView charts in my analysis.

GOLD (XAUUSD): Pullback From ResistanceI believe that 📉Gold price may continue to decline from the identified resistance level.
This outlook is supported by the formation of a cup and handle pattern on an hourly time frame.
My target for this retracement is set at 3312.

GBPCAD: Classic Pullback Trade for TodayThe GBPCAD pair formed a head and shoulders pattern at a crucial daily/intraday horizontal support level.
The recent breach of its neckline indicates a notable strength of buyers, suggesting a bullish momentum.
Given this technical setup, I anticipate that the pair could rally and potentially reach the 1.8650 level in the near term.

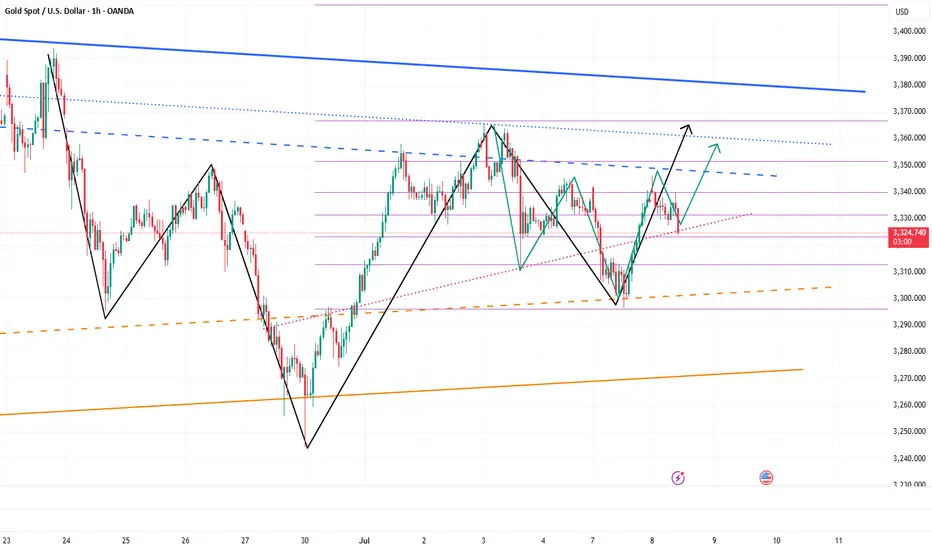
Below 3360, short sellers still have profit potential!Although gold has steadily rebounded to around 3345, compared with yesterday's gold falling below 3330 again, the rebound in the short term is not strong; overall, gold is still in a weak and volatile pattern, with pressure from the upper side at 3350-3360; and there is technical buying support in the lower 3300-3290 area. It is under the influence of the resistance area and the support area that gold lacks continuity.
So before gold breaks through effectively, I think both the long and short sides of gold have profit potential, so for the current short-term trading, we can temporarily maintain the high-sell-low-dregs trading within the range.
1. Consider shorting gold in batches with 3345-3365 as resistance, TP: 3330-3320-3310;
2. Consider going long gold in batches with 3325-3305 as support, TP: 3345-3355-3365

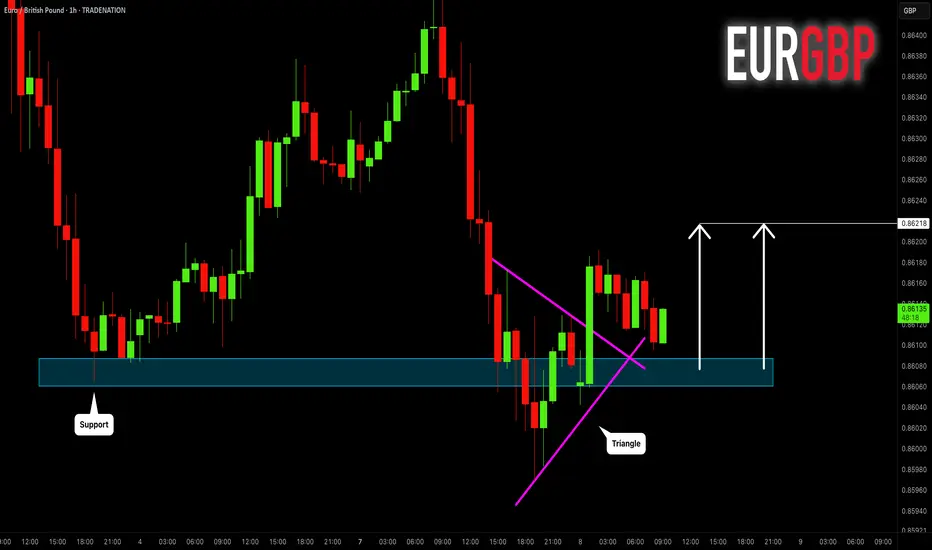
EURGBP: Bullish Move After False Breakout 🇪🇺🇬🇧
EURGBP will likely go up from a key daily/intraday support,
following a bullish breakout of a resistance line
of a bullish triangle on an hourly time frame.
The price may go up to 0.86218 level then.
❤️Please, support my work with like, thank you!❤️
I am part of Trade Nation's Influencer program and receive a monthly fee for using their TradingView charts in my analysis.
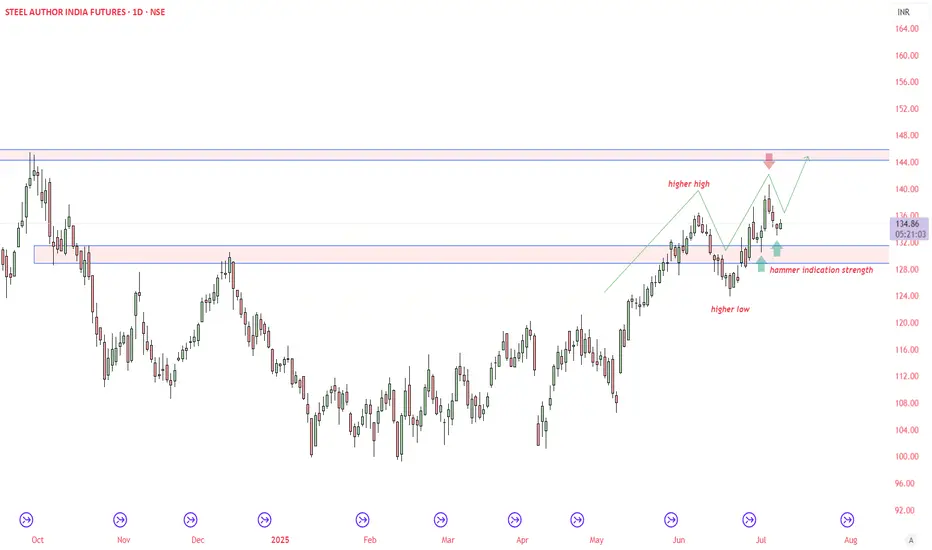
SAIL FUTURE - Strengthening on Daily time frameSAIL future getting strengthening along with metal sector in India. SAIL may surge toward 145-148 zone.
This is for educational purpose only - Do your own research before taking any trades
How a Triple Breakout and Daily Reversal Signal Point to a 25%..How a Triple Breakout and Daily Reversal Signal Point to a 25% Bullish Opportunity on EURCAD
Introduction
A strong bullish signal has formed on the EURCAD currency pair, capturing the attention of traders using a combination of
breakout confirmation and daily chart reversal signals. With a clear confluence across the 4-hour, daily, and weekly timeframes,
this technical setup offers a well-supported case for a buy position with an estimated 25% upside, targeting the 1.6100 level.
Whether traded intraday or held for a few days, the structure of this trade offers exceptional technical clarity and reward
potential.
✅ Key Technical Highlights
🔹 4-Hour Breakout Confirmation
The EURCAD pair has broken decisively above a recent range high on the 4-hour chart. This breakout occurred on increased volume,
which validates the move as more than a false spike. Price action shows bullish momentum building as candles close strongly above
the 50-period EMA, indicating short-term strength.
🔹 Weekly Chart Breakout Structure
Zooming out, the weekly chart reveals that EURCAD has cleanly broken through a key resistance zone, which had previously
capped price several times. The breakout aligns with the long-term trend shift, reinforcing the bullish narrative from a macro
perspective. Support now sits firmly below at previous resistance.
🔹 Daily Chart Reversal Signal
The daily chart offers the most critical insight: a strong reversal pattern, potentially a bullish engulfing or morning star, has
formed near the breakout area. This suggests a change in sentiment and invites buying pressure as traders react to the clear
reversal signal after a recent pullback. This reversal provides
timing precision for the trade.
🎯 Take-Profit and Target Projection
The price target is placed at 1.6100, which corresponds to:
A previous structural high
A Fibonacci extension zone
A round psychological number respected historically
The move to this level offers a potential 25% profit window, depending on entry price and lot size. This makes it attractive for both day traders and short-term swing traders.
🕒 Trade Duration Outlook
While this breakout setup is forming across the weekly and daily charts, the 4-hour entry makes it highly suitable for day trading.
Traders who prefer intraday execution can look for a pullback to breakout support for entry, followed by momentum confirmation
from RSI or volume spikes.
Swing traders may hold the position over several days, aiming for the full stretch to the 1.6100 target, while trailing stops to lock in profits.
⚠️ Risk and News Awareness
Traders must remain cautious of:
Oil price movements, which directly impact CAD strength
Economic data from the Eurozone or Canada (GDP, employment, interest rate updates)
Central bank speeches that may introduce volatility
Risk should be limited by placing stop-loss orders just below the 4-hour breakout level or the low of the daily reversal candle.
📌 Why This EURCAD Setup Matters
This setup is more than just a breakout—it combines:
Multi-timeframe confirmation
Momentum breakout on the 4-hour chart
Weekly structure validation
Daily chart reversal timing
These factors build a strong technical case for bullish continuation and provide high confidence for experienced and new traders alike.
Conclusion
EURCAD presents a powerful trading opportunity backed by clear technical signals across major timeframes. With a 25% upside and
precise entry timing from a daily reversal pattern, this is the kind of setup traders seek for both fast profits and well-structured
trades. Whether approached as a day trade or a swing play, the EURCAD breakout is one to watch.
Disclaimer: This content is for educational and informational purposes only. It does not constitute financial advice or a
recommendation to buy or sell any financial instrument. Use a simulation trading account before you trade with real money and learn risk management and profit taking strategies.

If we are still bullish futures look to expect these levels. If we are still trending bullish a return back to the old gap low found in the fib & the fvg within the 1hr time fractal .. with a continuation of higher futures - we can see the level delineating in gray lines are my upside targets to see want to reprice to in a order to continue higher.
