The short position is losing money. What should we do?Gold hit the intraday low of around 3296 and then began to rebound. We can see that the rebound of gold is not strong, but it is relatively sustained, so gold has rebounded to around 3335. To be honest, I did short gold according to my plan and still hold a short position.
Although gold has rebounded to around 3330, I don’t think my short gold trade has failed. As I said in the previous point of view, gold is facing technical suppression of the head and shoulders in the short term, which will suppress the rebound limit within the 3335-3340 area. So before gold stabilizes at 3340, I think the gold shorts still have the upper hand. So as long as gold stays below 3340, I think the gold rebound is a good opportunity to short gold.
At present, gold is facing the resistance area of 3335-3340 and begins to show signs of stagflation. After consuming a certain amount of bullish momentum, the gold shorts may counterattack strongly again and stimulate gold to fall rapidly. Therefore, before gold breaks upward through the 3335-3345 area, we can still consider shorting gold, or continue to hold a short position in gold!
Candlestick Analysis
USD/JPY Uptrend On the 4hr We can still see price making Higher Lows and Higher Highs.
Price will retrace to 145.200-145.000 before going back up to 148.000.

NZDCAD SHORT Market structure bearish on HTFs DH
Entry at both Daily and Weekly AOi
Weekly Rejection at AOi
Daily Rejection at AOi
Previous Structure point Daily
Around Psychological Level 0.82500
H4 EMA retest
H4 Candlestick rejection
Rejection from Previous structure
Levels 3.29
Entry 100%
REMEMBER : Trading is a Game Of Probability
: Manage Your Risk
: Be Patient
: Every Moment Is Unique
: Rinse, Wash, Repeat!
: Christ is King.

CADJPY LONGMarket structure bullish on HTFs 3
Entry at both Daily and Weekly AOI
Weekly rejection at AOi
Daily Rejection at AOi
Previous Structure point Daily
Daily EMA retest
Around Psychological Level 105.500
H4 Candlestick rejection
Rejection from Previous structure
Levels 3.88
Entry 110%
REMEMBER : Trading is a Game Of Probability
: Manage Your Risk
: Be Patient
: Every Moment Is Unique
: Rinse, Wash, Repeat!
: Christ is King.
XMR 3 Month Heikin Ashi Trend ChartWe have here a trend outlook chart for Monero on a 3 monthly timeframe (Heikin Ashi candlestick chart). XMR is one of a handful of high market cap coins which have showed signs of strength on a variety of indicators (despite high volatility with various other high market cap coins), including the positive MACD and RSI indicators as shown in this chart.
In addition, there has been significant buy volume in the 170 - 277 price range, as can be seen in the Price-Volume indicator to the right of the chart, keeping the price up.
Monero has withstood the political and economic turmoil in recent months making it a strong contender against some of the largest market cap coins. With the current price sitting at approximately USD$315, there is potential for further upside in the long-term.
_____________
This publication and the information contained in it are for educational purposes only, and is not meant to be nor does it constitute financial, investment, trading or other types of advice or recommendations.

90-day tariffs expire, how to position gold next week📰 News information:
1. 90-day tariffs are about to expire
📈 Technical Analysis:
With the Trump administration's massive tax cut and spending bill officially implemented, the U.S. Treasury may start a "supply flood" of short-term Treasury bonds to make up for the trillions of dollars in fiscal deficits in the future. Concerns about the oversupply of short-term Treasury bonds have been directly reflected in prices. The yield of 1-month short-term Treasury bonds has risen significantly since Monday this week. Slowing wage growth, falling total work hours, stagnant wage income growth and concerns about consumer spending are all signs that support gold.
From a technical perspective, Friday's closing long shadow small candle body, the price closed at a high of 3345 and a low of 3224. The overall idea for next week is to follow the trend and rely on the first short-term support of 3323 below to participate in long positions. Secondly, 3315-3305 is given below. If the support point is lost, then 3300 below is also in danger, and there is no need to overly insist on continuing to do more at low levels in the short-term rhythm. The key pressure above is 3340-3350, and the limit is the pressure of 3360 above.
🎯 Trading Points:
BUY 3325-3323
TP 3333-3340-3350
BUY 3315-3305
TP 3325-3333-3340
In addition to investment, life also includes poetry, distant places, and Allen. Facing the market is actually facing yourself, correcting your shortcomings, confronting your mistakes, and strictly disciplining yourself. I hope my analysis can help you🌐.
FXOPEN:XAUUSD PEPPERSTONE:XAUUSD FOREXCOM:XAUUSD FX:XAUUSD OANDA:XAUUSD TVC:GOLD

GBPAUD SHORTMarket structure bearish on HTFs DH
Entry at both Daily and Weekly Rejection
Weekly Rejection at AOi
Daily Rejection At AOi
Previous Structure point Daily
Around Psychological Level 2.09000
H4 Candlestick rejection
Rejection from Previous structure
Levels 4.22
Entry 95%
REMEMBER : Trading is a Game Of Probability
: Manage Your Risk
: Be Patient
: Every Moment Is Unique
: Rinse, Wash, Repeat!
: Christ is King.

Gold fluctuates, beware of rebound caused by new tariffs📊 Gold Day Trading Strategy (Recommendation index ⭐️⭐️⭐️⭐️⭐️)
📰 News information:
1. 90-day tariffs are about to expire
2. New unilateral tariffs
3. Geopolitical situation
📈 Technical Analysis:
As I said this morning, shorting gold is divided into two times, the first time is near 3324, and the second time is at 3340 or 3345. If there is a short-term retracement after breaking through 24, you can follow up with a long order to look at 3335-3340. If gold is in a very weak state, you can consider shorting near 3315 and look at 3300. Because during the European session, 3300 has strong support, and the European session repeatedly tests this support. If it falls below 3300, we will go to 3295-3285, or even 3250. But at the same time, we need to pay attention to the rebound of gold that may be caused by tariff policies and geopolitical situations.
🎯 Trading Points:
SELL 3315-3325-3335
TP 3305-3295-3285
BUY 3290-3285
TP 3300-3310-3320
In addition to investment, life also includes poetry, distant places, and Allen. Facing the market is actually facing yourself, correcting your shortcomings, facing your mistakes, and being strict with yourself. I share free trading strategies and analysis ideas every day for reference by brothers. I hope my analysis can help you.
TVC:GOLD OANDA:XAUUSD FX:XAUUSD FOREXCOM:XAUUSD PEPPERSTONE:XAUUSD FXOPEN:XAUUSD

Stock Index: ES, NQ, YM Weekly Update📈 S&P 500, Nasdaq & Dow Jones – All-Time Highs, But Caution Creeping In
🟩 S&P 500 | Nasdaq | Dow Jones
All three indices hit new all-time highs to close out June.
Powered by:
🔋 AI optimism
💰 Solid earnings
🕊️ Dovish Fed tone and falling bond yields
SPX continued its breakout run
Nasdaq surged as big tech led the charge
Dow followed with slower but steady strength
⚠️ But Watch the Signs Beneath the Surface
Consumer confidence dropped sharply
Home sales weakened
Fed speakers remained non-committal on cuts
All three indices now look extended — particularly Nasdaq
Momentum remains bullish, but these rallies are now resting on softening macro, yield compression, and hope that the Fed stays on hold.
🧠 Key Takeaway
Price action is euphoric — but fundamentals are flashing mixed signals.
When tech leads the market at extremes, volatility risk is elevated.

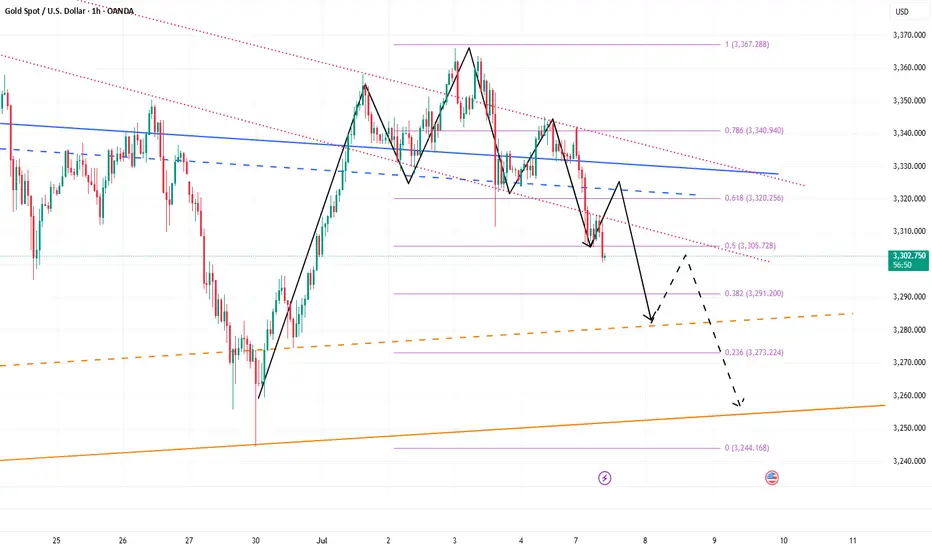
The bears will take the 3290-3280 area stronglyGold started to fall from 3342 during the day and fell below 3300 at one point. Gold is in an obvious short position, and during the London market, gold continued its downward momentum without any decent rebound. Gold is in an extremely weak state. In the absence of a rebound in the London market, I think New York is very likely to continue to fall.
According to the current structure, gold is facing technical suppression of the head and shoulders in the short term, which greatly limits the rebound space of gold and suppresses the rebound limit within 3335. As the center of gravity of gold moves down, the resistance in the short term moves down to the 3315-3325 area. After breaking through 3330, the downward space has been opened up to a certain extent. So don’t be fooled by the false bullish candle that appear near 3330. Gold will inevitably continue to fall to the 3290-3280 area.
The 3290-3280 area is bound to be won, so shorting gold is still the first choice for short-term trading. You can consider shorting gold with the 3315-3325-3335 area as resistance, and look to the target area: 3295-3285-3275.

AUDUSD - RBA Rate Cut and Tariff Deadline in FocusIn a week that is light on economic data and events, with a heavy emphasis towards what happens next once President Trump’s 90-day tariff pause ends on Wednesday (July 9th), the AUDUSD currency pair has more than most for traders to focus on.
This is due to the fact the RBA, the Australian central bank, decides early Tuesday morning (0530 BST) whether to cut interest rates for the third time in a row from 3.85% to 3.6%, as is widely expected by markets, given that inflation has eased in recent months back into the RBA’s 2-3% target range. This announcement is closely followed by the RBA press conference (0630 BST), which could also be an important influence on the direction of AUDUSD depending on the comments Governor Bullock makes regarding future rate moves, economic growth and tariffs.
In terms of trade tariffs, President Trump last week suggested that he is unlikely to extend the 90 day pause, although he has changed his mind before. He also indicated that letters are being sent to trading partners outlining tariffs of between 10-70% on imports depending on whether he believes the country has been negotiating in good faith or not. These new tariffs are due to go into force on August 1st, so there is potentially still time for more twists and turns in this story and AUDUSD volatility may well increase across the trading week ahead as it plays out.
AUDUSD touched an 8 month high at 0.6590 last Tuesday (July 1st) before running into a wall of profit taking and eventually closing the week at 0.6550. Given the risk events facing traders that were just outlined above, this type of price action may not be that surprising.
Looking at how this week has started for AUDUSD, early trading in Asia has seen fresh selling to potential support around 0.6500 (see technical update below), which at the time of writing (0730 BST), is still holding, although bounces have so far been limited.
Technical Update: Preparing For The Week Ahead
With potential for a rate cut in Australia and concerns over tariff news this week, it perhaps isn’t too much of a surprise AUDUSD price corrections are materialising as a reaction to recent strength. While this decline may continue over the short term, traders are perhaps more focused on the potentially positive pattern of higher price highs and higher price lows that have materialised since April 9th 2025, which the chart below shows.
Of course, there is no guarantee this pattern will continue over coming sessions but being aware of support and resistance levels that may hold or exaggerate future price moves may be useful to know in advance.
Potential Support Levels:
After price strength, especially if new recovery highs within an uptrend pattern have been posted, it may prove to be Fibonacci retracement levels that act as support to any future price weakness. Calculating these on the period of price strength seen between May 12th up to the July 1st high, the 38.2% retracement level stands at 0.6501.
With the current setback now moving towards 0.6501 this morning, traders may be watching how this potential support level performs on a closing basis, as confirmed breaks lower might lead to a more extended phase of weakness that could prompt tests of 0.6473, the 50% retracement, even 0.6446, the deeper 62% retracement level.
Potential Resistance Levels:
Having seen new highs recently posted, which was the highest AUDUSD trade since mid-November 2024 (see the chart below), we can look at the weekly perspective to establish the next possible resistance levels.
As the chart shows, the latest AUDUSD activity has recently tested weekly resistance at 0.6550, which is equal to the 61.8% Fibonacci retracement of September 2024 to April 2025 weakness. It should be noted, in a similar way to last week, that it is possible AUDUSD may see trading activity above this 0.6550 resistance, but as we are using a weekly timeframe, it is this upcoming Friday's weekly close above this level that is required to suggest possibilities of a successful upside closing break.
Much will depend on future market sentiment and price trends, but weekly closes above 0.6550 if seen, may lead to further price strength towards 0.6688, the November 2024 high.
The material provided here has not been prepared accordance with legal requirements designed to promote the independence of investment research and as such is considered to be a marketing communication. Whilst it is not subject to any prohibition on dealing ahead of the dissemination of investment research, we will not seek to take any advantage before providing it to our clients.
Pepperstone doesn’t represent that the material provided here is accurate, current or complete, and therefore shouldn’t be relied upon as such. The information, whether from a third party or not, isn’t to be considered as a recommendation; or an offer to buy or sell; or the solicitation of an offer to buy or sell any security, financial product or instrument; or to participate in any particular trading strategy. It does not take into account readers’ financial situation or investment objectives. We advise any readers of this content to seek their own advice. Without the approval of Pepperstone, reproduction or redistribution of this information isn’t permitted.


New tariffs are coming. How should gold respond?📰 News information:
1. 90-day tariffs are about to expire
2. New unilateral tariffs
3. Geopolitical situation
📈 Technical Analysis:
On July 4th local time, there were constant turmoil in American politics and trade. Trump declared that the US government would send letters to trading partners that day to set new unilateral tariff rates, which would most likely take effect on August 1. He also revealed that the new tariff rates could soar to 70%. At the same time, Japan-US trade negotiations encountered obstacles, India planned to impose retaliatory tariffs on the United States, and the China-EU tariff war had also begun. At present, the news seems to be more favorable to the bulls.
From a technical point of view, gold closed higher last week, showing that there is still upward momentum this week. In the short term, we need to pay attention to the pressure in the 3365 and 3375 - 3380 areas, and the 3400 mark is a key position where bulls and bears are fighting fiercely. Before breaking through this position, we must be alert to the risk of falling back after a high rise. Pay attention to the support of 3310-3305 and 3295-3285 below. If effective support is obtained, we can consider going long. If it breaks, it may go to 3270-3260. Gold jumped to 3342 at the opening of the Asian session and then fell back. 3345 is the key in the short term. The news may affect its subsequent trend. In the short term, pay attention to the suppression of 3345 on the upper side, and further to the strong resistance area of 3365-3380. If there is resistance and pressure, you can short at a high level. The impact of recent news is erratic, so enter the market with caution and be sure to set TP and SL strictly.
🎯 Trading Points:
SELL 3330-3345
TP 3320-3310-3295
BUY 3310-3305
TP 3320-3330-3345
In addition to investment, life also includes poetry, distant places, and Allen. Facing the market is actually facing yourself, correcting your shortcomings, confronting your mistakes, and strictly disciplining yourself. I hope my analysis can help you🌐.
TVC:GOLD OANDA:XAUUSD FX:XAUUSD FOREXCOM:XAUUSD PEPPERSTONE:XAUUSD FXOPEN:XAUUSD

NFP continues to ferment, short-term trend dominated by bears📰 News information:
1. 90-day tariffs are about to expire
2. New unilateral tariffs
3. Geopolitical situation
📈 Technical Analysis:
Good morning, bros. From a technical point of view, the overall trend of the daily line is a head and shoulders top. If the bulls do not recover 3360, the bears will still be the medium-term trend. The 4H MACD indicator is dead cross running. The best position for the day to deploy the short position again is 3330-3335, and the 1H chart keeps testing the 3305 first-line support, which may be broken in the short term. At present, 3295-3285 below is a relatively important short-term support. Once it falls below, it is expected to reach 3250, which is also the point I repeatedly emphasized in the morning. The intraday operation suggestion is to rebound shorting as the main, and to go long at lows as the auxiliary. Pay attention to the 3325-3335 support area on the upper side and the 3295-3285 support on the lower side.
🎯 Trading Points:
SELL 3325-3335
TP 3315-3305-3295
BUY 3295-3285
TP 3305-3315-3325
In addition to investment, life also includes poetry, distant places, and Allen. Facing the market is actually facing yourself, correcting your shortcomings, confronting your mistakes, and strictly disciplining yourself. I hope my analysis can help you🌐.
FXOPEN:XAUUSD PEPPERSTONE:XAUUSD FOREXCOM:XAUUSD FX:XAUUSD OANDA:XAUUSD TVC:GOLD

7.7 Analysis of the latest BTC trend and operation layout📊 Cautious wait-and-see strategy (Recommendation index ⭐️⭐️⭐️⭐️⭐️)
📰 News information:
1. Digital Market Asset Transparency Act
2. Anti-CBDC Regulation Act
3. US Stablecoin Innovation Act
📈 Technical Analysis:
At present, the price of BTC is around 109,000, and the overall narrow fluctuation pattern continues. The market as a whole lacks clear direction. However, it is worth noting that the trading volume has dropped to 30.1 billion US dollars, which has further shrunk compared with the previous day, reflecting a decline in market participation.
In my opinion, the driving factors of the market include the following:
1. The continued activity of ancient whales has attracted attention
2. The technical side shows that the momentum is weakening
3. Market sentiment has turned neutral
4. ETF fund inflows remain strong
5. The "Crypto Week" policy catalyst is coming
Currently, BTC continues to consolidate within the upward trend line, but the momentum indicator shows fatigue, the 4H Bollinger Bands shrink, and the price is running near the middle track of 108,400. Enter the market cautiously during the day and pay attention to the support of 107,000
🎯 Trading Points:
SELL 109,000-110,000
TP 107,500-107,000
In addition to investment, life also includes poetry, distant places, and Allen. Facing the market is actually facing yourself, correcting your shortcomings, facing your mistakes, and being strict with yourself. I share free trading strategies and analysis ideas every day for reference by bros. I hope my analysis can help you.
BITSTAMP:BTCUSD

Gold shorts may continue to 3280 or even 3255Gold started to fall from around 3342 in the Asian session, and currently hit a low of around 3305. This is completely consistent with my prediction: "Before gold stabilizes at 3340, it is still in a short trend. Gold shorts may counterattack at any time and look at the target area in turn: 3315-3305." Currently, gold has reached the target area as expected.
There is no doubt that gold is still in an obvious short arrangement at present, and gold shorts may have just begun. For the next short-term trading, we still focus on shorting gold, so what we are most concerned about now is where gold can rebound and where is the most suitable short entry? ! From the current structure of gold, gold is under pressure from the short-term head and shoulders technical structure. This resistance structure compresses the rebound limit in the short term to the 3335-3340 area; and the short-term resistance area is located in the 3320-3330 area; once gold is under pressure and falls again, I think it is very likely that gold will fall to the 3295-3285 area again, and may even extend to the 3365-3355 area.
Therefore, I think shorting gold is still the first choice for short-term trading; you can consider shorting gold in the 3320-3340 area, looking at the target area of 3290-3280-3270
USDJPY LONGMarket structure bullish on HTFs DH
Entry at both Weekly and Daily AOi
Weekly Rejection at AOi
Daily Rejection At AOi
Previous Structure point Daily
Around Psychological Level 144.000
H4 Candlestick rejection
Rejection from Previous structure
Levels 2.91
Entry 95%
REMEMBER : Trading is a Game Of Probability
: Manage Your Risk
: Be Patient
: Every Moment Is Unique
: Rinse, Wash, Repeat!
: Christ is King.

GBPNZD SHORT Market structure bearish at AOi DW
Entry at Weekly and Daily AOi
Weekly Rejection at AOi
Previous Structure point Weekly
Daily Rejection at AOi
Previous Daily Structure Point at AOi
Around Psychological Level 2.26000
H4 Candlestick rejection
Levels 5.14
Entry 95%
REMEMBER : Trading is a Game Of Probability
: Manage Your Risk
: Be Patient
: Every Moment Is Unique
: Rinse, Wash, Repeat!
: Christ is King.

POLKADOT on last supportI think $3 is the very strong support for DOT, and the blue zone will hold, and i believe $18 resistance is very reachable for the next few months after $10 resistance got broken.

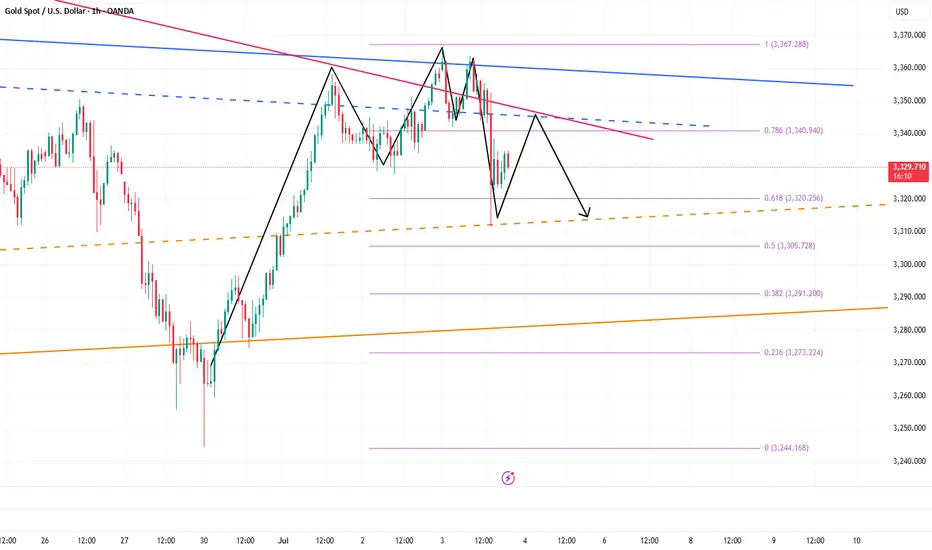
Continue to short gold, bears will exert force againAffected by the NFP market, gold fell precipitously, almost giving back 50% of the gains in the previous wave, and the short-selling performance was particularly strong; technically, gold successfully built a double-top structural resistance in the 3365-3363 area in the short term, which played a technical suppression role in the short term. As gold fell, the current short-term resistance moved down to the 3340-3350 area;
On the other hand, although gold began to rebound after falling to around 3312, it clearly showed the characteristics of weak rebound, and it did not even stand above 3340 once, and the long forces were insufficient; and technically, a single lower shadow line was not enough to support the continued rebound of gold, so gold still had the need to retrace the support below from a technical perspective; and once gold fell again, it was very likely to test the 3305-3295 area again.
So I think we can take advantage of the rebound of gold to short gold again. We can still short gold with the 3340-3350 area as resistance and look at the target area: 3315-3305-3295.
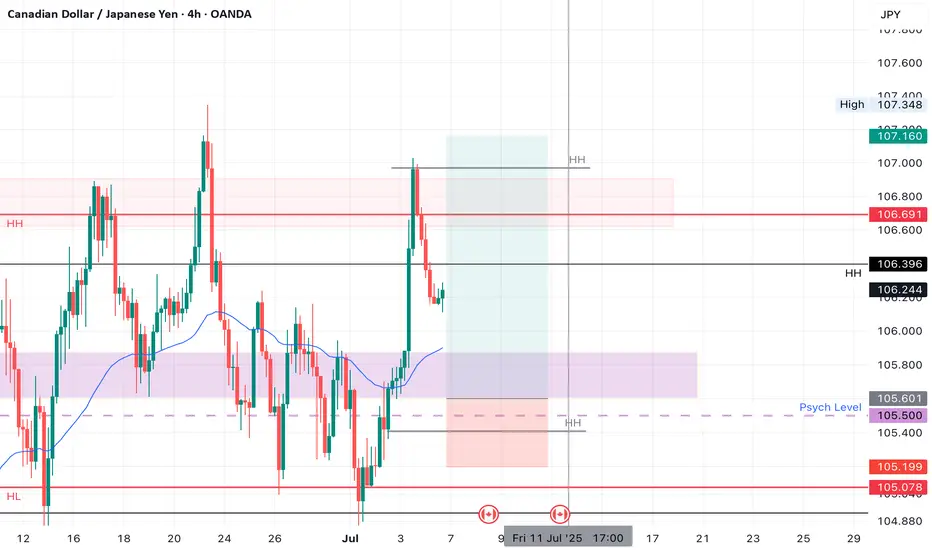
CADJPY: Bullish Move From Support Confirmed?! 🇨🇦🇯🇵
CADJPY may bounce from a key daily horizontal support cluster.
As a confirmation signal, I spotted a bullish imbalance candle
on a 4H time frame after its deep test.
I expect a pullback to 106.65
❤️Please, support my work with like, thank you!❤️
I am part of Trade Nation's Influencer program and receive a monthly fee for using their TradingView charts in my analysis.

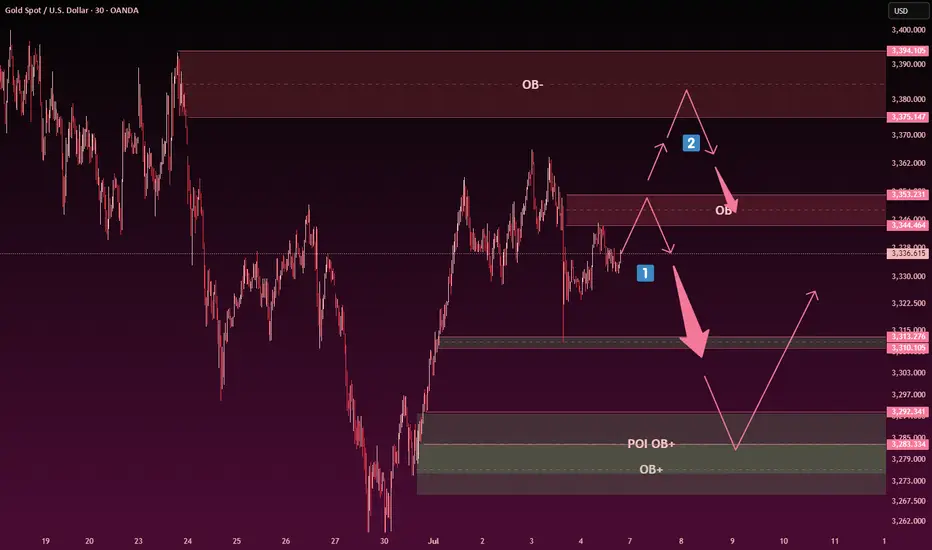
Gold (XAUUSD): Potential Short from Bearish OPotential Short Opportunity After Reaction at OB-
The chart shows a potential short setup on Gold Spot / U.S. Dollar. Price has recently moved upwards, labeled as swing "1", and is approaching a bearish order block (OB-) identified in the $3,344 - $3,353 area.
We could see a reaction at this OB- level, leading to a downward move as indicated by the arrow. The next potential target for this downward move could be the Point of Interest (POI) which aligns with a bullish order block (OB+) around the $3,283 - $3,288 zone.
Alternatively, if price pushes through the initial OB-, the next bearish OB- around $3,375 - $3,385 could act as further resistance, potentially leading to a reversal as shown by swing "2".
Traders could look for confirmation signals around these OB- levels to initiate short positions, targeting the POI OB+ as a primary target. A break below the POI OB+ could open the way for further downside.
Consider price action and volume at the highlighted zones for better entry and exit decisions.