Long trade
15min TF overview
🟩 Trade Type: Buyside Trade
Pair: ETHUSDT
Date: Sunday, 3rd August 2025
Time: 5:15 PM
Session: London–New York Overlap (LND Session PM)
Timeframe: 15 minutes
🔽 Entry Parameters
Entry Level: 3,455.23
Stop Loss: 3,436.73 (-0.54%)
Take Profit: 3,877.00 (+12.21%)
Risk-to-Reward (RR): 22:8
📉 Market Structure & Technicals
Trend Context:
Price reversed from a steep bearish trend and showed signs of a bullish momentum shift.
EMA/WMA Levels:
EMA (blue) and WMA (yellow) show a bullish crossover at the point of entry
Both MAs began to slope upward, confirming the trend shift.
Liquidity Observations:
Clean sweep of prior lows below 3,500 preceding entry.
Price traded back into a premium zone after reacting from a deep discount.
🧠 Narrative / Rationale
Set up Narrative:
ETH completed a strong downtrend and printed a bullish market structure shift (MSS) on the 15-minute TF. Entry was taken after price reclaimed the (POI) and confirmed a higher low.
Current Status: Trade in progress, profit levels partially hit.
TP aligns with the previous supply zone or relatively equal highs around 3,784.
Additional liquidity above 3,877–3,915 for extended targets if trade continues.
Candlestick Analysis

GBPUSD: Back to Bullish Trend?!GBPUSD pair is showing signs of recovery after a prolonged bearish trend.
A confirmed bullish breakout from a significant daily resistance level indicates strong buying pressure.
I anticipate that the market will continue to rise and approach the 1.3515 level shortly.

U.S. Dollar Index (DXY) – 15M Chart Analysis | Aug 8, 20251. Market Structure:
DXY is trading in a short-term range between 98.471 resistance and 97.952 support, following a sharp downtrend from the 99.072 high.
2. Supply Zone Pressure:
The 98.471 level acts as a strong intraday supply, repeatedly rejecting price and limiting bullish momentum.
3. Demand Zone Cushion:
The 97.952 level is holding as immediate support. Below that, the yellow zone around 97.60–97.45 is a major demand area where buyers may step in.
4. Momentum Bias:
Lower highs from the recent peaks signal ongoing bearish pressure. Short-term rallies are getting sold into, suggesting sellers control the market.
5. Next Move:
Bullish: Break above 98.471 opens path to 98.829–99.072 .
Bearish: Break below 97.952 targets the 97.60–97.45 demand zone.

US CRUDE OIL(WTI): Important Breakout📉USOIL has fallen and closed below a significant daily support level,
which has now become a strong resistance.
I anticipate a downward trend towards the support level at 60.76.

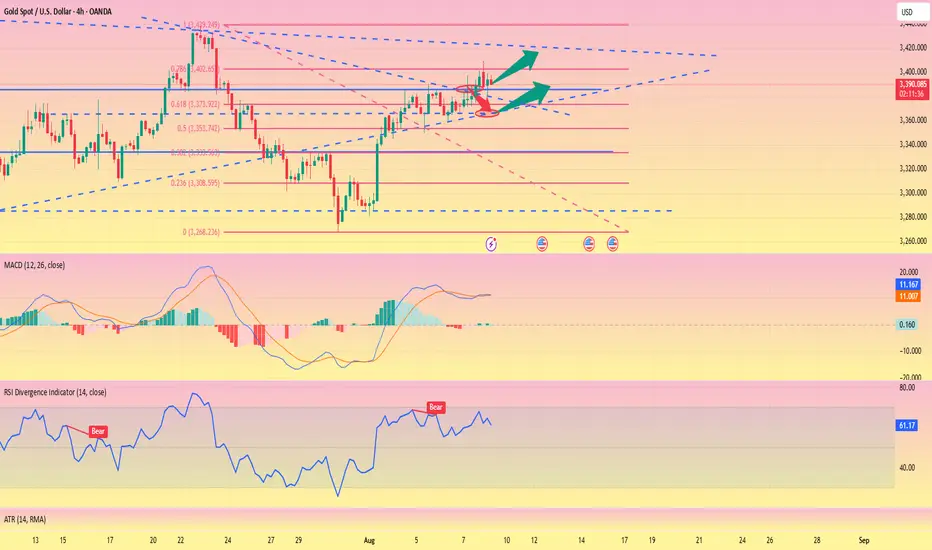
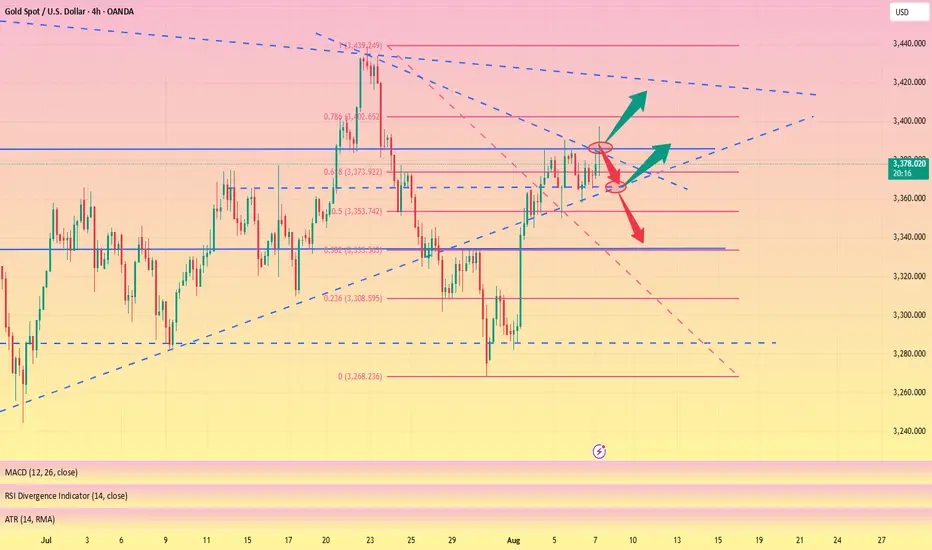
The trend has not changed, go long and look for new highs#XAUUSD
Gold fluctuated at a high level in the Asian session, and the market has not yet taken a clear direction. Despite the current market conditions being extremely flat, caution remains regarding the potential for wider volatility after a breakout above key levels. The current short-term resistance area above gold is 3400-3410. With the breakthrough of yesterday's high today, the short-term support level will also move up. The middle track of the Bollinger band at the hourly level below has also risen to around 3390. The focus of the European session is whether gold can effectively break through the short-term suppression. If the European session is under pressure and encounters resistance, then gold may have a correction. It can be considered to retreat to the 3390-3378 area below and stabilize before lightly long gold to see new highs. Be wary of potential black swan events on Friday.
Gold Poised for a Surge: 3400 in Sight, 3430 Within ReachToday, gold retreated to a low of around 3350 before rebounding again, reaching a high of around 3390. During this process, we seized the opportunity to go long on gold near 3356 and closed the trade by successfully hitting TP: 3380, making a profit of 240 pips!
Although gold retreated after reaching 3390, I had originally planned to short gold near 3395, but gold didn't reach that level during the rally, so our shorting plan had to be shelved. Currently, it's trading in a narrow range around 3380. Clearly, I'm not considering shorting gold after a pullback.
Although gold retreated to around 3350 during the day, it did not destroy the current bullish structure of gold. In addition, gold regained the 3370-3375 area again during the rebound, and the gold bulls became even stronger. Therefore, I have now lost the desire and interest to short gold. Gold has currently reached a high near 3390. Given its current structure and strength, I don't believe 3390 is the current high. Gold is likely to attempt to break through 3400, and even has the potential to continue its rise to the 3420-3430 range. As the center of gravity of gold shifts upward, the current short-term support has moved up to the 3375-3365 area; and the relatively strong support is located in the 3360-3350 area.
Therefore, for short-term trading, I prefer to start trying to go long on gold after it retreats to the 3375-3365 area, and expect gold to hit 3400 as expected, or even continue to the 3420-3430 area.

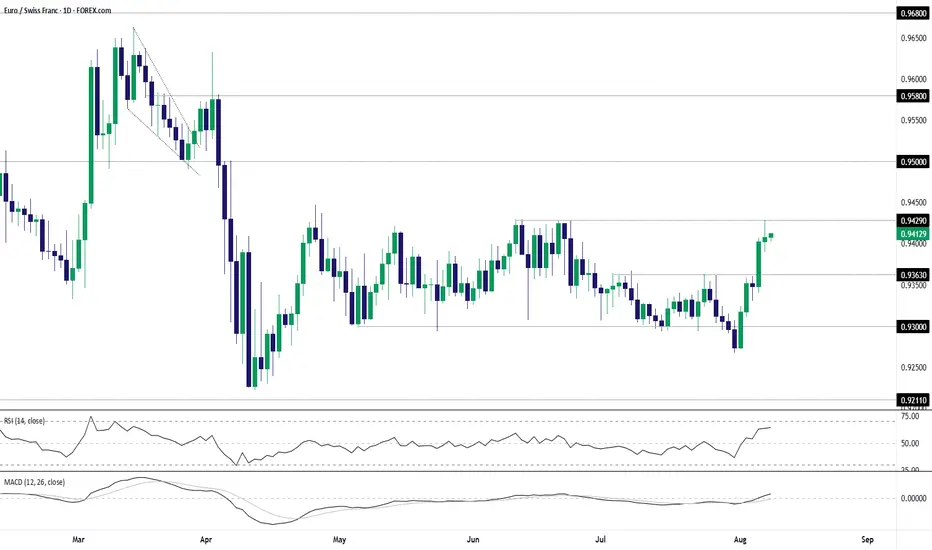
EUR/CHF Bulls Test Range Highs Following Sharp ReboundEUR/CHF sits just beneath the top of the range it’s been trading in over the past three months, providing a variety of potential setups depending on how the near-term price action evolves.
The bullish engulfing candle on the daily chart last Friday set the tone for the price action seen this week, sparking a significant bullish reversal after a false break of .9300 support. The subsequent move saw the price take out resistance at .9363 before stalling at .9429—a level that capped the pair in June.
Given recent price action, traders should be on alert for a potential extension of the bullish move.
Should we see a break and close above .9429, it would allow for longs to be established with a stop beneath for protection, targeting resistance at .9500. Offers may be encountered just beneath .9450, presenting a potential hurdle for bulls along the way.
Alternatively, if the pair cannot break .9429 meaningfully, the setup could be flipped with shorts established beneath the level with a stop above for protection. Potential targets include .9363 or .9300.
Momentum indicators have skewed bullish over the past week, with RSI (14) trending higher but not yet overbought, while MACD has crossed the signal line and now sits in positive territory. It’s not a roaring endorsement for a bullish bias, but it does favour upside rather than downside in the near term.
Long trade
📘 Trade Journal Entry
🔹 Pair: LINKUSDT
📅 Date: Friday, 8th August 2025
🕖 Time: 7:30 PM
🗺 Session: NY to Tokyo Session PM
⏱ Timeframe: 15-Minute TF
📈 Direction: Buyside
📊 Trade Details
Parameter Value
Entry Price 16.668
Profit Target 18.229 (+9.37%)
Stop Loss 16.562 (−0.64%)
Risk-Reward 14.73: 1
📌 Technical Context
Entry Zone: The trade was initiated after observing a sell-side liquidity sweep, followed by an internal break of structure (BOS), which supported the shift toward bullish intent. The trade aligns with a Wyckoff-style accumulation schematic, with a Phase C spring-type event visible. We anticipate that Phase D — a trending move within the range — is now underway.

Bullish Outlook Intact: Gold Targeting 3400-3410Gold encountered resistance and retreated several times on its way to 3400, but it remained above 3370 during the pullback, perfectly maintaining the integrity of its volatile upward trend. Therefore, even though gold's upward momentum has weakened, I still believe that due to structural support, gold still has the potential to reach the 3400-3410 area, and may even continue its bullish trend to the 3420-3430 area.
As gold prices rise, market sentiment tends to be more optimistic, and the price behavior reflected by the candlestick chart becomes clearer. The lows of gold continue to rise, and the highs always insist on setting new highs in the process of rising. The oscillating upward structure is particularly obvious. While greatly limiting the retracement space, it also greatly consolidates the support structure below and is conducive to further rises in gold. At present, gold has been confirmed to have stabilized above 3370, so gold may not give another chance to fall back to the 3360-3350 area.
Then in the next short-term trading, the gold pullback is a buying opportunity. We focus on the opportunity to participate in long gold after gold retreats to 3380-3370. The target will first look at the 3400-3410 area, and the higher target area is in the 3420-3430 area.

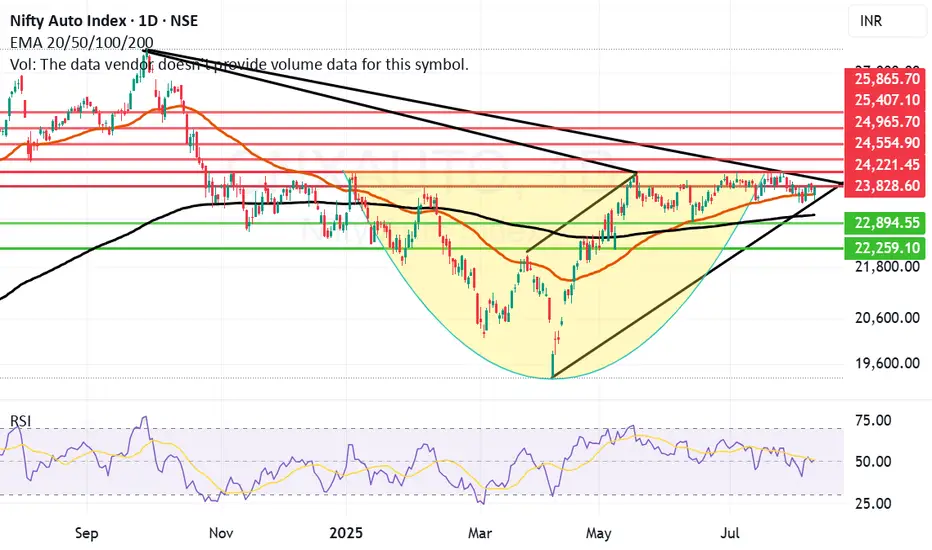
Auto Index has consolidated and might be in search of a BreakoutCNX Auto Index has consolidated for a long time in the range of 22800 and 24250 since May 25. If the index can cross the resistance zone between 23828 and 24221 and if we get a weekly closing above 24221 or 24250 then we might see a rally in this index towards 25K or even near 26K. Currently the index closed on Thursday at 23808. Lot of Auto and Auto component companies gave good results during the last quarter.
When the index is strong and gives a breakout it means that the undercurrent in majority of the companies which constitute the index is strong. There will be some companies which will obviously drag the index down as there can not be one way traffic. To know amongst these which companies to invest in an investor should look at fundamentals of the company, recent and past results, cash flows, Sales and order books, EPS and many other factors. While a Technical investor should look at charts of the companies before investing.
A smart investor would be a person who looks at both fundamentals and technicals of the company and invests in a fundamentally strong company which is giving a technical breakout. For this one has to learn Techno-Funda analysis. I have written a book on the subject called The Happy Candles Way To Wealth Creation. In this book you will learn the basics of Techno-Funda investing. The book is available on Amazon and is one of the highest rated books in its category. With an approval rating of 4.8/5 as on date. Lot of investors call it as a Hand book for Techno Funda investing. Most of the chapters are standalone and can be read at your own accord. It will be really helpful to you.
The companies that constitute this index are Maruti Suzuki, Tata Motors, M&M, MRF, TI India, Exide, Samvardhana Motherson, Ashok Leyland, Hero Moto, TVS Motors, Bharat Forge, Bosch, Balkrishna, Bajaj Auto and Eicher Motors. Amongst these companies due to Tariff uncertainties one should focus on companies which will be least dependent on export and have major market which caters to local consumption or exports not related to US. Two-Wheeler manufacturers and Two Wheeler component manufacturers are looking particularly strong in the index as most of them are consumed and sold locally. The rains so far this monsoon have been good so the Farm equipment and Tractor manufacturers also can try to push the index upwards if the monsoon remains strong in India.
If we get a closing above 24250 we can easily see index moving 1000 to 1500 points northwards if positivity in the index sustains. The resistances currently for the Auto index are at 23828, 24221, 24554, 24965, 25407 and 25865. The supports for Auto index remain at 23620 (Mother line support), 23087 (Father line support), 22894 (Below this level index becomes very weak) and 22259. To know more about Mother line, Father line and my Mother, Father and Small child theory you should once again I recommend, read my book the Happy Candles Way to Wealth Creation.
Disclaimer: The above information is provided for educational purpose, analysis and paper trading only. Please don't treat this as a buy or sell recommendation for the stock or index. The Techno-Funda analysis is based on data that is more than 3 months old. Supports and Resistances are determined by historic past peaks and Valley in the chart. Many other indicators and patterns like EMA, RSI, MACD, Volumes, Fibonacci, parallel channel etc. use historic data which is 3 months or older cyclical points. There is no guarantee they will work in future as markets are highly volatile and swings in prices are also due to macro and micro factors based on actions taken by the company as well as region and global events. Equity investment is subject to risks. I or my clients or family members might have positions in the stocks that we mention in our educational posts. We will not be responsible for any Profit or loss that may occur due to any financial decision taken based on any data provided in this message. Do consult your investment advisor before taking any financial decisions. Stop losses should be an important part of any investment in equity.
Don’t Blink — Gold Charging Toward 3400!Overnight, we entered a long trade at 3365 and successfully closed the trade by hitting TP: 3395, locking in nearly 300pips of profit. This was a very successful and accurate trading strategy.
Just now, gold became very crazy after rising, and plunged directly from around 3397 to around 3372. It was a very scary and crazy diving action. In fact, I am not worried about it. On the contrary, I am very happy that it provides me with another opportunity to enter the market and go long on gold. I've already entered a long position in gold again, as planned, in the 3375-3365 area.
Regarding the recent plunge in gold, I think it was intended to scare off the long positions that were somewhat loose in their intentions. Although gold has fallen sharply, it is still in a recent volatile upward structure. The volatile upward structure has not been destroyed in the short term, so I believe that gold will not have much room for retracement for the time being under the support of the bullish structure. On the contrary, I believe that after gold touches around 3397, even if it is weak, it will try to hit the 3400 mark, and it is even expected to continue the bullish trend to the 3420-3430 area.
There may be many friends in the market waiting for the opportunity to enter the long market at 3350 or even 3340, but what I want to say is that under the support of the gold bull structure, the downward space has been greatly limited. In the short term, gold may not go to such a low position at all, so relatively speaking, I prefer to go long on gold in the 3375-3365 area, and I have indeed done so!

Nifty Analysis EOD – August 7, 2025 – Thursday🟢 Nifty Analysis EOD – August 7, 2025 – Thursday 🔴
A Trap, a Reversal, and a Breathless Rally — Did You Catch It?
🗞 Nifty Summary
Today was expected to be volatile, but few were prepared for how wildly Nifty behaved.
After a gap-down of 110 points on the back of negative global cues, Nifty immediately started filling the gap and reached the Previous Day Low (PDL). However, strong rejection at PDL sent prices tumbling — slicing below the Open, IB Low, and even the Current Day Low, marking a sharp low at 24,387.
Then came the bear trap.
A brief breakdown to 24,344.15 looked like a breakdown, but instead triggered a sharp liquidity grab, launching a vertical move upward. From that bottom, Nifty surged in a breathtaking rally — not a single 5-min candle broke its previous candle’s low, signaling relentless buying. Almost every resistance zone — Swing High, VWAP, PDL/S1, CPR, Weekly Low — got taken out in one single breath.
Did you ride it?
Honestly — I didn’t. I was frozen watching this dramatic reversal unfold.
Still, today’s super recovery puts the index back within its known range. Now, bulls need a close above 24,660–24,675 to confirm momentum.
📉 Intraday 5 Min Chart Overview
🧭 Intraday Price Action Flow
9:15 AM: Opens 110 points down at 24,467.10
9:15–10:30 AM: Recovers swiftly to PDL, but fails there.
10:25 AM – 11:05 PM: Sharp fall — breaches CDL & IB Low → makes new day low at 24,387
1:20 PM Onwards: Attempts consolidation; false breakdown at 24,344.15
2:00 PM – 3:30 PM: Monster rally → No candle breaks prior low; bulls dominate to close at 24,626.65
📉 Daily Time Frame Chart with Intraday Levels
🕯 Daily Candle Breakdown
Open: 24,464.20
High: 24,634.20
Low: 24,344.15
Close: 24,596.15
Change: +21.95 (+0.09%)
🔍 Candle Structure:
Real Body: Green → +131.95 pts
Upper Wick: 38.05 pts
Lower Wick: 120.05 pts
🧠 Interpretation:
Strong rejection from intraday lows near 24,344
Long lower wick shows dip buying strength
Closed near the highs = bulls dominated the end
Still within larger range → needs breakout above 24,675 for follow-through
🔥 Candle Type:
A bullish recovery candle, hammer-like, but within a sideways structure — shows aggressive buying near important demand zone (24,340–24,380).
📈 Updated Short-Term View – 7th August 2025
Support Zone: 24,340 – 24,380
Resistance Zone: 24,620 – 24,675
Bias: Neutral with a bullish tilt, unless 24,340 breaks decisively.
🎯 Trading Insight
A close above 24,660–24,675 may lead to further upside — possibly testing 24,735–24,780
Failure to hold above 24,460 will shift bias back to bearish
🛡 5 Min Intraday Chart
🥷 Gladiator Strategy Update
ATR: 205.09
IB Range: 82.85 → Medium
Market Structure: ImBalanced
⚔️ Trade Summary:
🕙 10:25 AM – Short Entry → Trail SL Hit (R:R = 1:1.8)
🧱 Support & Resistance Levels
🔼 Resistance Zones:
24,620
24,660 ~ 24,675
24,725 ~ 24,735
24,780 ~ 24,795
24,860 ~ 24,880
🔽 Support Zones:
24,542 ~ 24,535
24,500
24,470 ~ 24,460
24,380 ~ 24,344
💬 Final Thoughts
"Markets reward patience and punish rigidity."
Today was a masterclass in trap-reversal-breakout structure. While many were either trapped or missed the move, this type of price action reminds us — be ready, but never rigid.
Now all eyes on 24,675 — can bulls push above it and sustain?
✏️ Disclaimer:
This analysis reflects personal views and is not trading advice. Please consult your financial advisor before making decisions.

NZDUSD SHORTsMarket structure bearish on HTFs DW
Entry on Weekly and Daily AOi
Weekly Rejection at At AOi
Previous Weekly Structure Point
Daily Rejection at AOi
Daily EMA retest
Previous Structure point Daily
Around Psychological Level 0.59500
H4 Candlestick rejection
Levels 3.67
Entry 100%
REMEMBER : Trading is a Game Of Probability
: Manage Your Risk
: Be Patient
: Every Moment Is Unique
: Rinse, Wash, Repeat!
: Christ is King.

GBPUSD SHORT Market structure bearish on HTFs DW
Entry at Both Weekly and Daily AOi
Weekly rejection at AOi
Weekly Previous Structure point
Daily Rejection at AOi
Previous Structure point Daily
Around Psychological Level 1.34000
H4 Candlestick rejection
Levels 4.8
Entry 95%
REMEMBER : Trading is a Game Of Probability
: Manage Your Risk
: Be Patient
: Every Moment Is Unique
: Rinse, Wash, Repeat!
: Christ is King.

AUDCAD SHORT Market structure bearish on HTFs 3
Entry at both Daily and Weekly AOi
Weekly Rejection at AOi
Previous Weekly Structure Point
Daily Rejection at AOi
Previous Structure point Daily
Around Psych Level 0.89500
H4 Candlestick rejection
Rejection from Previous structure
Levels 4.18
Entry 120%
REMEMBER : Trading is a Game Of Probability
: Manage Your Risk
: Be Patient
: Every Moment Is Unique
: Rinse, Wash, Repeat!
: Christ is King.

The triangle pattern is about to break through and hit 3400#XAUUSD
Although the price of gold was too high last night due to the rise in risk aversion, the upward momentum weakened significantly in the evening, and it fluctuated sideways at a high level. Gold is currently consolidating within a triangle pattern, with a short-term price increase reaching the triangle's boundary. A break above 3385 could lead to significant intraday gains. Meanwhile, the downside is defending short-term support at 3365. As long as this support level remains intact, the bullish trend remains intact. If the European session gives an opportunity to fall back to the 3375-3365 support area without breaking, you can consider going long and look at 3395-3405, and if it breaks, look at 3415.
AUDUSD SWING: SHORT-TERM BEARISH OPPORTUNITY (TRICKY)Hi there,
I'd like to see AUDUSD trade lower after running multiple highs and lows and creating a MSS on the weekly chart.
Price is also currently trading in-between weekly support and resistance levels which could aid the trade play out. The only concern I have is that the current region price is playing at is quite choppy - hence, price might not move cleanly.
Anyways, watchout for my next post tomorrow.
Cheers,
Jabari

GBPUSD SWING: SHORT OPPORTUNITYHi there,
Of all the USD pairs, I think GBPUSD is the weakest and I speculate lower prices.
At the very least, to hunt the equal lows the market created by not taking the previous low just before the monthly FVG. That action is suspect - it will induce buyers and drop more shorts on them.
Anyways, watch out for my next post.
Cheers,
Jabari

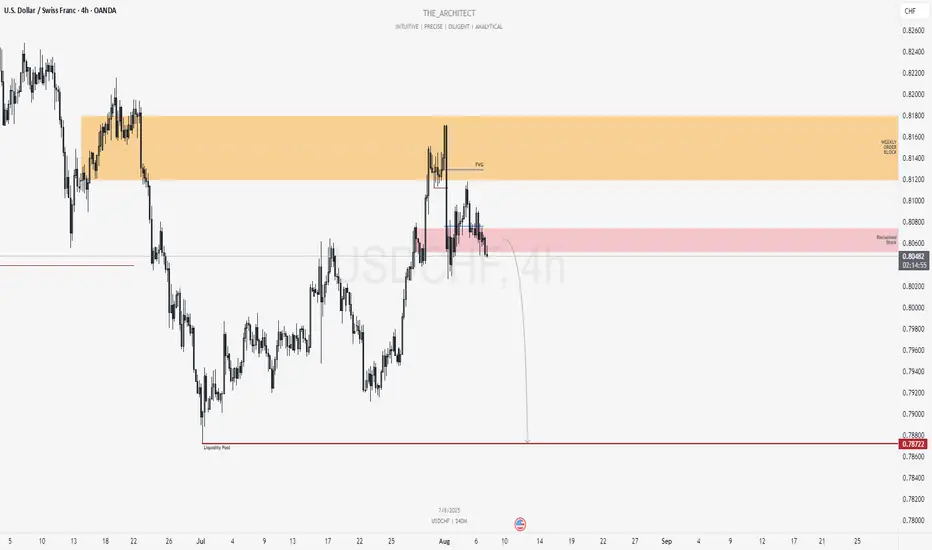
USDCHF: Bearish Continuation Setup From Reclaimed Supply ZoneGreetings Traders,
In today’s analysis of USDCHF, recent price action confirms the presence of bearish institutional order flow. This reinforces our directional bias to the downside, prompting us to focus on strategic selling opportunities.
Key Observations on H4:
Weekly Bearish Order Block: Price recently tapped into a weekly bearish order block, which triggered a decisive market structure shift to the downside. This confirms the order block's validity as a firm resistance zone.
Bearish Fair Value Gap (FVG): Following the market structure shift, price retraced into an H4 FVG. This zone acted as resistance, maintaining bearish momentum.
Reclaimed Mitigation Block: After breaking through a previous mitigation block, the area now functions as a reclaimed order block. We expect this to serve as a high-probability resistance zone moving forward.
Trading Plan:
Entry Strategy: Monitor lower timeframes (M15 and below) for confirmation entries within the reclaimed order block.
Target Objective: The current draw on liquidity is the discount-side liquidity pools, which aligns with our bearish bias.
As always, remain patient, wait for solid confirmations, and manage your risk with precision.
Kind regards,
The Architect 🏛️📉
XAU/USD 07 August 2025 Intraday AnalysisH4 Analysis:
-> Swing: Bullish.
-> Internal: Bullish.
You will note that price has targeted weak internal high on three separate occasions which has now formed a triple top, this is a bearish reversal pattern and proving this zone is a strong supply level. This is in-line with HTF bearish pullback phase.
Remainder of analysis and bias remains the same as analysis dated 23 April 2025.
Price has now printed a bearish CHoCH according to my analysis yesterday.
Price is now trading within an established internal range.
Intraday Expectation:
Price to trade down to either discount of internal 50% EQ, or H4 demand zone before targeting weak internal high priced at 3,500.200.
Note:
The Federal Reserve’s sustained dovish stance, coupled with ongoing geopolitical uncertainties, is likely to prolong heightened volatility in the gold market. Given this elevated risk environment, traders should exercise caution and recalibrate risk management strategies to navigate potential price fluctuations effectively.
Additionally, gold pricing remains sensitive to broader macroeconomic developments, including policy decisions under President Trump. Shifts in geopolitical strategy and economic directives could further amplify uncertainty, contributing to market repricing dynamics.
H4 Chart:
M15 Analysis:
-> Swing: Bullish.
-> Internal: Bullish.
H4 Timeframe - Price has failed to target weak internal high, therefore, it would not be unrealistic if price printed a bearish iBOS.
The remainder of my analysis shall remain the same as analysis dated 13 June 2025, apart from target price.
As per my analysis dated 22 May 2025 whereby I mentioned price can be seen to be reacting at discount of 50% EQ on H4 timeframe, therefore, it is a viable alternative that price could potentially print a bullish iBOS on M15 timeframe despite internal structure being bearish.
Price has printed a bullish iBOS followed by a bearish CHoCH, which indicates, but does not confirm, bearish pullback phase initiation. I will however continue to monitor, with respect to depth of pullback.
Intraday Expectation:
Price to continue bearish, react at either M15 supply zone, or discount of 50% internal EQ before targeting weak internal high priced at 3,451.375.
Note:
Gold remains highly volatile amid the Federal Reserve's continued dovish stance, persistent and escalating geopolitical uncertainties. Traders should implement robust risk management strategies and remain vigilant, as price swings may become more pronounced in this elevated volatility environment.
Additionally, President Trump’s recent tariff announcements are expected to further amplify market turbulence, potentially triggering sharp price fluctuations and whipsaws.
M15 Chart:

The bullish trend remains unchanged, seize the opportunityAfter today's opening, gold continued the bullish trend of yesterday. Judging from the daily line, gold has continued to rise, and it may only be a matter of time before it reaches a higher level. Judging from the 4H chart, the technical indicators are dead cross and shrinking, and the flexible indicators are repairing upward. The short-term middle track support is around 3372, and the upper side pays attention to the short-term pressure of 3395-3405. If the European session fails to effectively break through the short-term resistance, it will give the opportunity to test the 3380-3370 support again. If it is not broken, you can consider continuing to go long.
OANDA:XAUUSD

EURCHF: Intraday Bearish Move?! 🇪🇺🇨🇭
EURCHF reached a key horizontal resistance level.
I think that there is a high probability that the price
will retrace from that.
The closest intraday support is 0.93825,
it will be the goal for the sellers.
❤️Please, support my work with like, thank you!❤️
I am part of Trade Nation's Influencer program and receive a monthly fee for using their TradingView charts in my analysis.

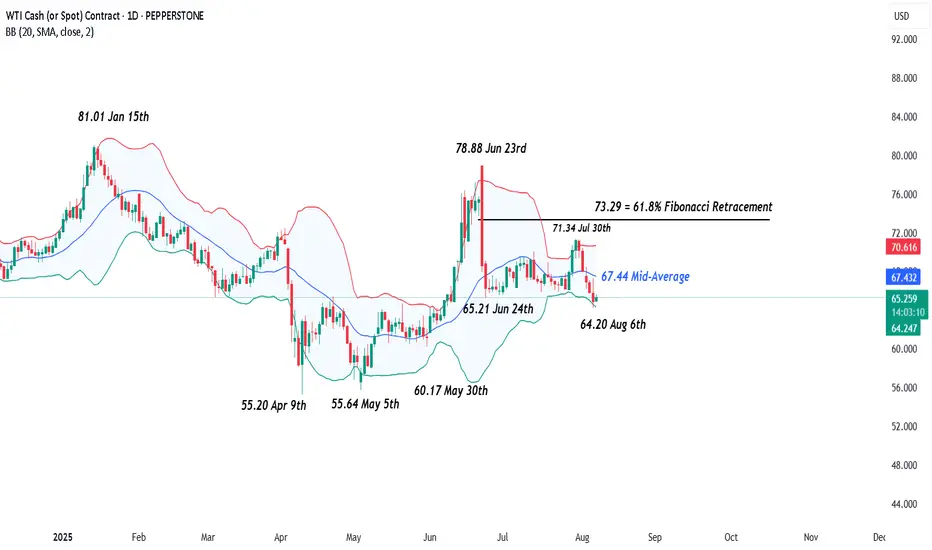
Could Oil (WTI) Be Breaking Out of its Range?Oil (WTI) has moved back to the forefront of traders thinking this week after OPEC+’s weekend decision to raise September production by circa 550k barrels per day. They also put traders on notice that all options remain open regarding further production increases to replace another output layer, amounting to 1.66 million barrels per day that has been offline since 2023. A decision on what comes next is due to take place at a meeting scheduled for September 7th.
Perhaps unsurprisingly, this potential for extra production (supply) being unleashed into the market later in the year has led to some downside pressure for Oil this week. This is because it comes at a time of uncertainty surrounding Oil demand due to possible weaknesses in the global economy, created by President Trump’s tariff policies. Oil (WTI) prices have fallen 4.8% from opening levels on Monday to post a new 1 month low at 64.20 yesterday, a level that it currently holding (more on this in technical update below).
Looking forward, one of the challenges traders are facing for where Oil moves next is President Trump’s August 8th deadline for Russia to end the war with Ukraine or face fresh sanctions on its energy exports. President Trump has also suggested he would increase tariffs on countries buying Oil from Russia, including China, although right now India is his initial focal point in this regard and yesterday, he doubled tariffs on Indian goods (25% to 50%) due to the country’s purchases of Russian Oil. These new tariffs are due to start in 3 weeks’ time.
With so much uncertainty surrounding Oil prices, including reports of a possible meeting between President Trump and President Putin being scheduled at some stage next week, it could be useful to be prepared for a potential increase in Oil (WTI) price volatility.
Technical Update: New Correction Lows Posted
Having seen the sharp sell-off in Oil between June 23rd and 24th 2025, a period of more balanced activity developed, as a reaction to over-extended downside conditions in price.
As the chart above shows, this resulted in a phase of sideways price activity between support marked by the 65.21 June 24th low, up to 71.34, which is equal to the July 30th failure high. However, price declines on Wednesday this week, have produced closes below 65.21, in the process of posting a new correction low at 64.20.
While communications between the US and Russia regarding the war in Ukraine are on-going, this type of break lower in the Oil price is no guarantee of future declines, so it could be helpful to assess what could be the potential support and resistance levels to focus on, just in case the outcome of these events lead to an increase in Oil price volatility.
Possible Next Support Levels:
As we have said above, the August 6th price weakness has seen a new correction low posted at 64.20, and this may now be viewed as the first support focus. Closes below 64.20 might then lead to a more extended decline in price.
Such moves would indicate the potential of further price weakness, with the next support possibly marked by the May 30th session low at 60.17, perhaps further towards 55.64 (May 5th low), if this level in turn gives way.
Potential Resistance Levels:
On the topside, within a period of price weakness, it can be the declining Bollinger mid-average that reflects the first possible resistance, and for Oil this currently stands at 67.44. Closing breaks above 67.44, if seen, could prompt further attempts to develop price strength to test higher resistance levels.
The first possible level would appear to be marked by 71.34, which is the July 30th session high. If this level was broken on a closing basis, it might then lead to tests of 73.29, which is equal to the 61.8% Fibonacci retracement of the June 23rd to June 24th sell-off.
The material provided here has not been prepared accordance with legal requirements designed to promote the independence of investment research and as such is considered to be a marketing communication. Whilst it is not subject to any prohibition on dealing ahead of the dissemination of investment research, we will not seek to take any advantage before providing it to our clients.
Pepperstone doesn’t represent that the material provided here is accurate, current or complete, and therefore shouldn’t be relied upon as such. The information, whether from a third party or not, isn’t to be considered as a recommendation; or an offer to buy or sell; or the solicitation of an offer to buy or sell any security, financial product or instrument; or to participate in any particular trading strategy. It does not take into account readers’ financial situation or investment objectives. We advise any readers of this content to seek their own advice. Without the approval of Pepperstone, reproduction or redistribution of this information isn’t permitted.